
 Facebook
 X
X
 Pinterest
 Copy Link

The following analysis of select Montana real estate markets is provided by Windermere Real Estate Chief Economist Matthew Gardner. We hope that this information may assist you with making better-informed real estate decisions. For further information about the housing market in your area, please don’t hesitate to contact your Windermere Real Estate agent.
Regional Economic Overview
Along with the rest of the nation, Montana’s job market was significantly impacted by COVID-19, losing 63,300 jobs statewide. However, as of the end of the second quarter of this year, Montana has recovered all but 10,000 of them. Although this puts employment levels 2% lower than the pre-pandemic peak, the momentum of jobs returning has slowed. Employment levels dropped by 1,800 jobs in the second quarter. The June unemployment rate in the state was 3.7%, well below the national rate of 5.9%. Unemployment numbers ticked up one tenth of a percent between May and June. In the counties contained in this report, the lowest jobless rate was in Billings at 3.3%. Great Falls’ rate was 3.4% and Missoula came in at 3.5%. I am hopeful that the economy will pick up speed as we move through the balance of 2021, but I remain mindful of the uptick in new COVID-19 cases and their potential to undermine the state’s recovery.
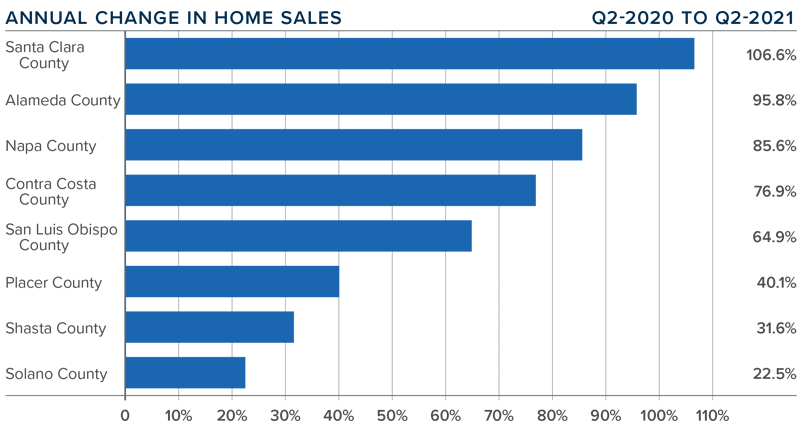
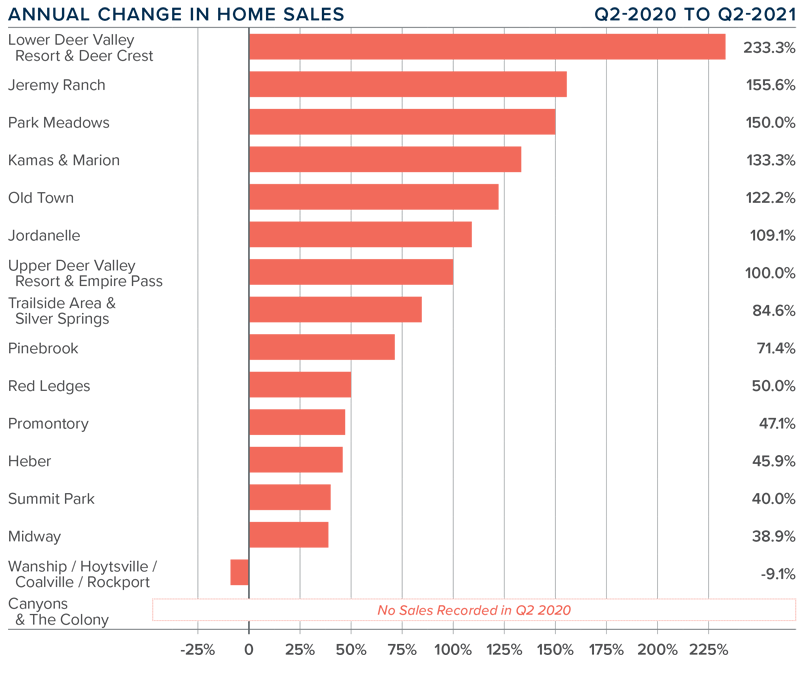
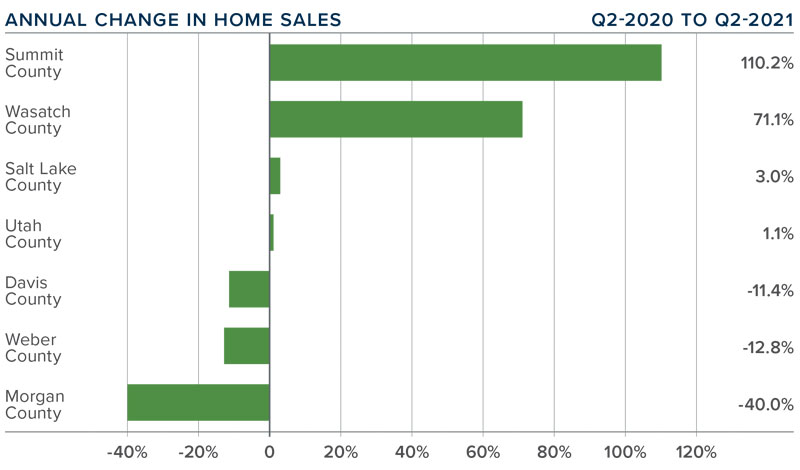
montana Home Sales
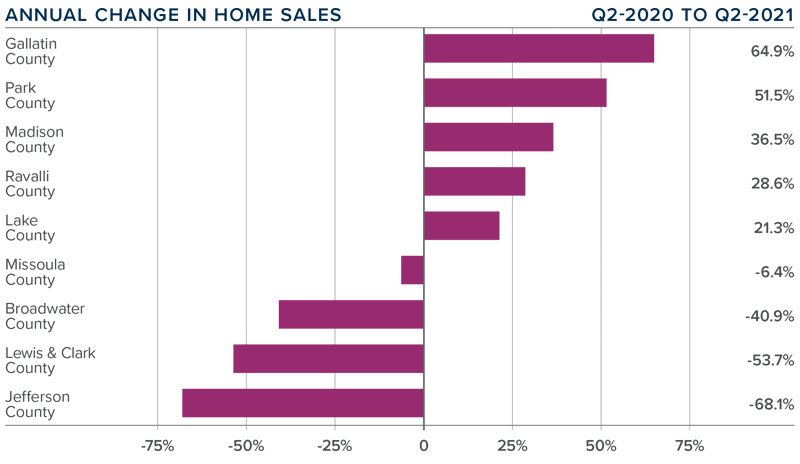
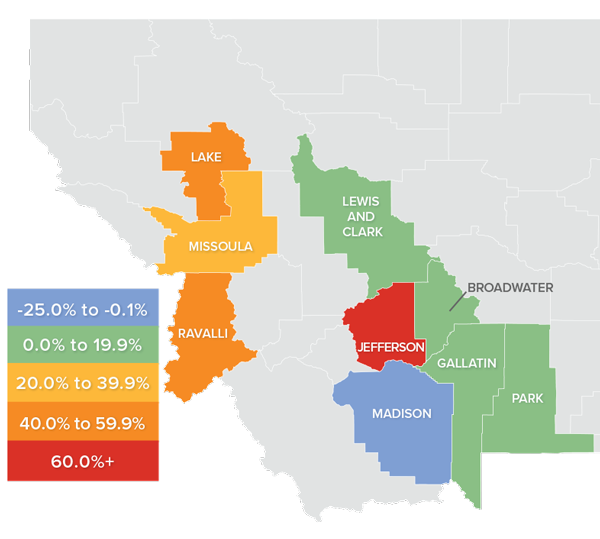
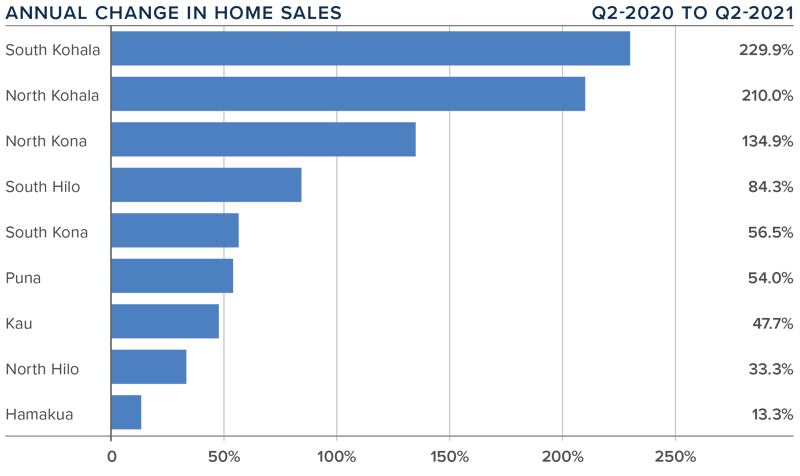
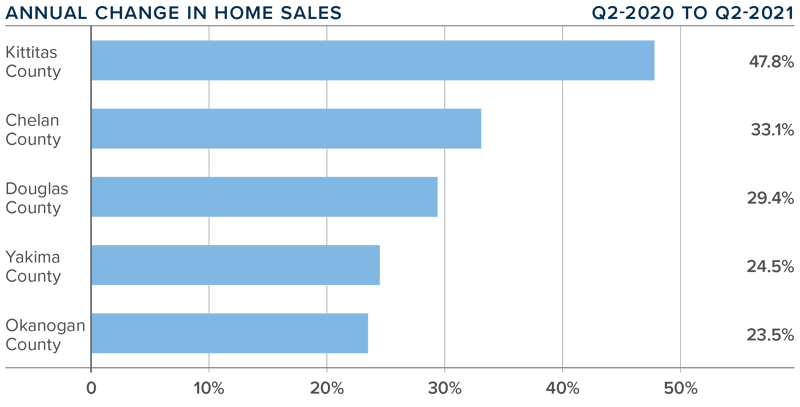
❱ In the second quarter, a total of 1,169 homes sold in the markets contained in this report, representing an increase of 2% compared to the same period in 2020. Sales were up 4.3% compared to the first quarter of this year.
❱ Even with greater choice and an increased number of sales in five counties, sales were lower in four counties. Compared to the first quarter of this year, sales were higher in Missoula, Ravalli, Lake, Gallatin, and Park counties, but lower in the other areas covered in this report.
❱ It was pleasing to see sales pick back up after the drop in transactions in the first quarter. This can be attributed to the 156% increase in the number of homes for sale from the first quarter to the second. Clearly, supply was the limiting factor, not demand.
❱ The growth in sales is a good sign, and with pending sales up 34.3% compared to the first quarter, it is likely that third quarter numbers will be positive.
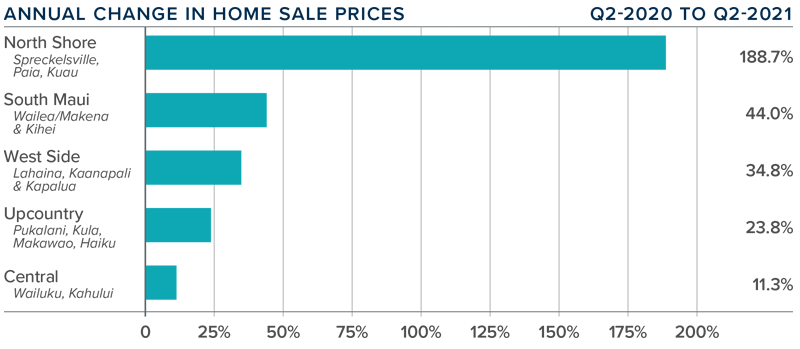
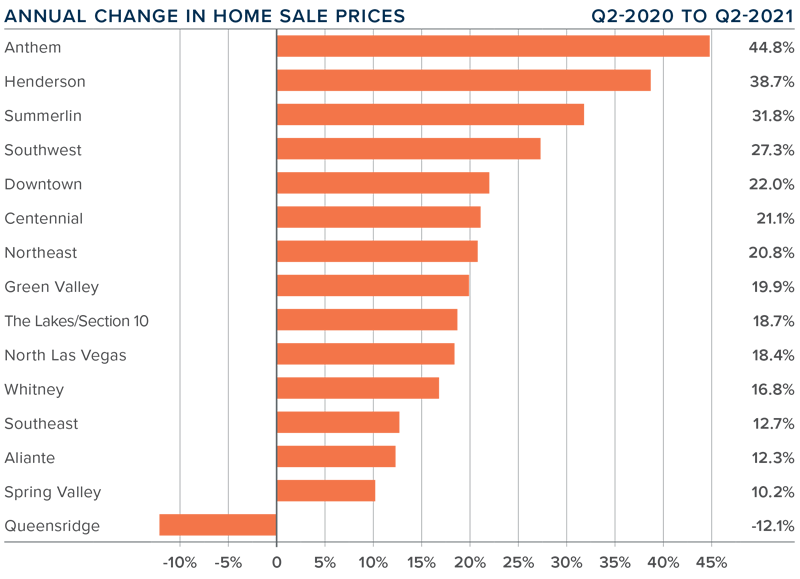
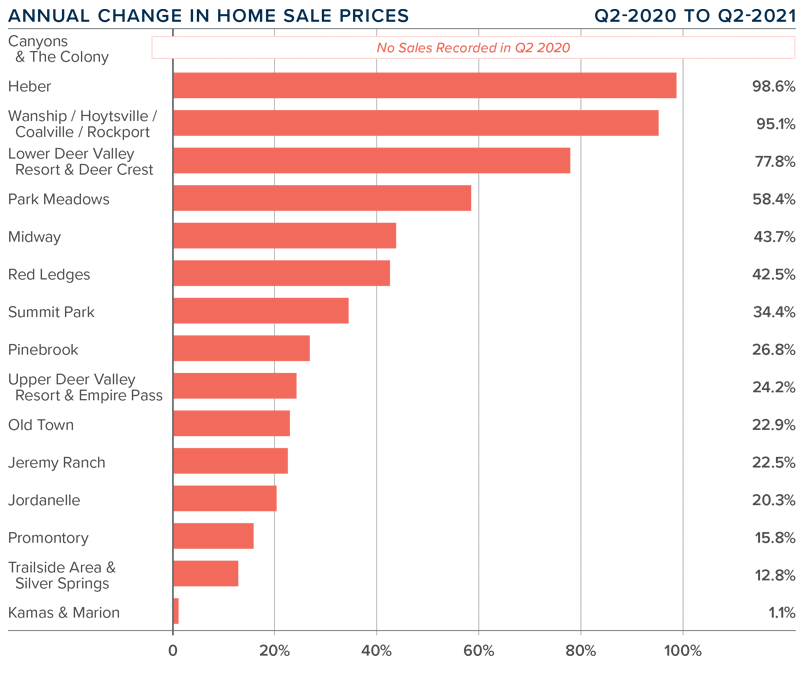
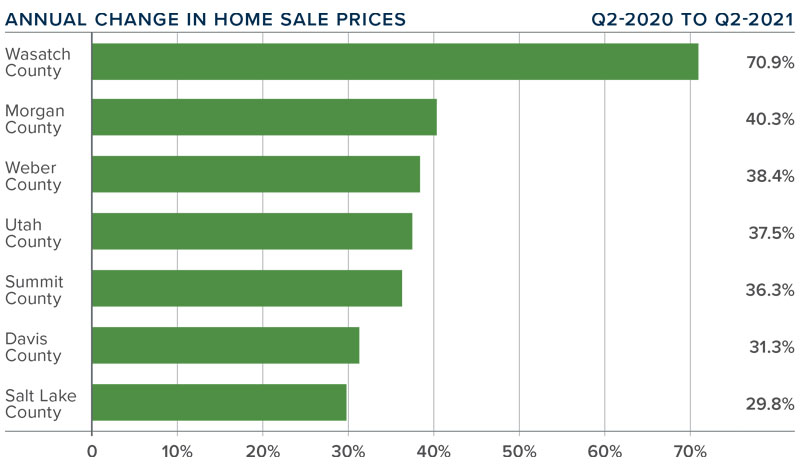
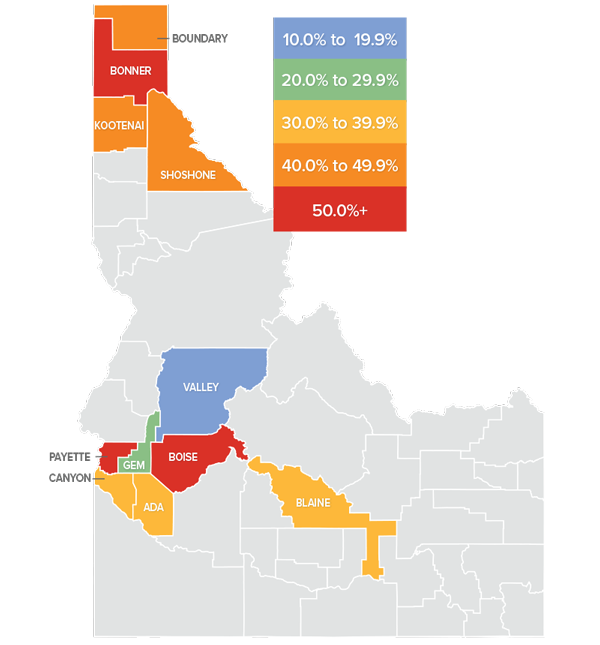
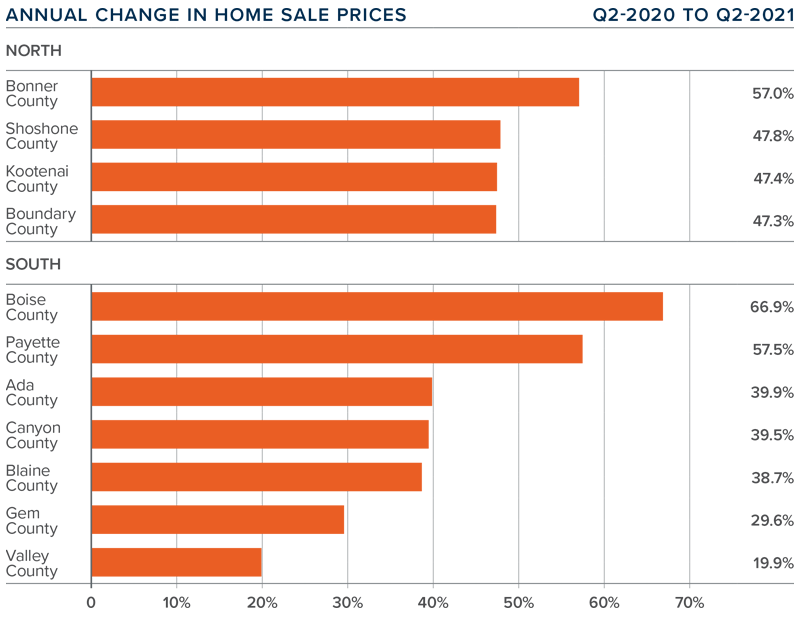
montana Home Prices
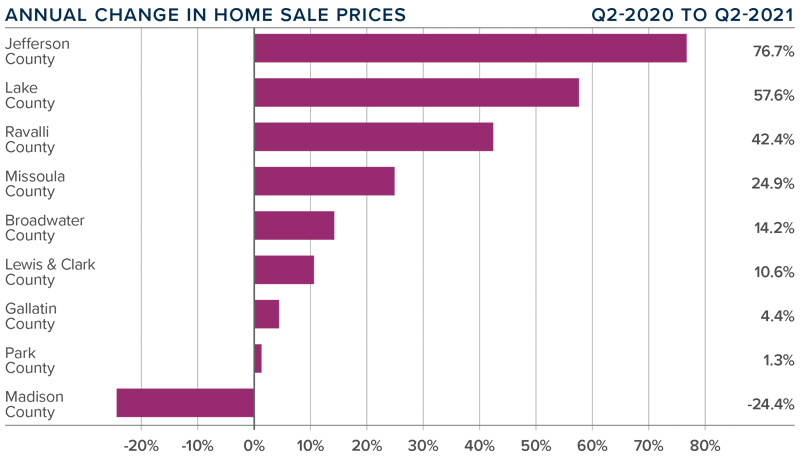
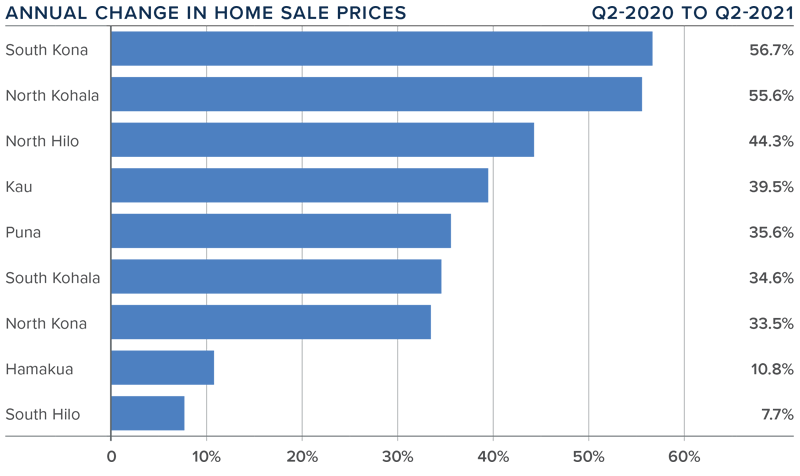
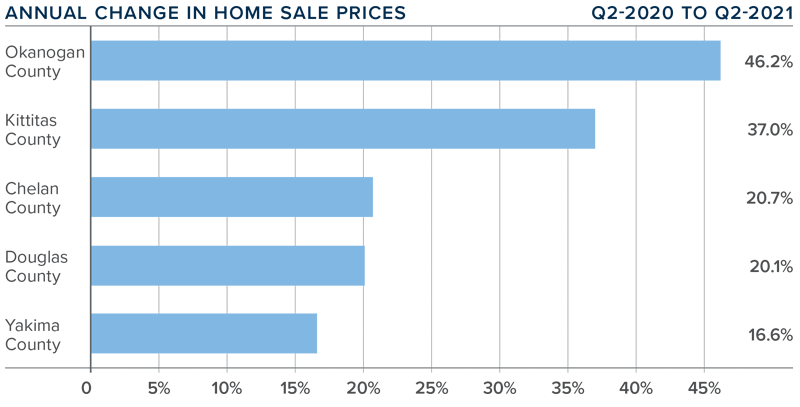
❱ Year-over-year, home prices rose 6.5% to an average of $473,959. However, they were 10.8% lower than in the first quarter of the year.
❱ Sale prices can be frenetic—especially because many of the counties contained in this report have low sales activity—so I am not overly concerned at the present time.
❱ Average sale prices rose in all but one county. The outlier—Madison County, where average sales price dropped from $1.33 million to $924,000—dragged the regional average price lower.
❱ Last quarter I said I wouldn’t be surprised if prices dropped further in the second quarter, and it appears I was right. What I said then was that after a significant period where price growth far exceeded the long-term trend, the market is trying to find balance—and this remains true.
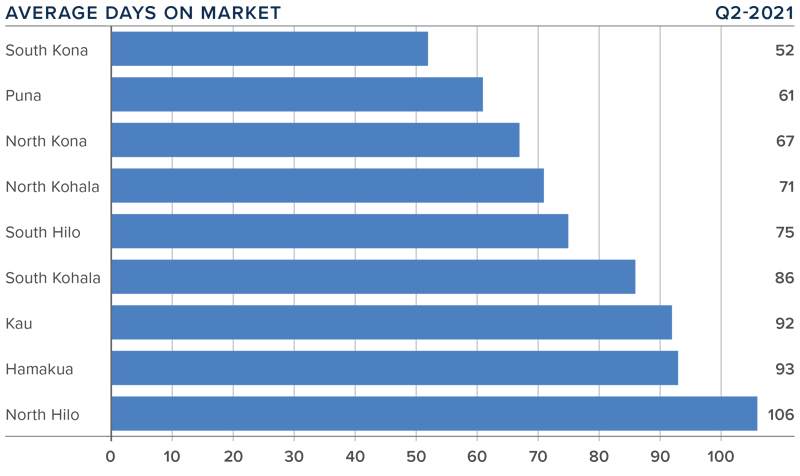
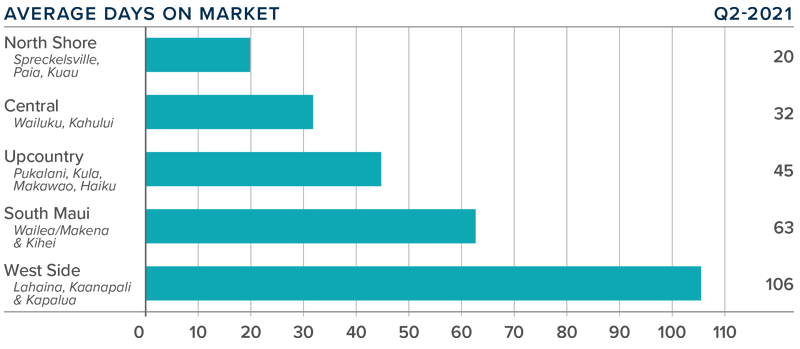
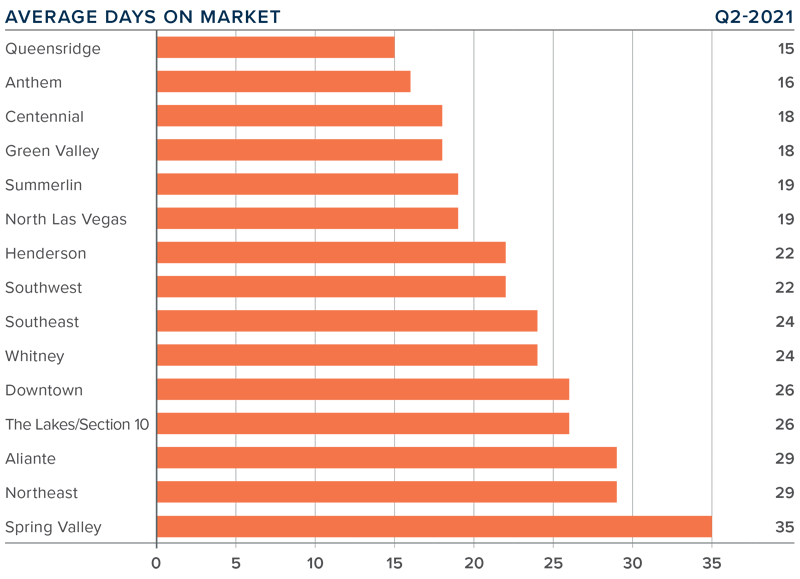
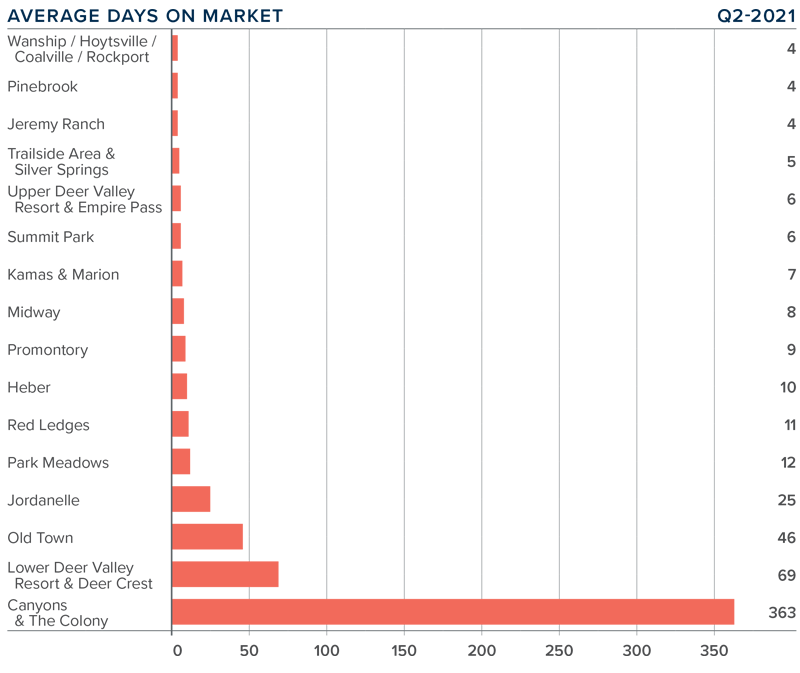
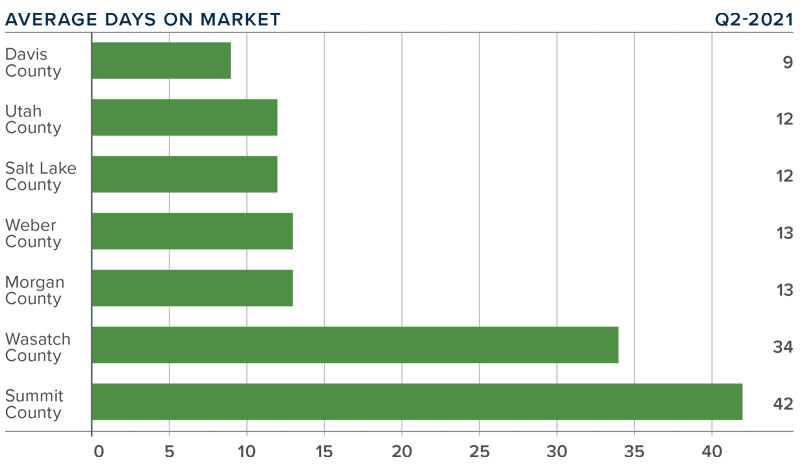
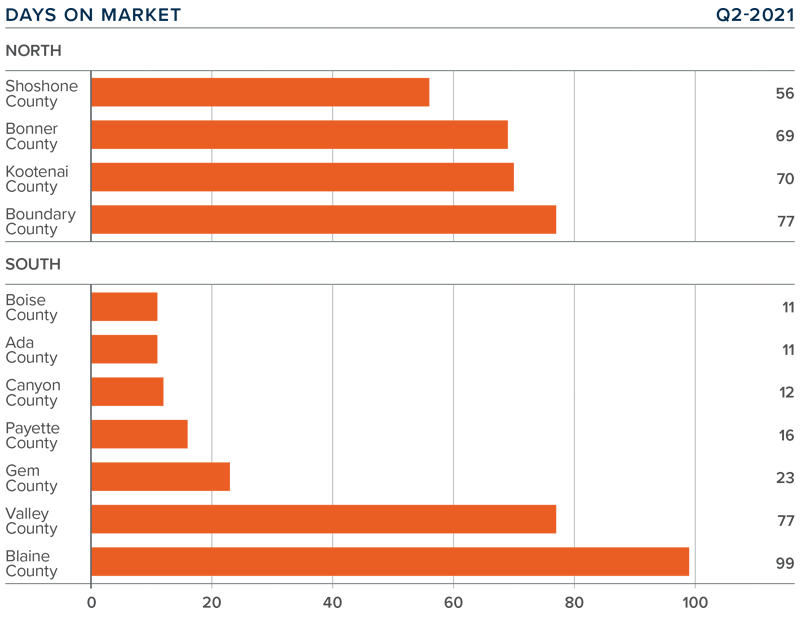
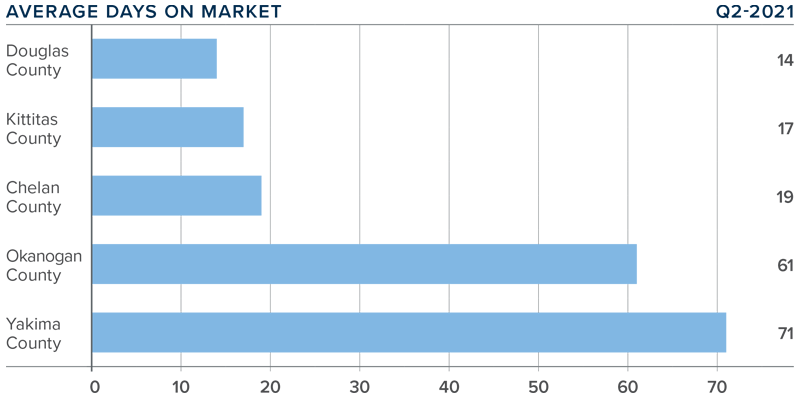
Days on Market
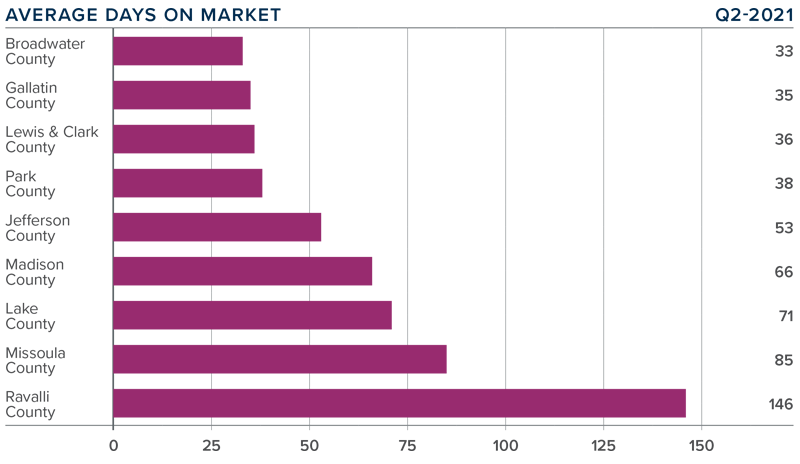
❱ The average number of days it took to sell a home dropped 38 days compared to the second quarter of 2020.
❱ Homes sold fastest in Broadwater County and slowest in Ravalli County. All markets other than Ravalli (+19 days) and Lewis & Clark (+2 days) saw market time drop year over year.
❱ During the quarter, it took an average of 74 days to sell a home in the region.
❱ Relative to the first quarter of this year, market time dropped in Lake, Missoula, Broadwater, and Jefferson counties, but rose in the rest of the areas covered in this report.
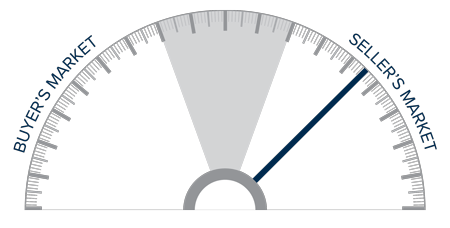
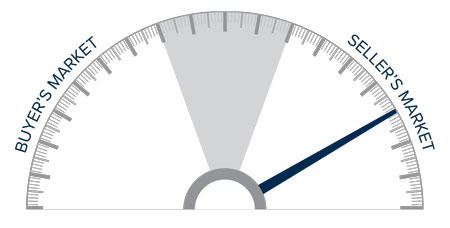
Conclusions
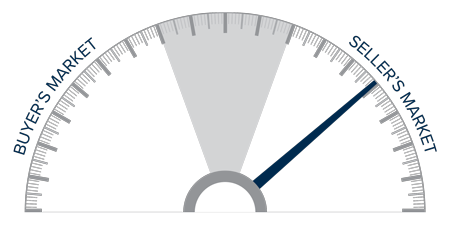
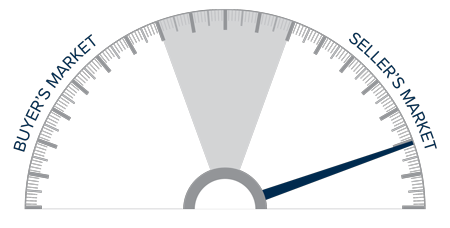
This speedometer reflects the state of the region’s real estate market using housing inventory, price gains, home sales, interest rates, and larger economic factors.
Montana’s economy is performing better than a vast majority of the nation and does not yet appear to be suffering significantly from the rising COVID-19 infections that are hitting many other states.
With mortgage rates set to remain very competitive for the foreseeable future, I believe the housing market will come out of this unique period in the positive despite some of the numbers in this report. Price growth and sales should pick back up, but I think we are seeing the early signs of a more balanced market. That said, we’re not there yet.
Well-positioned and well-priced homes continue to attract buyers, but the slowdown in certain aspects of the market have led me to leave the needle in the same position as in the first quarter.
About Matthew Gardner

As Chief Economist for Windermere Real Estate, Matthew Gardner is responsible for analyzing and interpreting economic data and its impact on the real estate market on both a local and national level. Matthew has over 30 years of professional experience both in the U.S. and U.K.
In addition to his day-to-day responsibilities, Matthew sits on the Washington State Governors Council of Economic Advisors; chairs the Board of Trustees at the Washington Center for Real Estate Research at the University of Washington; and is an Advisory Board Member at the Runstad Center for Real Estate Studies at the University of Washington where he also lectures in real estate economics.


")


