
 Facebook
 X
X
 Pinterest
 Copy Link

The following analysis of select counties of the Central Washington real estate market is provided by Windermere Real Estate Chief Economist Matthew Gardner. We hope that this information may assist you with making better-informed real estate decisions. For further information about the housing market in your area, please don’t hesitate to contact your Windermere Real Estate agent.
Regional Economic Overview
The Central Washington region added 4,449 jobs over the past 12 months, representing a decent 2.4% growth rate. At the county level, Chelan County had solid gains, with a growth rate of 5.5%. Douglas and Okanogan counties saw employment levels rise 3.1%, and Yakima County expanded its employment base by 1.4%. Only Kittitas County lost jobs year over year, with a reduction of 1.4%. The seasonally adjusted unemployment rate in Central Washington was 4.9%, down from 5.4% during the same quarter in 2022. The lowest unemployment rate was in Douglas County, where it was 3.2%. The region’s highest jobless rate was in Yakima County, where 6.3% of the labor force was without work.
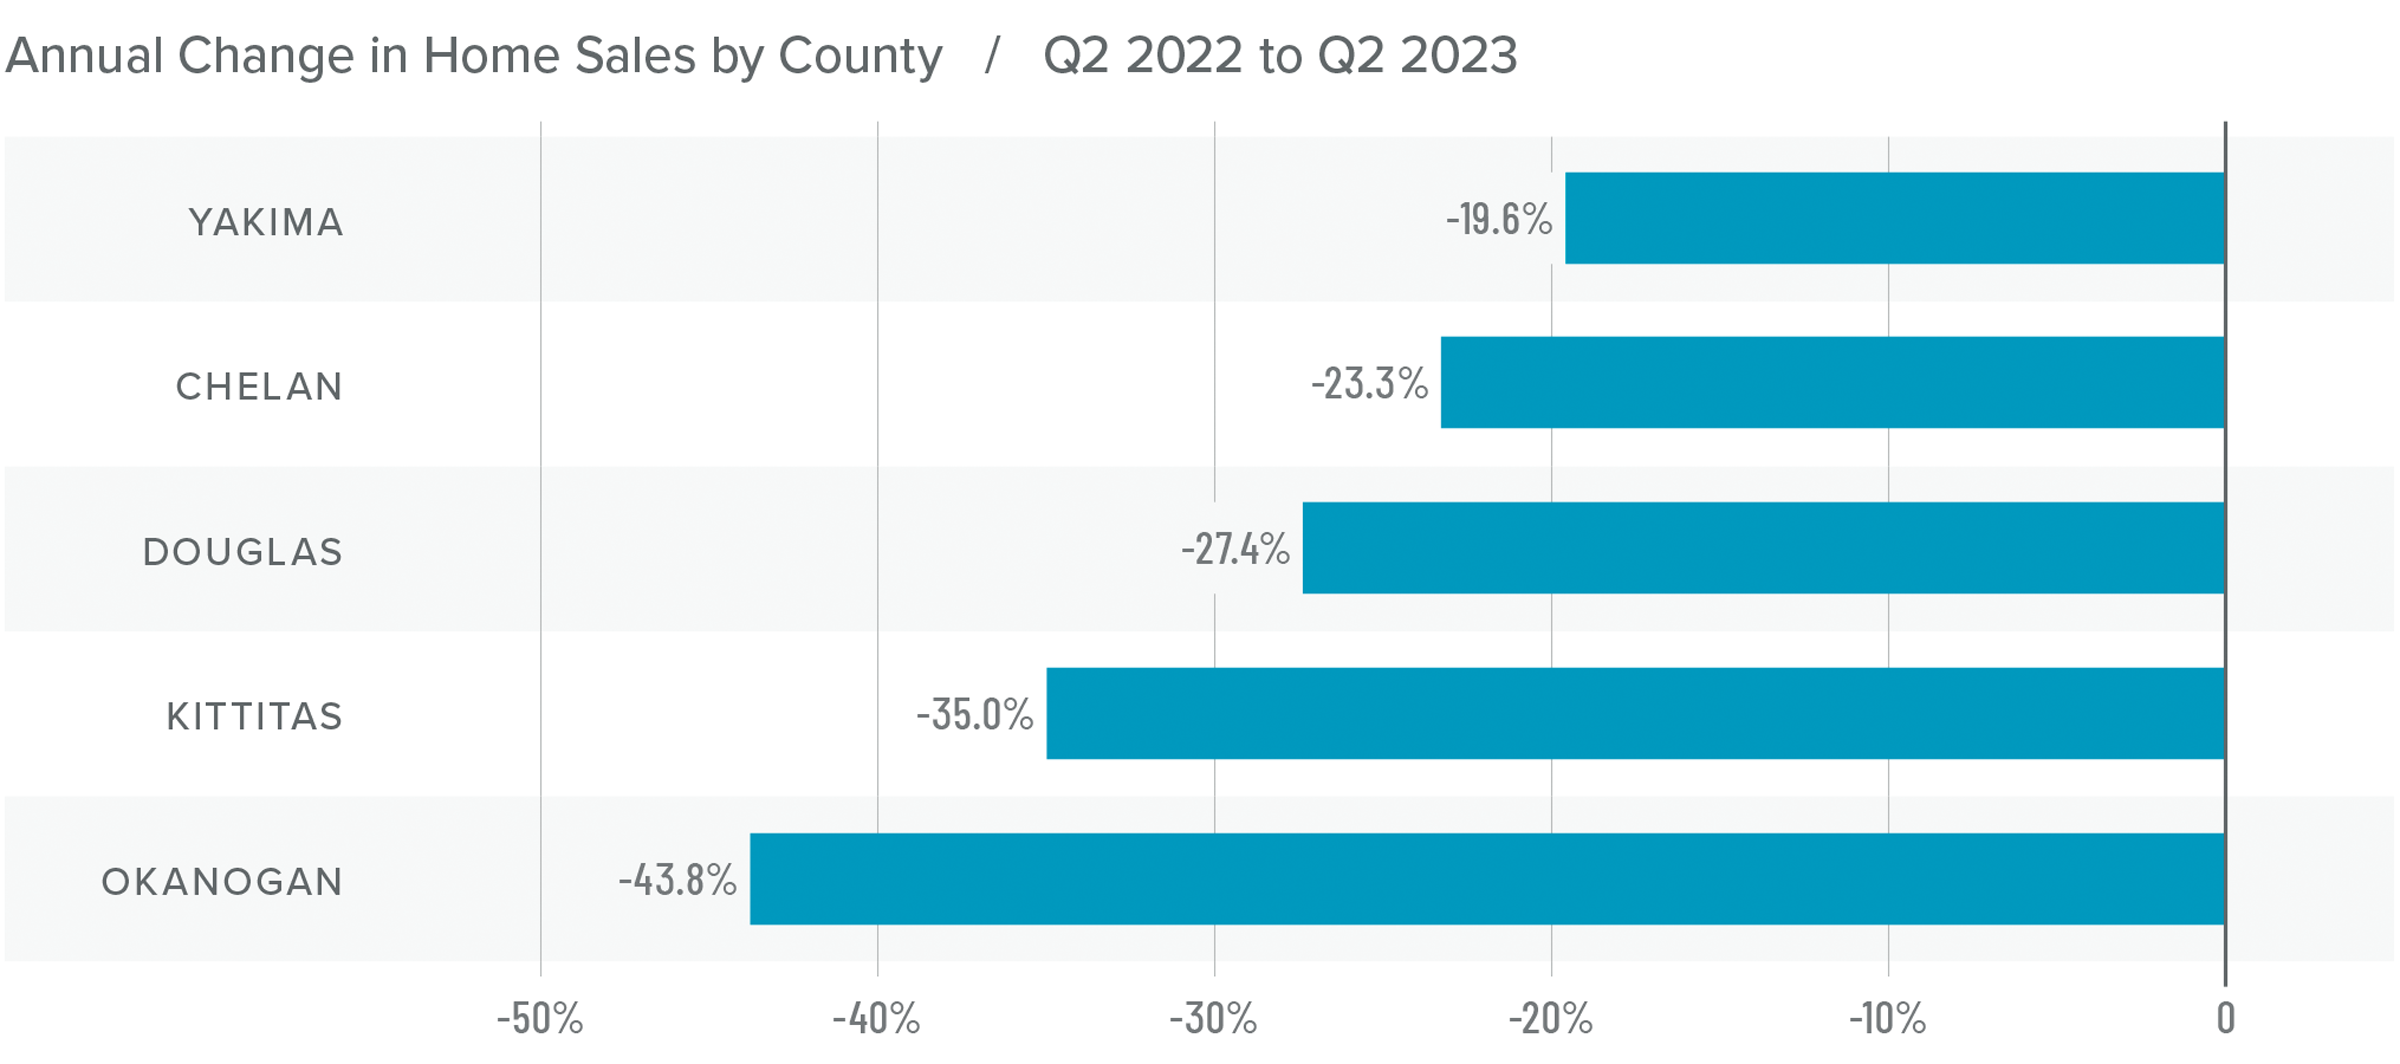
Central Washington Home Sales
❱ There were 1,007 home sales in Central Washington in the second quarter of 2023, representing a decline of 26.6% from the same quarter in 2022. Sales activity rose 63.5% from the first quarter of this year.
❱ Pending sales, which are an indicator of future closings, rose 48% compared to the first quarter of the year, suggesting that market momentum will likely continue through the summer.
❱ Year over year, sales fell significantly across the board. But the number of homes sold was up across the board compared to the first quarter.
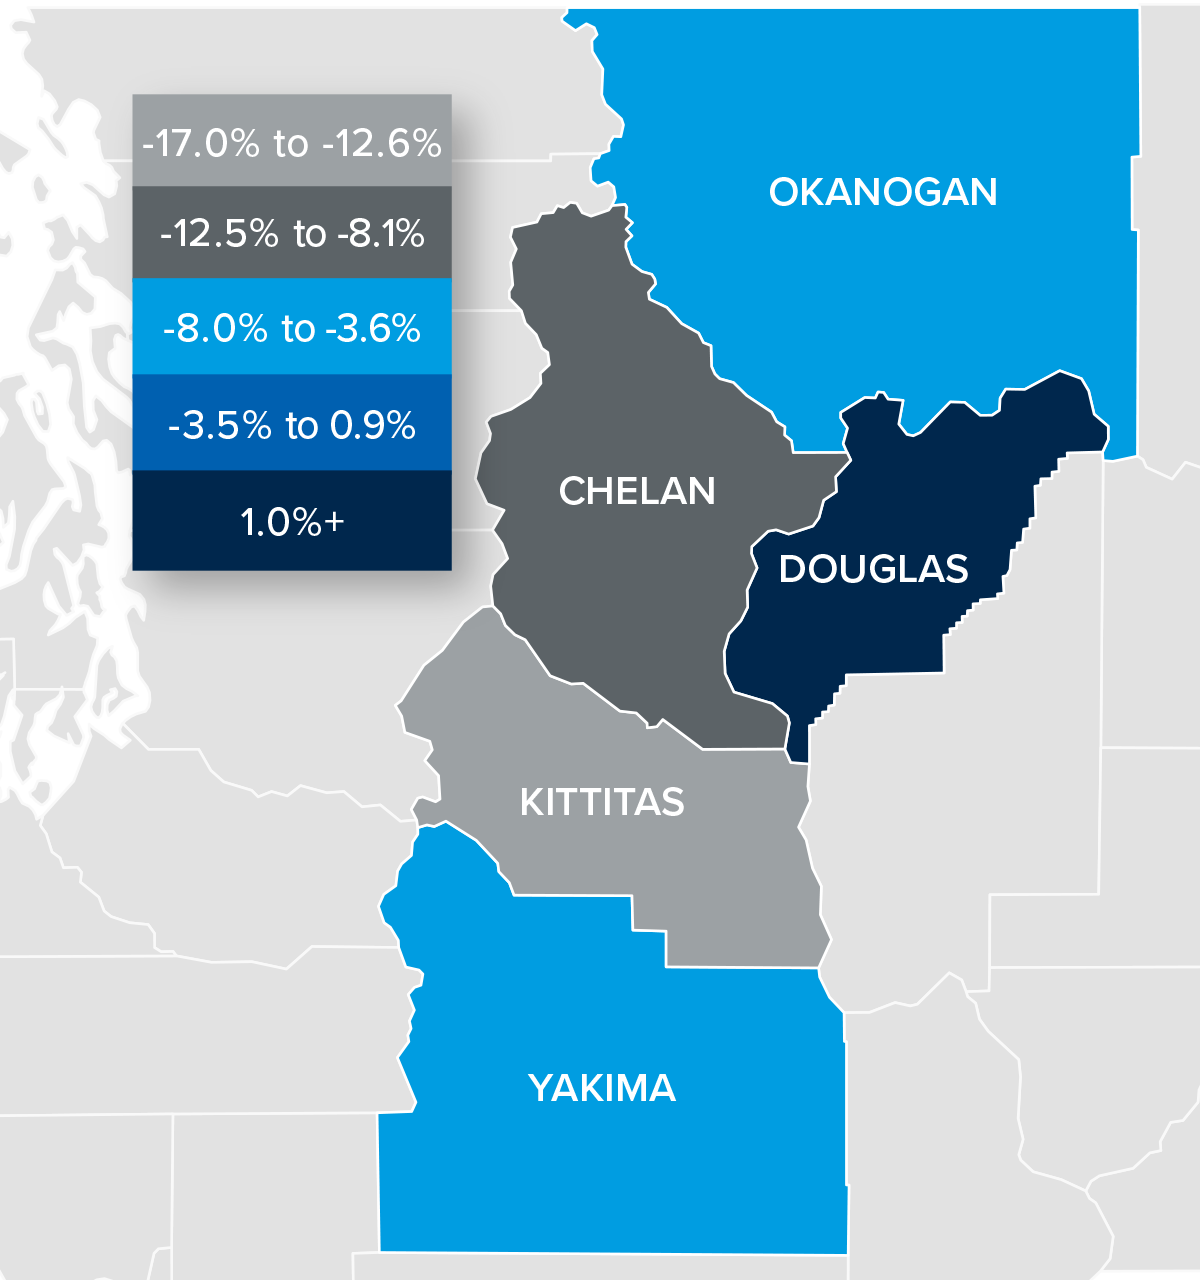
❱ Inventory levels were modestly higher than the second quarter of 2022. However, the number of listings fell from the first quarter. Although this may sound impossible given the increase in sales, sometimes homes sell so quickly they’re not measured in the monthly data, which only looks at the number of homes available on the last day of the month.
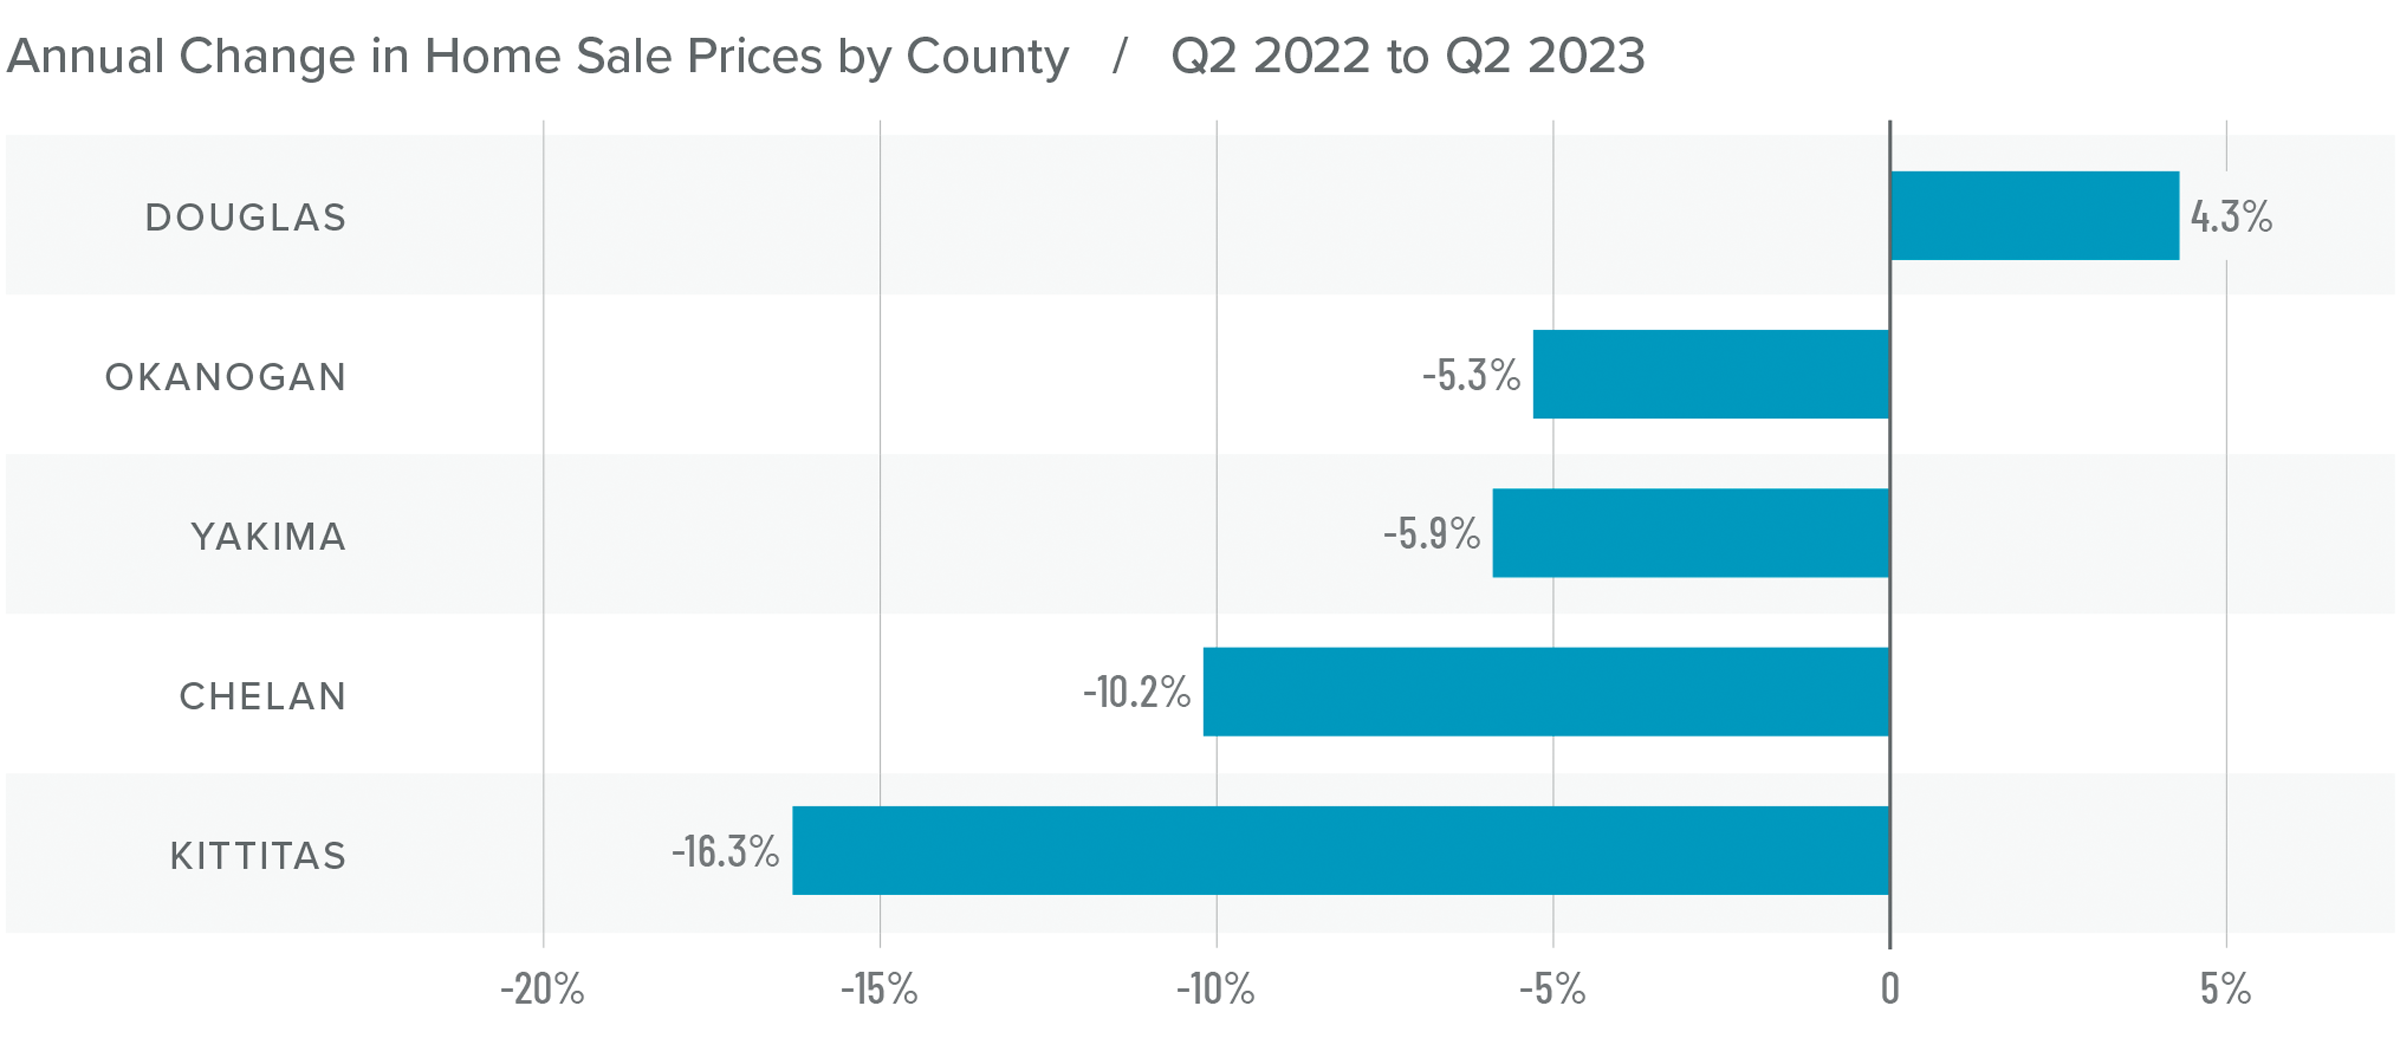
Central Washington Home Prices
❱ The average home price in Central Washington fell 9.7% year over year to $479,411, but sale prices were 4% higher than in the first quarter of this year.
❱ Median list prices rose in all counties except Yakima compared to the first quarter of the year, suggesting that home sellers are quite bullish about the prospects of successfully finding a buyer even as mortgage rates remain high.
❱ All counties except Douglas saw sale prices fall from the second quarter of 2022. Compared to the first quarter of this year, prices rose across all counties other than Kittitas.
❱ The second quarter experienced a positive turnaround from the first, when sales and prices were still falling. In last quarter’s report, I suggested that the market would return to stability this summer, but it appears to be happening faster than I anticipated.
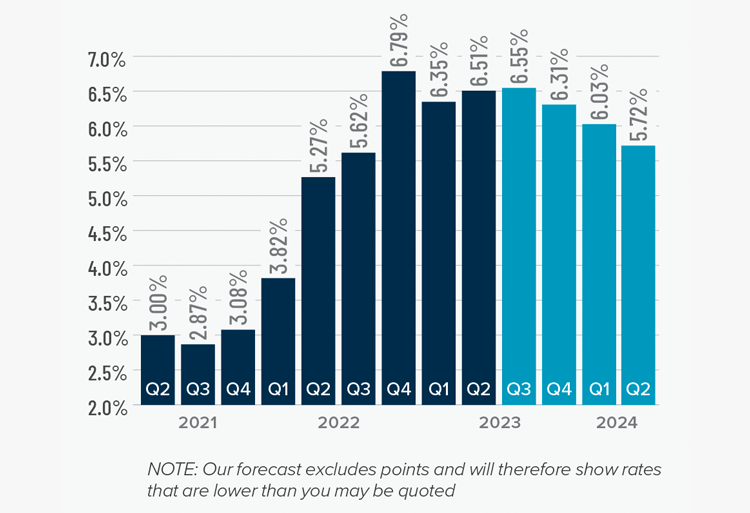
Mortgage Rates
Although they were less erratic than the first quarter, mortgage rates unfortunately trended higher and ended the quarter above 7%. This was due to the short debt ceiling impasse, as well as several economic datasets that suggested the U.S. economy was not slowing at the speed required by the Federal Reserve.
While the June employment report showed fewer jobs created than earlier in the year, as well as downward revisions to prior gains, inflation has not sufficiently slowed. Until it does, rates cannot start to trend consistently lower. With the economy not slowing as fast as expected, I have adjusted my forecast: Rates will hold at current levels in third quarter and then start to trend lower through the fall. Although there are sure to be occasional spikes, my model now shows the 30-year fixed rate breaking below 6% next spring.
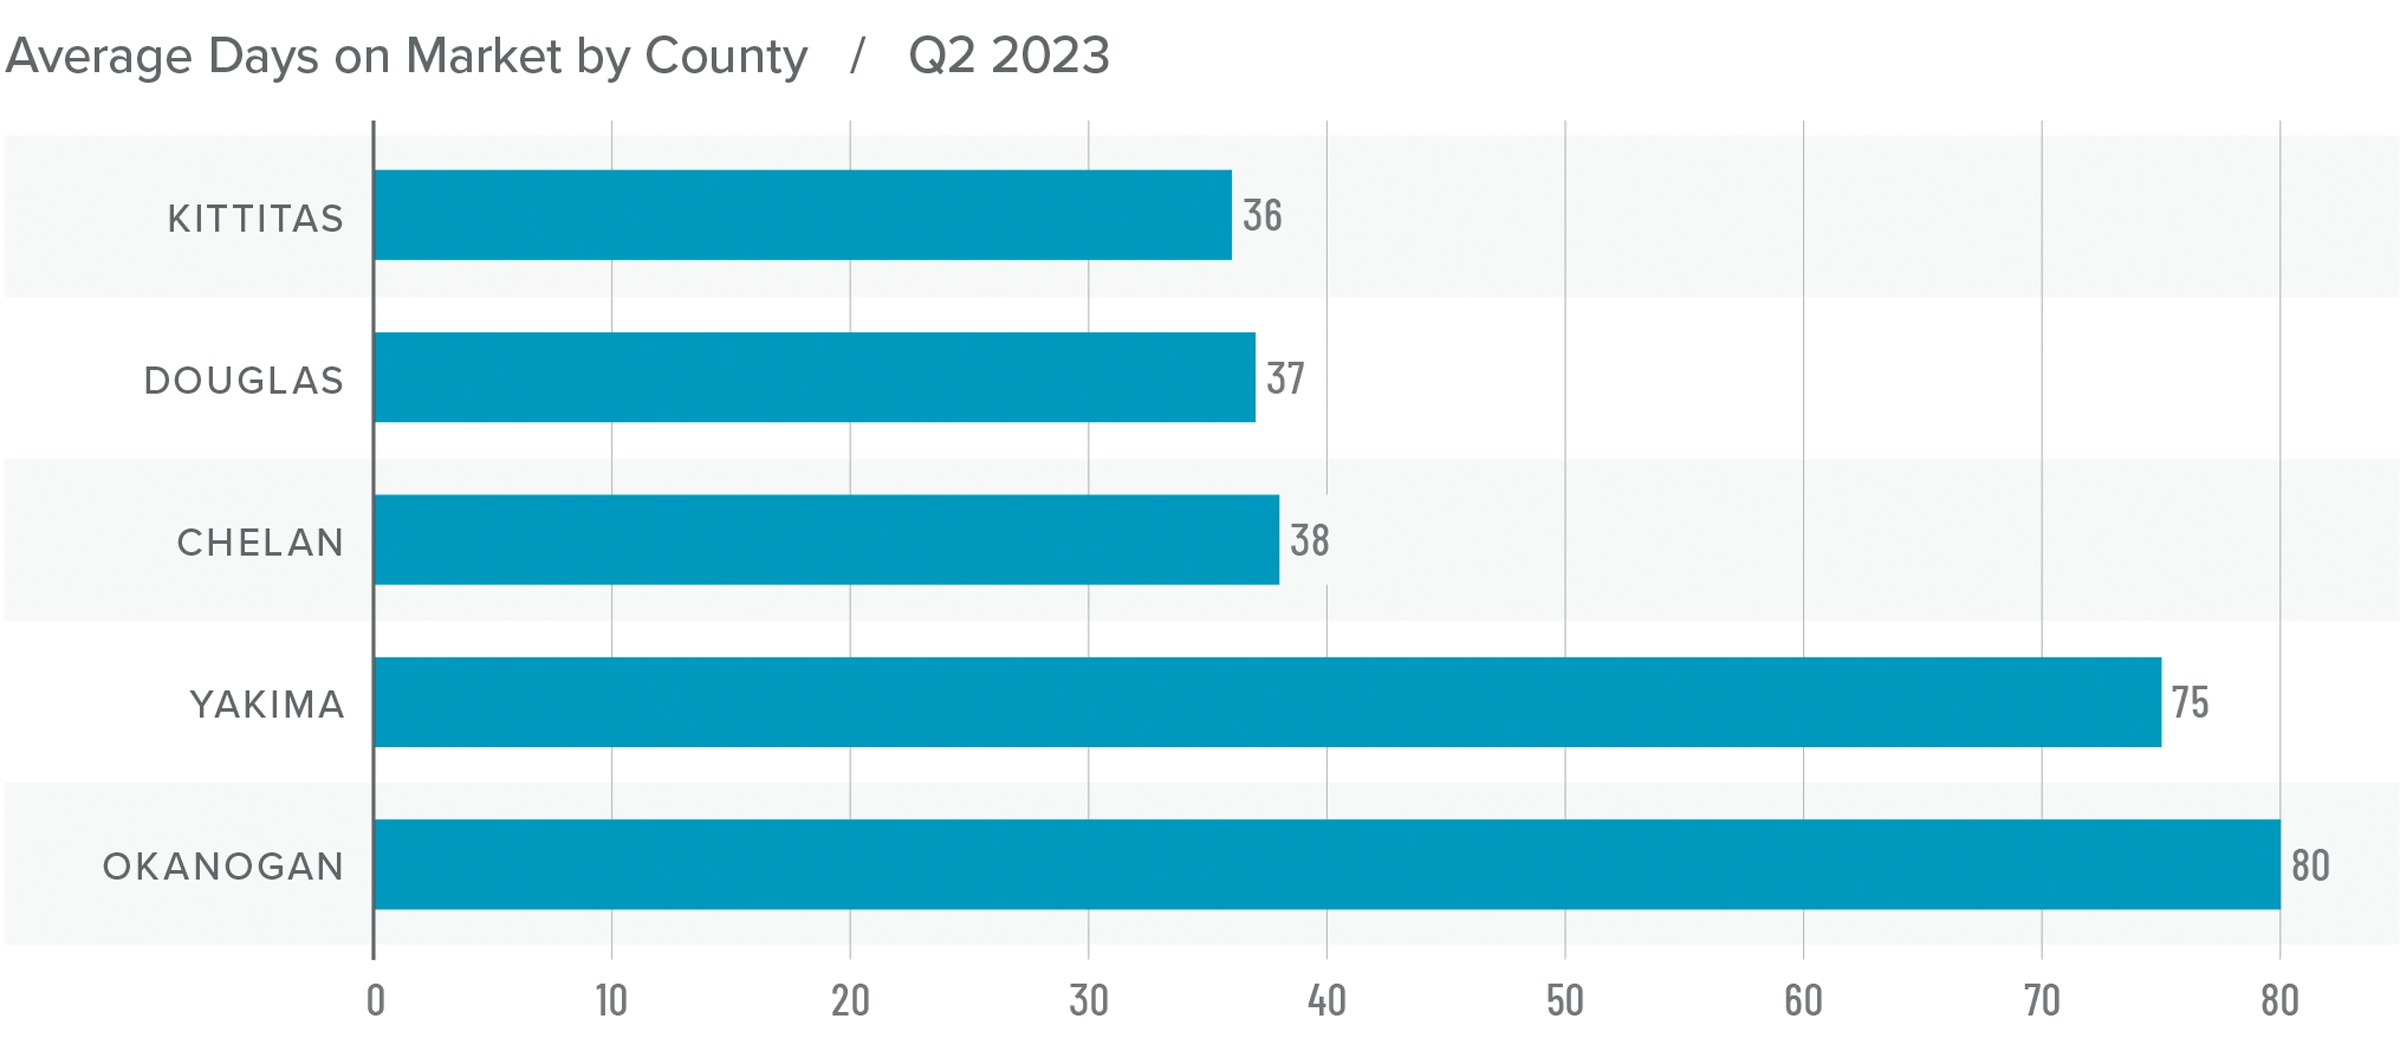
Central Washington Days on Market
❱ The average time it took to sell a home in Central Washington in the second quarter of 2023 was 53 days.
❱ It took 22 more days to sell a home in Central Washington than it did during the second quarter of 2022.
❱ Year over year, average market time rose in all counties, but it fell across the board compared to the first quarter of this year.
❱ On average, it took 18 fewer days to sell a home in the second quarter of 2023 than it did in the first.
Conclusions
This speedometer reflects the state of the region’s real estate market using housing inventory, price gains, home sales, interest rates, and larger economic factors.
Data for the quarter appears to favor home sellers, with tight inventory levels, rising prices and sales, and shorter market time. What is particularly interesting is that the market appears bullish in the face of financing costs that remain well above the levels buyers have become used to.
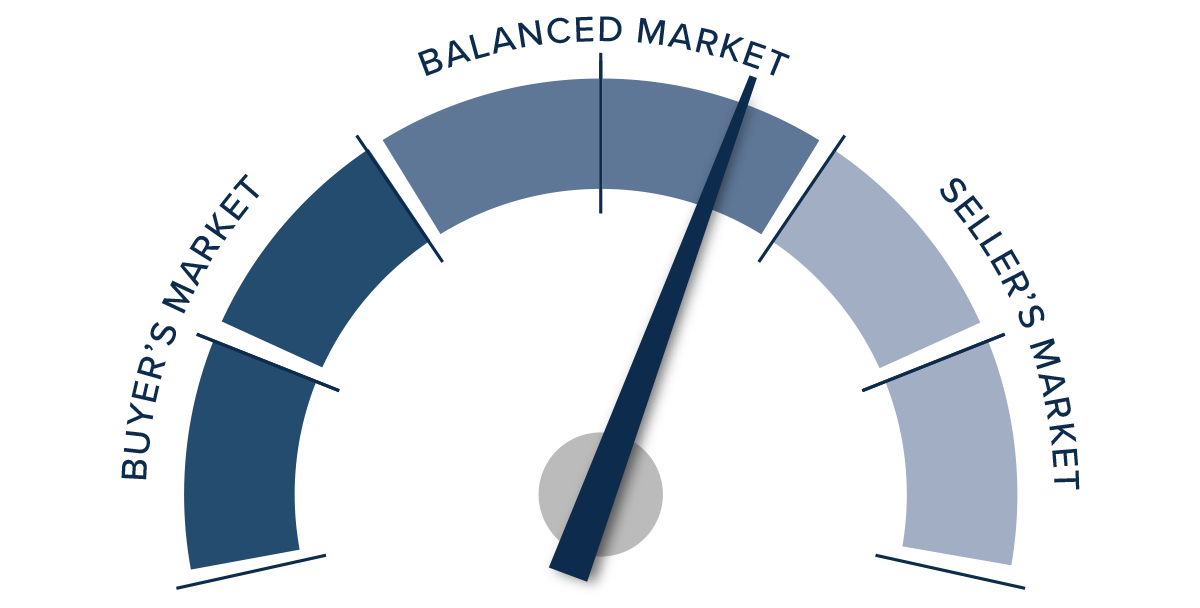
Last quarter, I chose to leave the needle in the balanced quadrant but tilted ever so slightly toward buyers. However, given all the data in this report, I must swing the needle more in favor of sellers. I am not saying it is staunchly a seller’s market given where mortgage rates are today, but they certainly appear to have the upper hand at the moment.
About Matthew Gardner

As Chief Economist for Windermere Real Estate, Matthew Gardner is responsible for analyzing and interpreting economic data and its impact on the real estate market on both a local and national level. Matthew has over 30 years of professional experience both in the U.S. and U.K.
In addition to his day-to-day responsibilities, Matthew sits on the Washington State Governors Council of Economic Advisors; chairs the Board of Trustees at the Washington Center for Real Estate Research at the University of Washington; and is an Advisory Board Member at the Runstad Center for Real Estate Studies at the University of Washington where he also lectures in real estate economics.
")


