
 Facebook
 X
X
 Pinterest
 Copy Link

The following analysis of the Northern California real estate market is provided by Windermere Real Estate Chief Economist Matthew Gardner. We hope that this information may assist you with making better-informed real estate decisions. For further information about the housing market in your area, please don’t hesitate to contact your Windermere Real Estate agent.
Regional Economic Overview
Regionwide, total employment rose 156,300 from a year ago. Northern California has recovered 258,000 of the jobs that were lost due to COVID-19, but there is still a ways to go. The pace of the job recovery has slowed, with a meager 1,600 jobs added in the second quarter. With the number of jobs recovered essentially stalling, the region’s unemployment rate rose from 6% in March to 6.1% in June. I should note that the current level is significantly lower than the 14% rate in April of last year as the pandemic was taking hold of the nation. The lowest jobless rate was in Santa Clara County (5.1%), and the highest rate was in Solano County, where 7.8% of the workforce remains unemployed. Rising COVID-19 infections appear to be having a significant impact on the job recovery in Northern California. Until we see the rate start to drop, a return to full employment will likely take quite some time.
northern california Home Sales
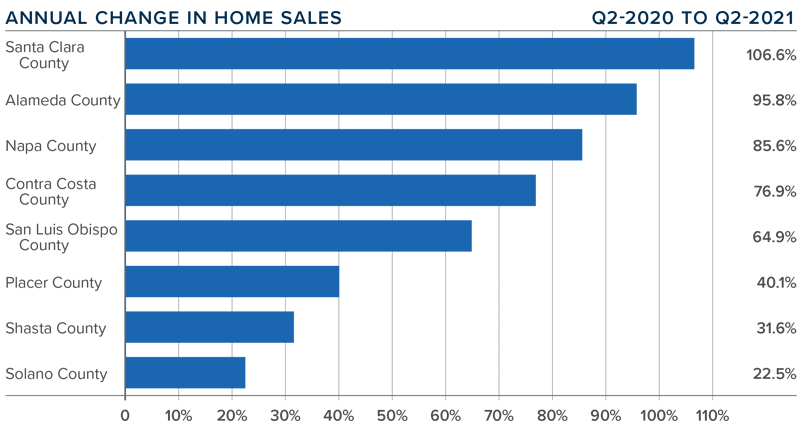
❱ In the second quarter, 16,607 homes sold, an increase of 79.8% compared to the same period a year ago. Although this sounds like a remarkable number, the pandemic slowed sales significantly a year ago. It was pleasing to see sales were also 52.7% higher than in the first quarter of the year.
❱ Year-over-year, home sales rose by double digits in all counties contained in this report. Sales rose the most in Santa Clara County (+67%) from the first quarter, but there were significant gains across the entire region.
❱ The number of homes for sale rose more than 45% from the first quarter of this year, which is sure to have contributed to the solid rise in sales in the quarter.
❱ Pending home sales were up 27.4% from the first quarter, demonstrating that demand remains solid. I expect to see further growth in the number of sales in the third quarter.
northern california Home Prices
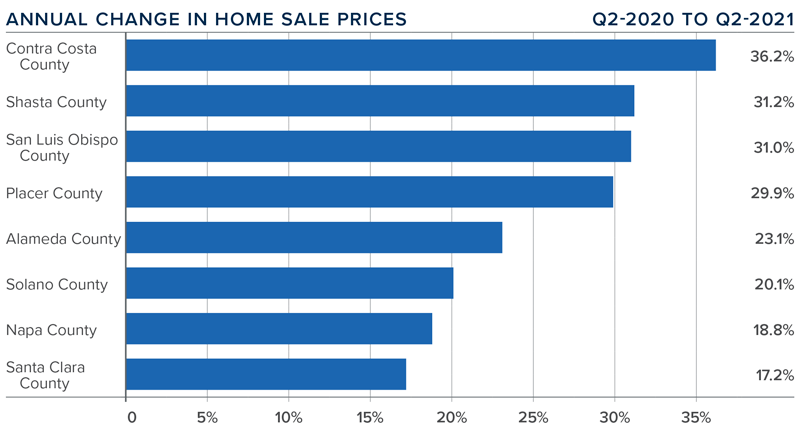
❱ The average home price in the Northern Californian counties contained in this report rose 29.4% year over year to $1.257 million.
❱ The most affordable counties—relative to average sale prices—continue to be Shasta and Solano. The most expensive county was Santa Clara. In addition to Santa Clara, average sale prices were above $1 million in Alameda, Contra Costa, and Napa counties.
❱ Average prices rose in all the counties contained in this report. Even more impressive is that all markets saw prices rise more than 10%.
❱ Although supply levels have improved, price growth continues to rise at very impressive rates. This is likely due to low mortgage rates and increasing demand.
Days on Market
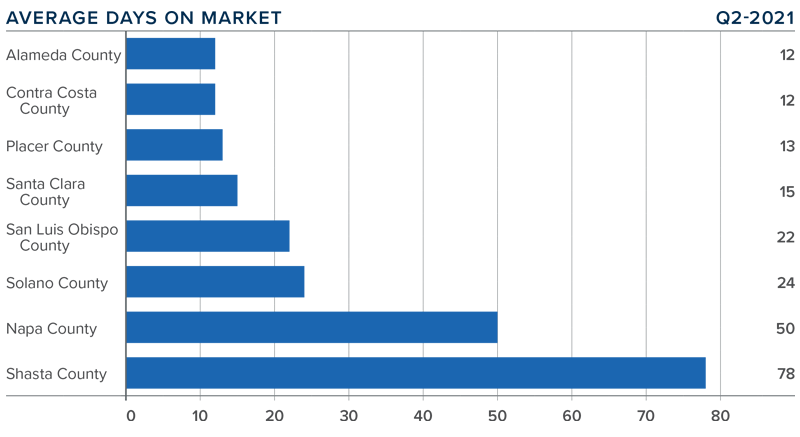
❱ The average time it took to sell a home in the Northern Californian counties covered by this report dropped 15 days compared to the second quarter of 2020.
❱ The amount of time it took to sell a home dropped in every county compared to a year ago. Market time was also lower across the board compared to the first quarter of this year.
❱ In the second quarter, it took an average of 28 days to sell a home, with homes selling fastest in Alameda County and slowest in Shasta County.
❱ The greatest drop in market time was in San Luis Obispo County, where it took 29 fewer days to sell a home than in the second quarter of 2020.
Conclusions

This speedometer reflects the state of the region’s real estate market using housing inventory, price gains, home sales, interest rates, and larger economic factors.
There is a dichotomy in the region as the housing market continues to flourish despite the stalled economic recovery. Although supply levels are increasing, home prices and market time suggest that demand remains remarkably robust.
As such, I believe that the market still favors home sellers, and I have moved the needle a little more in their favor.
About Matthew Gardner

As Chief Economist for Windermere Real Estate, Matthew Gardner is responsible for analyzing and interpreting economic data and its impact on the real estate market on both a local and national level. Matthew has over 30 years of professional experience both in the U.S. and U.K.
In addition to his day-to-day responsibilities, Matthew sits on the Washington State Governors Council of Economic Advisors; chairs the Board of Trustees at the Washington Center for Real Estate Research at the University of Washington; and is an Advisory Board Member at the Runstad Center for Real Estate Studies at the University of Washington where he also lectures in real estate economics.
")


