
 Facebook
 X
X
 Pinterest
 Copy Link

The following analysis of the greater Las Vegas real estate market is provided by Windermere Real Estate Chief Economist Matthew Gardner. We hope that this information may assist you with making better-informed real estate decisions. For further information about the housing market in your area, please don’t hesitate to contact your Windermere Real Estate agent.
Regional Economic Overview
The job market in Las Vegas continues to recover from the significant impacts of COVID-19, with the pace of jobs returning picking up a little steam in recent months. In the second quarter 30,100 jobs returned, which is up from 12,800 in the first quarter. That said, total employment in the area is still down by more than 105,000 jobs from its pre-pandemic peak. Even as jobs return, the unemployment level remains elevated at 8.9%. However, this is still significantly lower than the pandemic-induced peak of 33.3%. Although the region continues its job recovery, I am concerned that the rise in new COVID-19 cases, which started to trend higher in June, may slow the pace of recovery.
nevada Home Sales
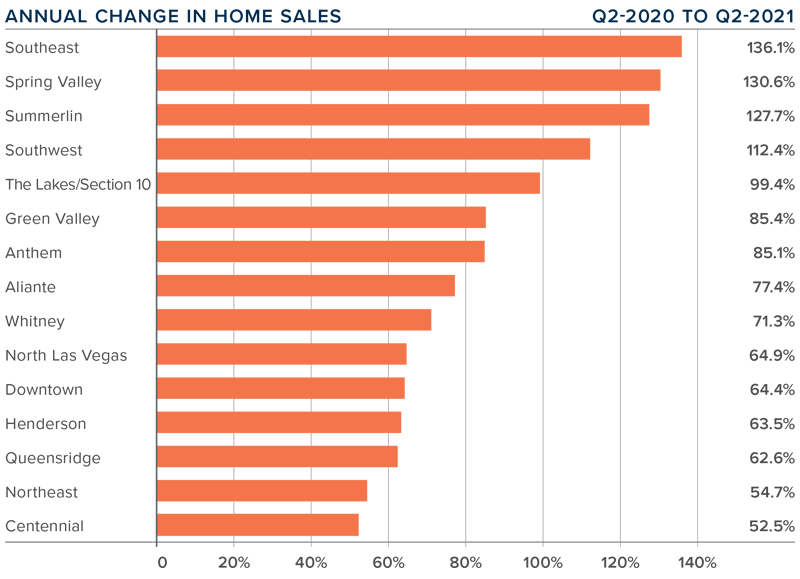
❱ A total of 11,243 homes sold in the second quarter, a massive increase of more than 84% compared to the same period a year ago, and 15.8% higher than in the first quarter of this year.
❱ Pending sales—an indicator of future closings— rose 3.3% compared to the first quarter of the year. I would have liked to see a higher number, but I put the relatively low level down to supply-side constraints.
❱ Compared to second quarter of last year, sales rose over 50% in every market and more than doubled in four. Although these statistics sound amazing, we should not forget that the pandemic was in full swing a year ago, which had a significant impact on home sales.
❱ Lower pending sales can be attributed to the fact that the average number of homes on the market in the quarter was down 3.4% relative to the first quarter of the year, and down more than 60% from the same period a year ago. The market remains supply starved.
nevada Home Prices
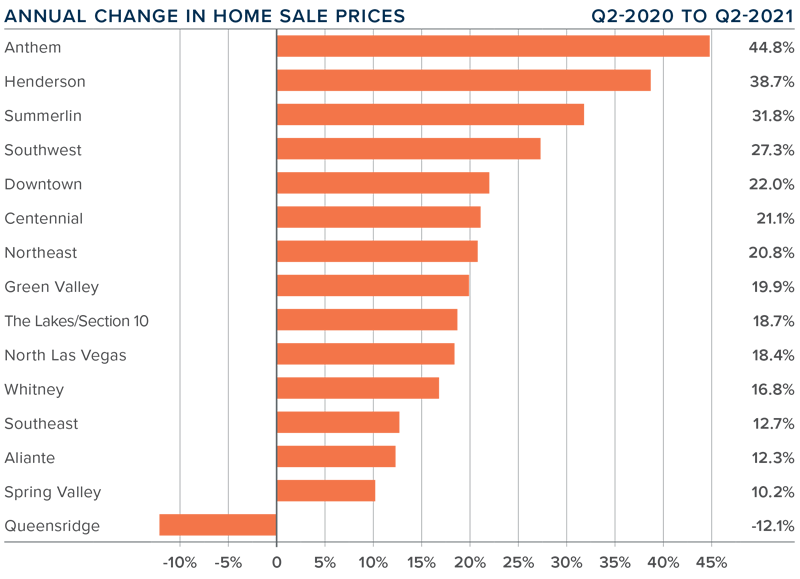
❱ With sales up and listings down, it should come as no surprise that home prices continued their upward trend. Year over year, average prices were up 27.1% to $429,049. Sale prices were also 8.3% higher than in the first quarter of this year.
❱ Mortgage rates rose in the first quarter but have again pulled back, which has increased interest from buyers and is pushing prices higher.
❱ Prices rose in every sub-market other than Queensridge compared to the same quarter last year, with double-digit gains in all neighborhoods. When compared to the first quarter of 2021, prices were also higher in every area other than Queensridge, with double-digit appreciation in Anthem, The Lakes/Section 10, Southwest, and Northeast Las Vegas.
❱ The takeaway is that demand still exceeds supply, and this is causing prices to continue to rise at a significant pace. That said, the rate of appreciation is unsustainable, and will start to slow; the question is when.
Days on Market
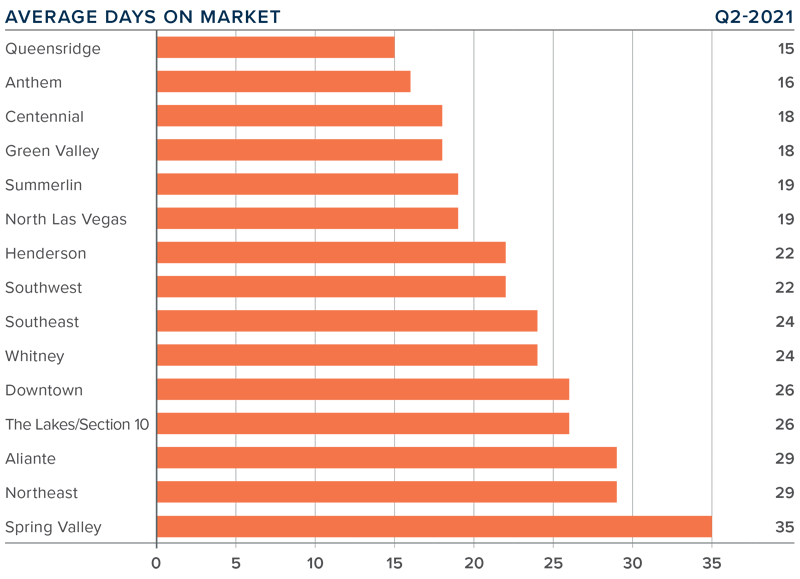
❱ The average time it took to sell a home in the region dropped 15 days compared to the second quarter of 2020.
❱ It took an average of 23 days to sell a home in the second quarter, which was 16 fewer days than in the first quarter of 2021.
❱ Days-on-market dropped across the board compared to a year ago, and all areas saw market time fall compared to the first quarter of this year.
❱ The greatest decline in market time was in the Aliante market, where the length of time it took to sell a home dropped 29 days compared to a year ago.
Conclusions
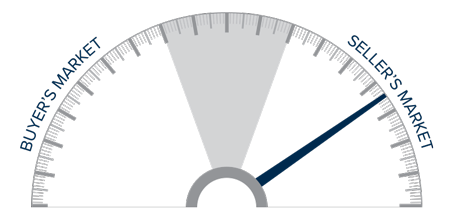
This speedometer reflects the state of the region’s real estate market using housing inventory, price gains, home sales, interest rates, and larger economic factors.
Even though jobs are returning, rising COVID-19 cases may slow the area’s economic recovery. I suspect that some home sellers will choose to wait to list their homes until infection rates start to drop. If this is the case, the supply-demand imbalance we see today will only be exacerbated. While this is bad news for home buyers, it will bode well for sellers. As such, I am moving the needle a little more in their favor.
About Matthew Gardner

As Chief Economist for Windermere Real Estate, Matthew Gardner is responsible for analyzing and interpreting economic data and its impact on the real estate market on both a local and national level. Matthew has over 30 years of professional experience both in the U.S. and U.K.
In addition to his day-to-day responsibilities, Matthew sits on the Washington State Governors Council of Economic Advisors; chairs the Board of Trustees at the Washington Center for Real Estate Research at the University of Washington; and is an Advisory Board Member at the Runstad Center for Real Estate Studies at the University of Washington where he also lectures in real estate economics.
")


