
 Facebook
 X
X
 Pinterest
 Copy Link

The following analysis of select counties of the Northern California real estate market is provided by Windermere Real Estate Chief Economist Matthew Gardner. We hope that this information may assist you with making better-informed real estate decisions. For further information about the housing market in your area, please don’t hesitate to contact your Windermere Real Estate agent.
Regional Economic Overview
Total employment in the counties covered by this report was flat year over year. Job gains in Placer, San Luis Obispo, and Santa Clara counties were offset by job losses in the rest of the region. That said, the regional unemployment rate was a reasonable 3.5%. The lowest jobless rate was in San Luis Obispo County (3%), and the highest rate was in Shasta County (4.9%).
Northern California Home Sales
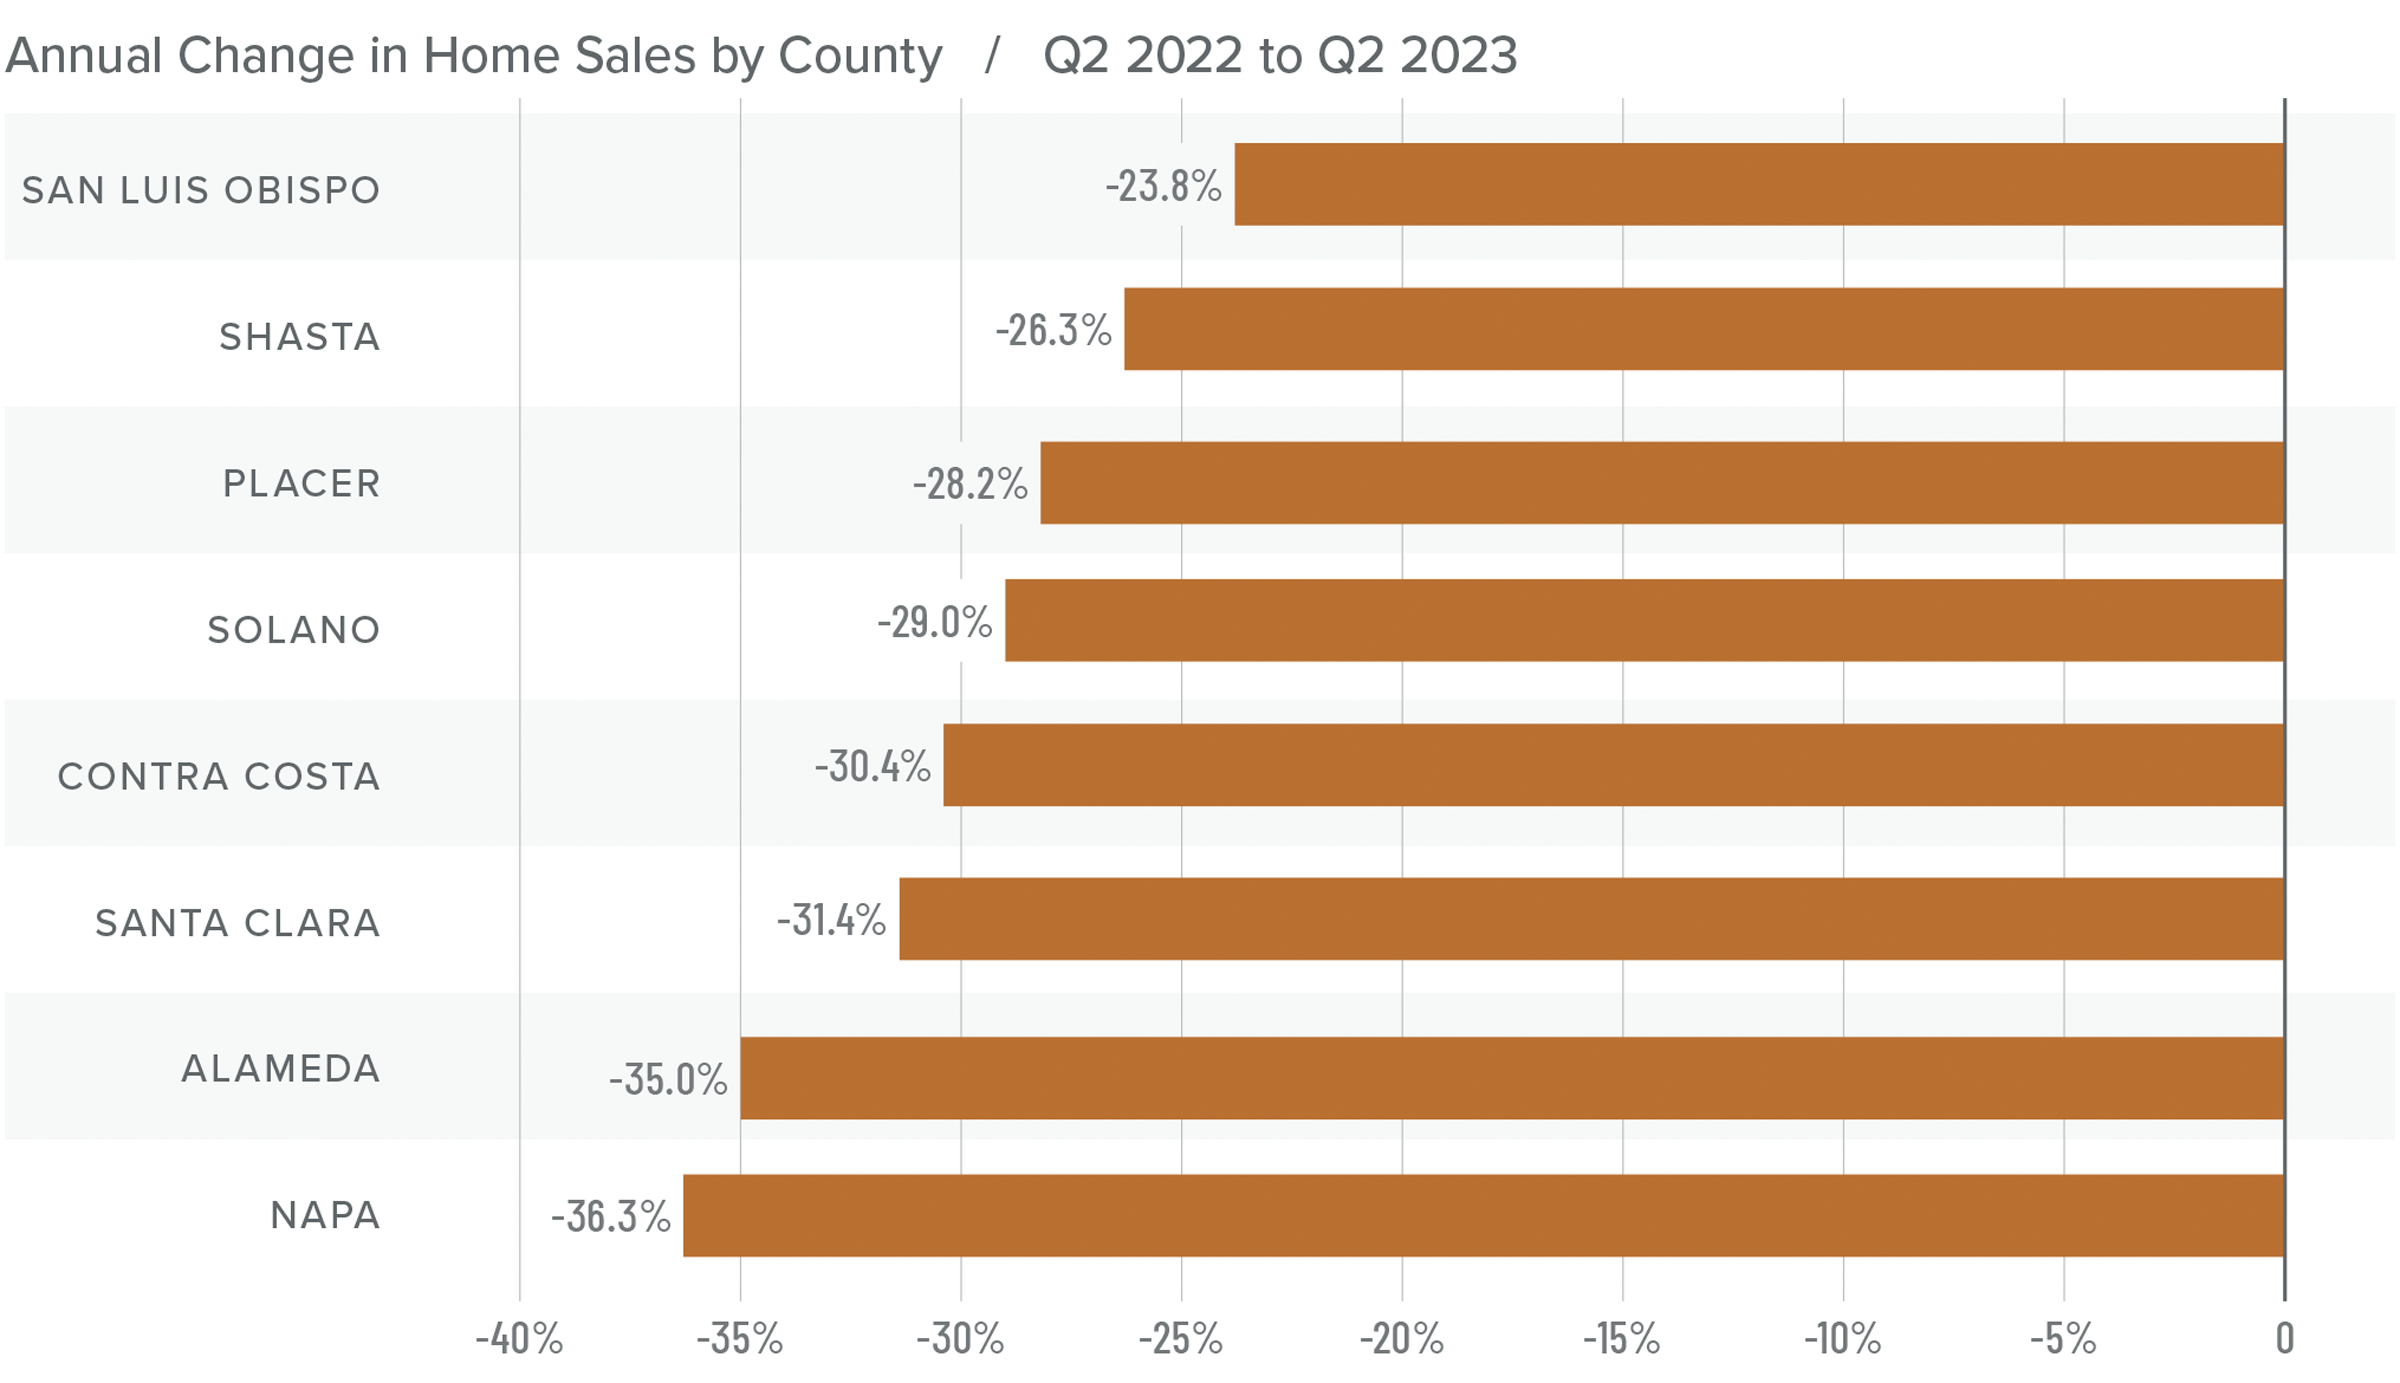
❱ In the second quarter of 2023, 9,999 homes sold, which was a significant decrease from the more than 14,500 homes that sold in the second quarter of 2022. However, sales were up almost 50% compared to the first quarter of this year.
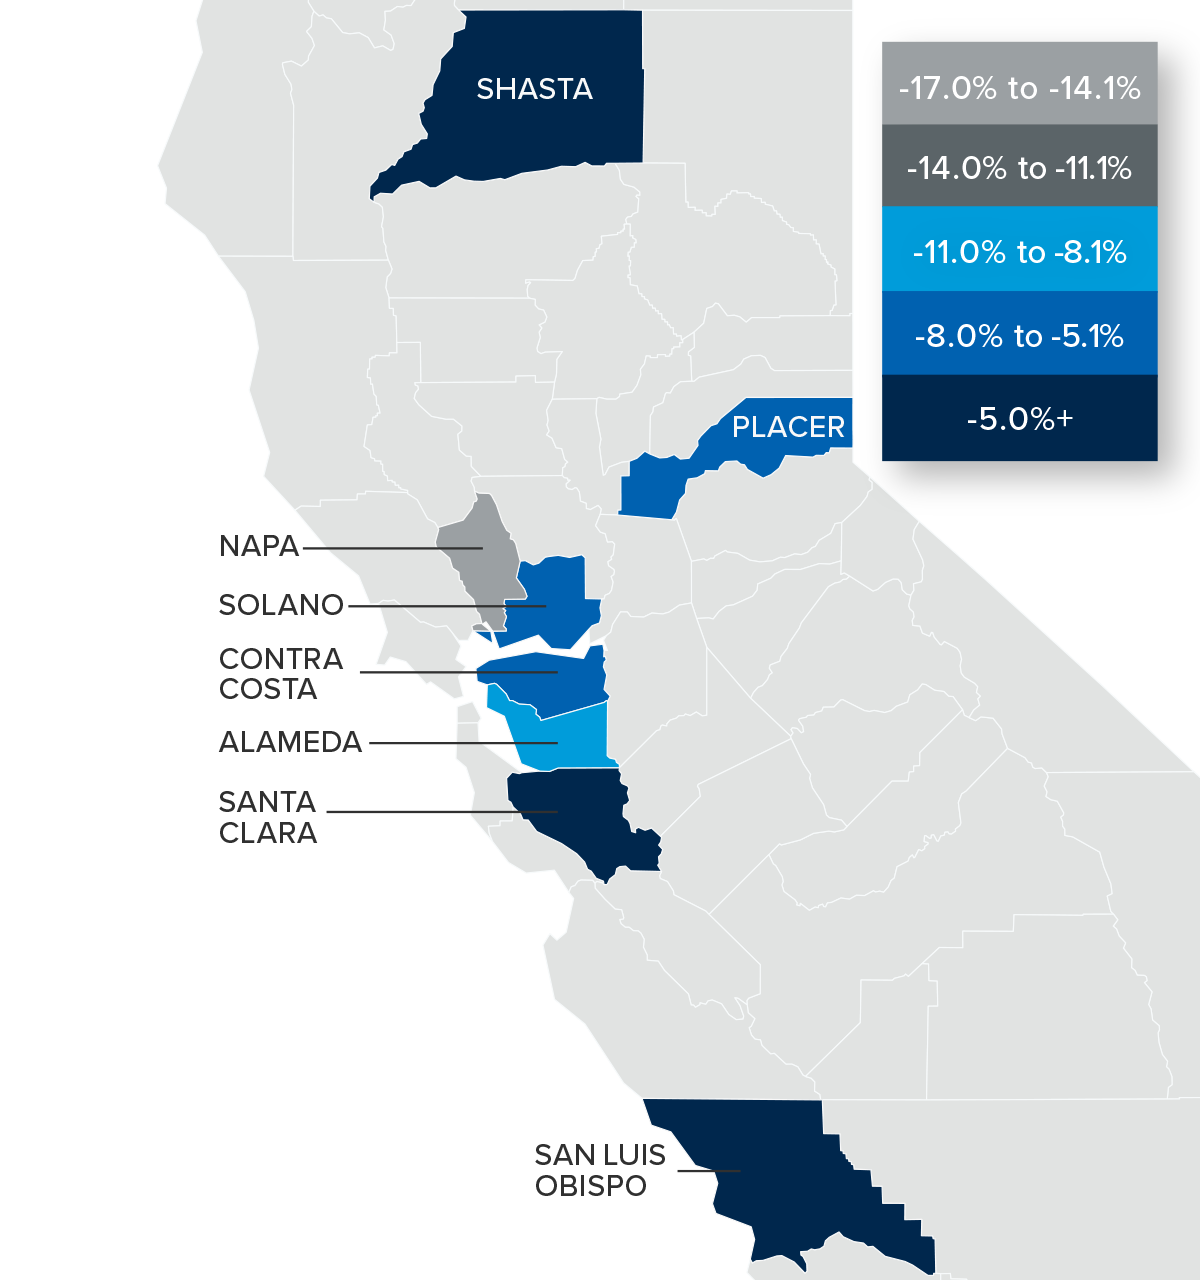
❱ Year over year, sales fell across the board, but there was significant growth in all market areas compared to the first quarter of 2023.
❱ Listing inventory was up 15.2% from the first quarter, which likely contributed to better sales volume despite higher mortgage rates.
❱ Pending home sales were up 33.1% from the first quarter of 2023, which suggests that the growth in sales may continue into the summer.
Northern California Home Prices
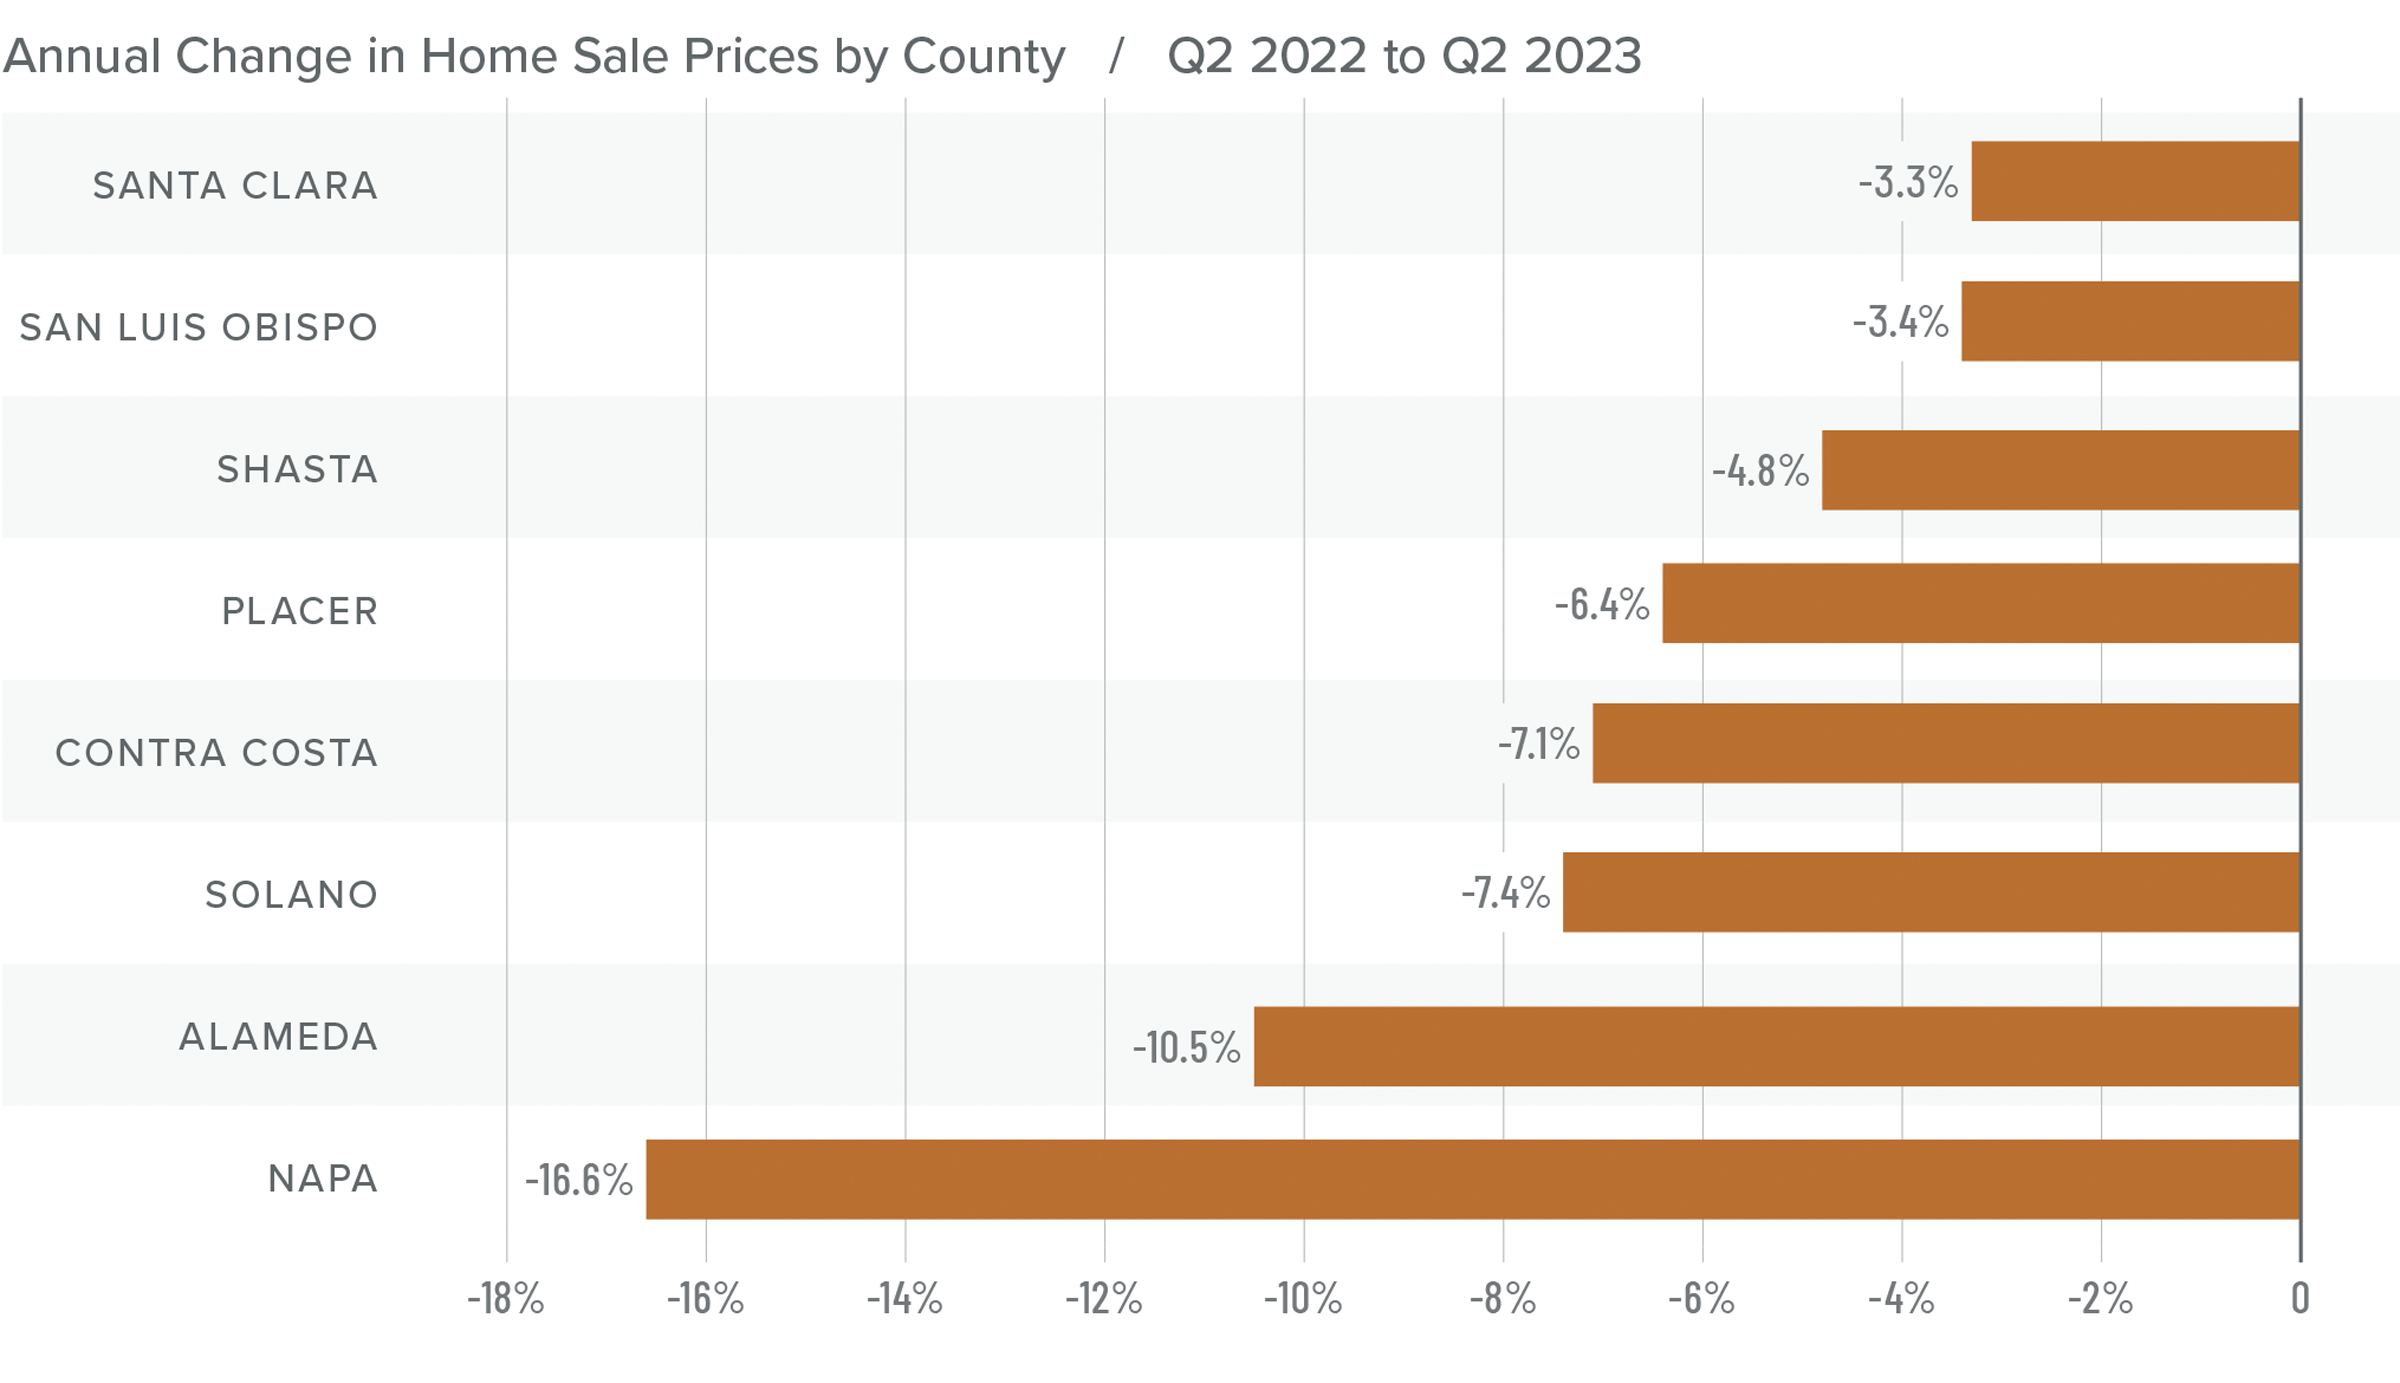
❱ Higher mortgage rates continue to impact home prices. The average price of a home sold in the region dropped 7.1% from the second quarter of 2022, but sale prices were up 16.1% compared to the first quarter of this year.
❱ Median list prices in the region rose 5.6% compared to the previous quarter. However, all markets were not equal: median asking prices dropped in Santa Clara, Placer, Shasta, and San Luis Obispo counties.
❱ Prices fell across the board from the second quarter of 2022, with double-digit drops in Napa and Alameda counties. Compared to the first quarter of 2023, sale prices were higher in all market areas, with double-digit growth in Alameda, Contra Costa, Napa, and Santa Clara counties.
❱ I predicted in the first quarter Gardner Report that the worst of the price drops were behind us, and the data suggests that this is true. Stability is returning, even in the face of higher mortgage rates.
Mortgage Rates
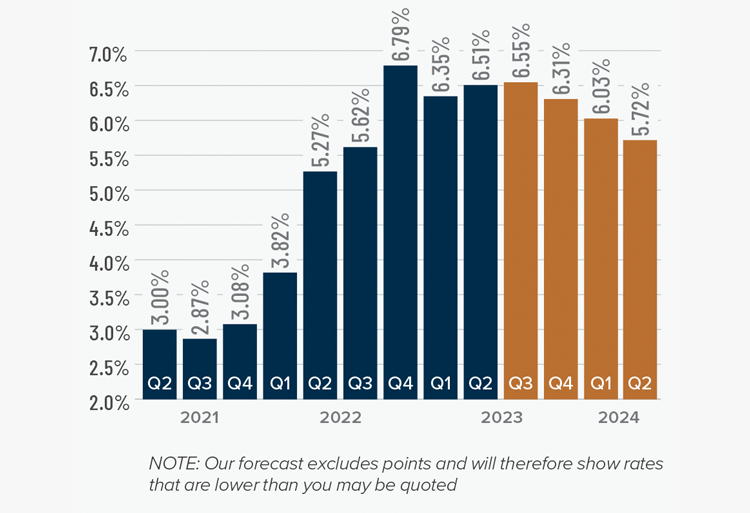
Although they were less erratic than the first quarter, mortgage rates unfortunately trended higher and ended the quarter above 7%. This was due to the short debt ceiling impasse, as well as several economic datasets that suggested the U.S. economy was not slowing at the speed required by the Federal Reserve.
While the June employment report showed fewer jobs created than earlier in the year, as well as downward revisions to prior gains, inflation has not sufficiently slowed. Until it does, rates cannot start to trend consistently lower. With the economy not slowing as fast as expected, I have adjusted my forecast: Rates will hold at current levels in third quarter and then start to trend lower through the fall. Although there are sure to be occasional spikes, my model now shows the 30-year fixed rate breaking below 6% next spring.
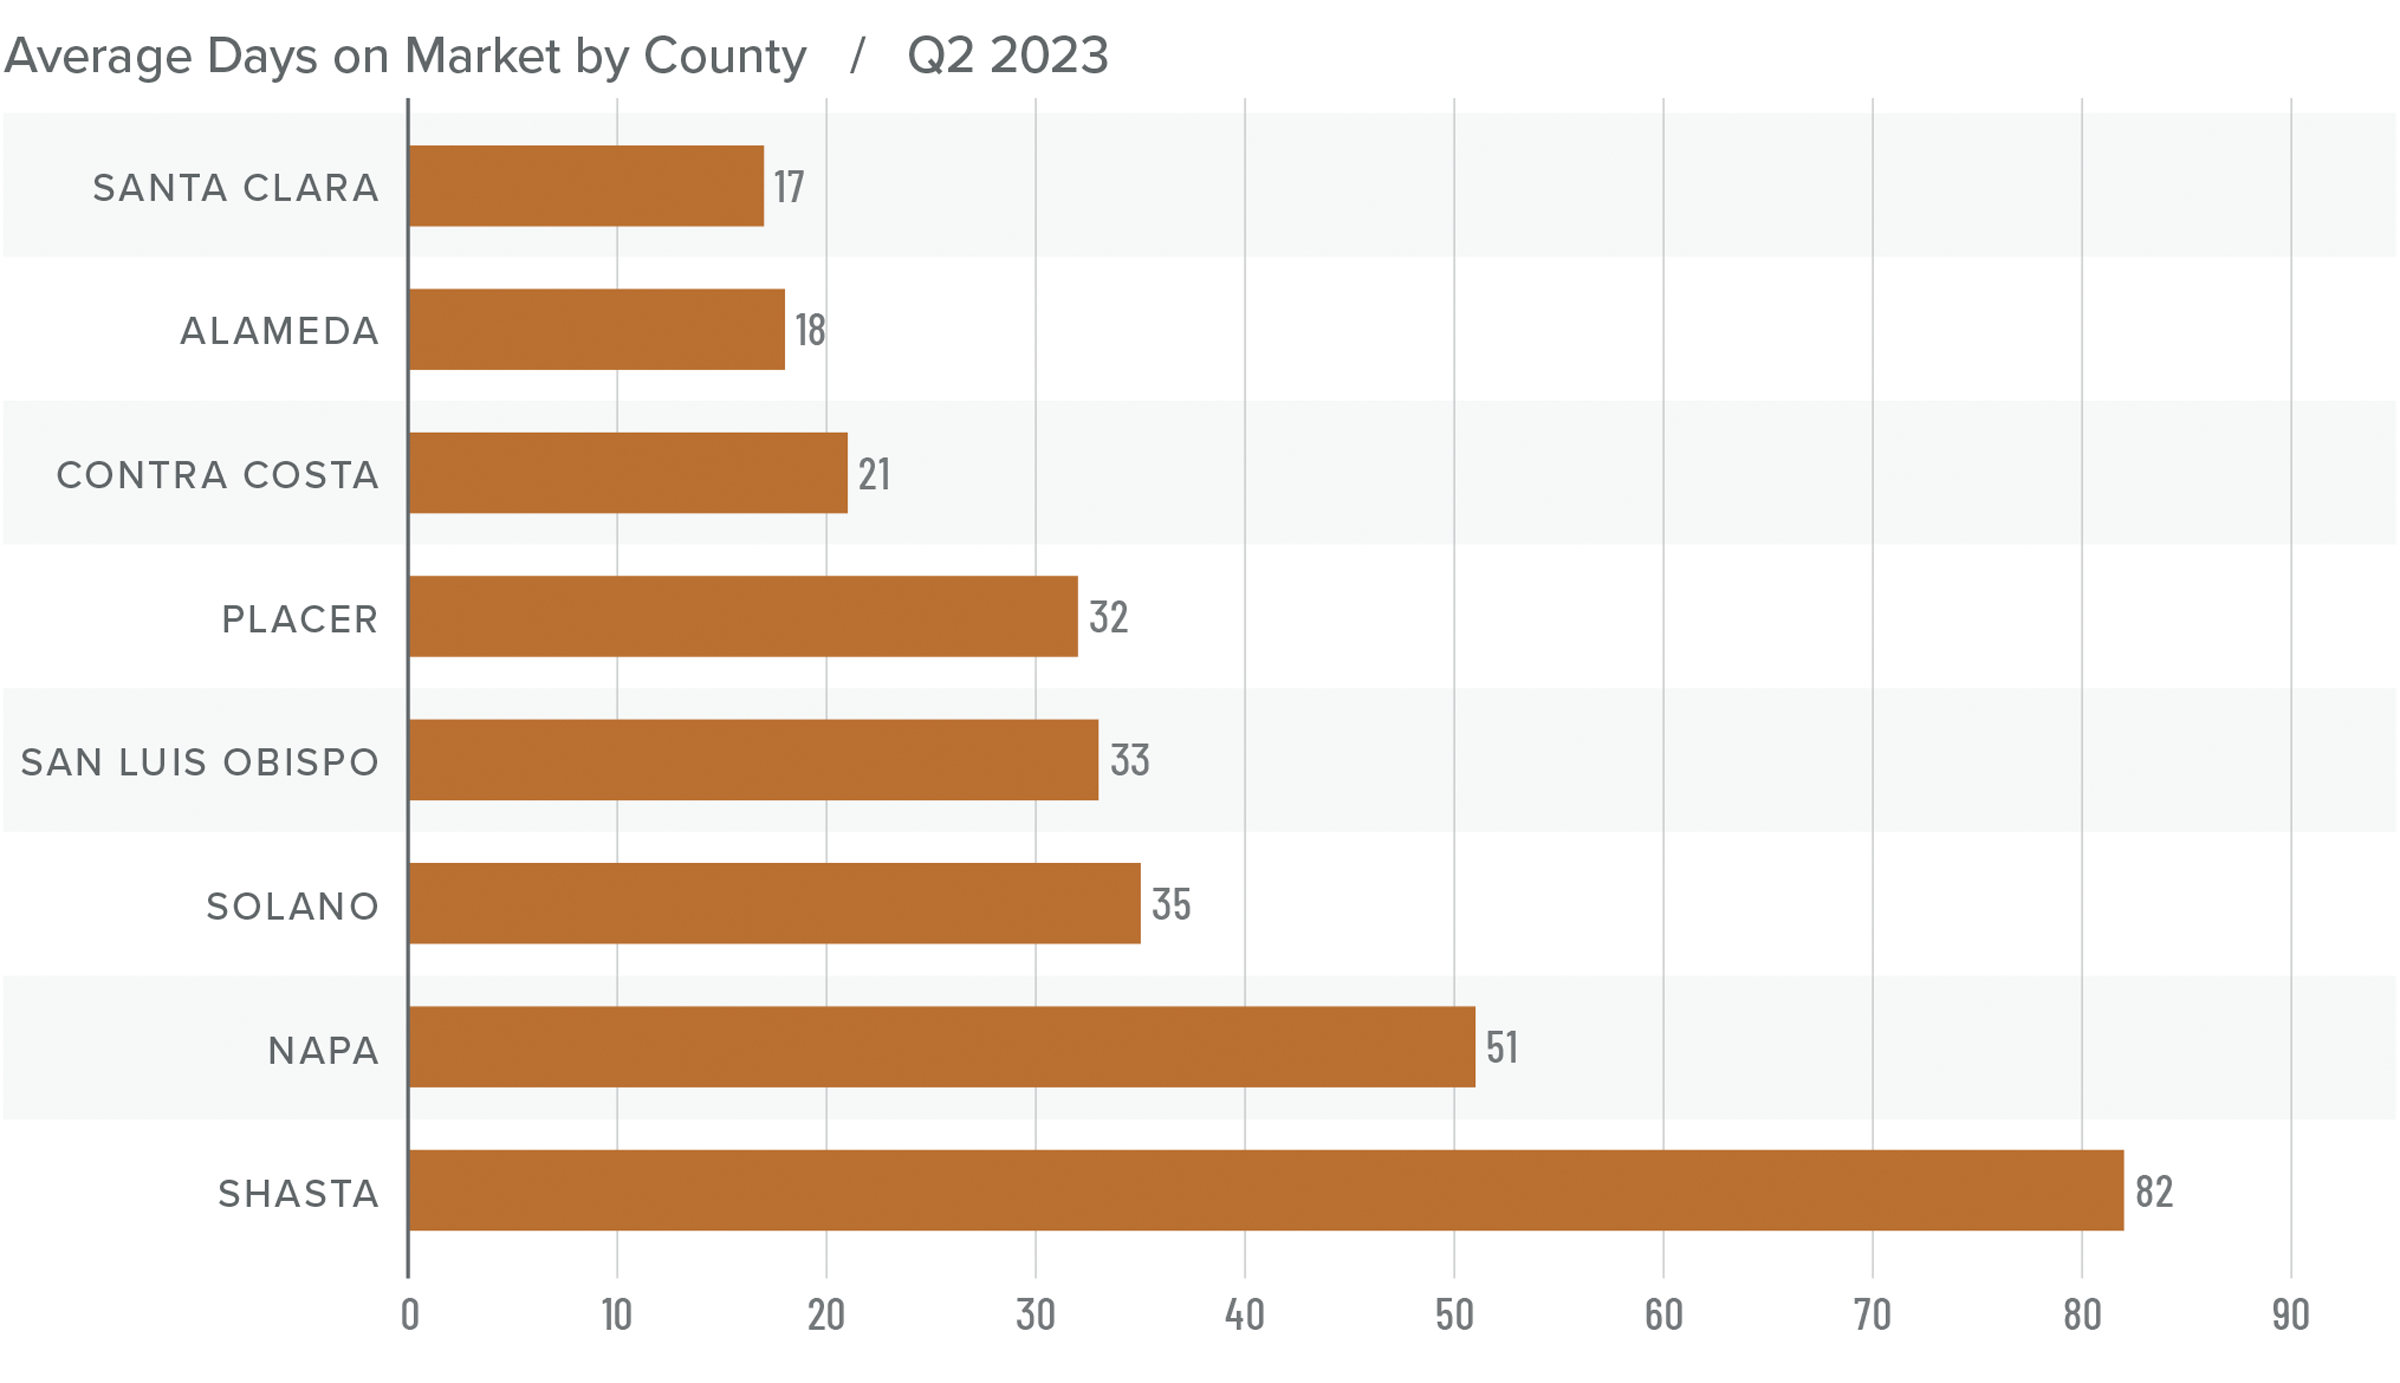
Northern California Days on Market
❱ The average time it took to sell a home in the Northern California counties in this report rose ten days compared to the second quarter of 2022.
❱ The length of time it took to sell a home rose across the region compared to the second quarter of 2022. However, market time fell across the board compared to the first quarter of this year.
❱ In the second quarter, it took an average of 36 days to sell a home, which was 15 fewer days than in the first quarter of the year.
❱ Homes sold the fastest in Santa Clara County and slowest in Shasta County. Compared to the first quarter of 2023, the greatest drop in market time was in Solano County (-27 days) and Placer County (-17 days).
Conclusions
This speedometer reflects the state of the region’s real estate market using housing inventory, price gains, home sales, interest rates, and larger economic factors.
It was interesting to see the housing market pick back up even though the economy appears to be on pause and mortgage rates are high. The question is whether this can continue. Despite higher supply levels, they remain well below historic averages, which is causing prices to rise. The reason for this is that 30% of homeowners in California have a mortgage rate at or below 3%, so there is no incentive to sell if they don’t have to.
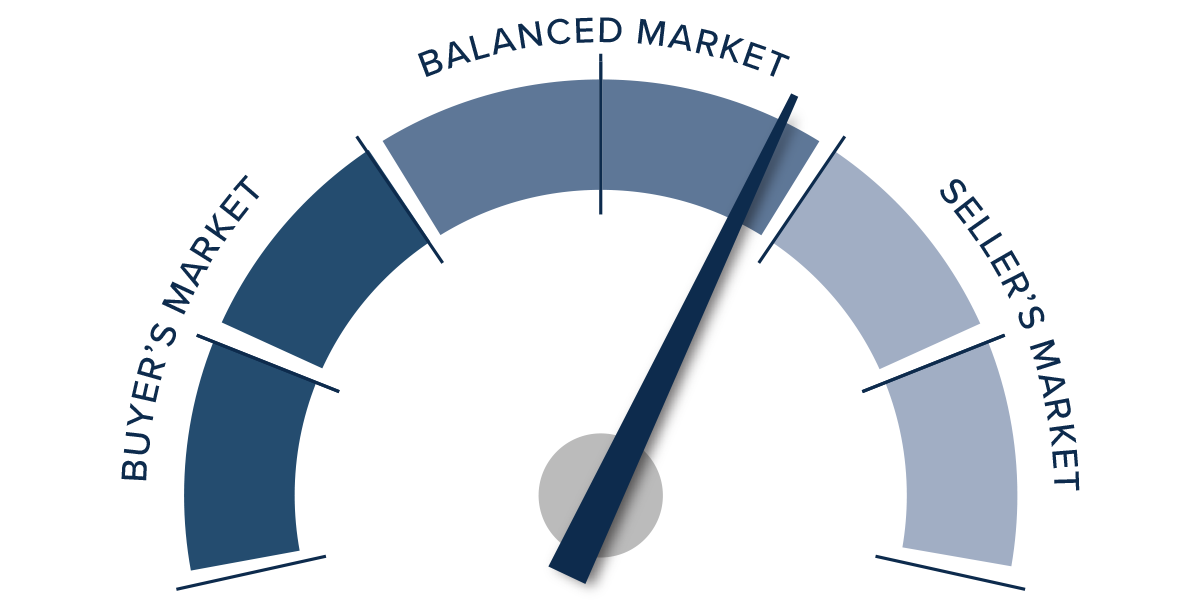
Assuming that supply will not increase significantly and that my forecast for mortgage rates to fall modestly through the rest of the year is accurate, I stand by my prediction that the worst of the price drops are over in the Northern California markets covered by this report. Given all the above, I am moving the needle more in favor of sellers, but still holding in the balanced quadrant of the speedometer.
About Matthew Gardner

As Chief Economist for Windermere Real Estate, Matthew Gardner is responsible for analyzing and interpreting economic data and its impact on the real estate market on both a local and national level. Matthew has over 30 years of professional experience both in the U.S. and U.K.
In addition to his day-to-day responsibilities, Matthew sits on the Washington State Governors Council of Economic Advisors; chairs the Board of Trustees at the Washington Center for Real Estate Research at the University of Washington; and is an Advisory Board Member at the Runstad Center for Real Estate Studies at the University of Washington where he also lectures in real estate economics.
")


