
 Facebook
 X
X
 Pinterest
 Copy Link

The following analysis of select counties of the Montana real estate market is provided by Windermere Real Estate Chief Economist Matthew Gardner. We hope that this information may assist you with making better-informed real estate decisions. For further information about the housing market in your area, please don’t hesitate to contact your Windermere Real Estate agent.
Regional Economic Overview
Year over year, Montana added 12,600 jobs, representing a solid growth rate of 2.5%. The slowdown in employment gains in the fourth quarter of 2022 appears to have turned. The rest of the region had the same change in trajectory except Billings, which lost 400 jobs over the past 12 months. The state unemployment rate in February was 2.4%, which was down from 2.5% in the first quarter of 2022. In the metro areas covered in this report, the lowest jobless rate was in Billings at 2.2%. In Missoula and Great Falls, 2.4% of their respective labor force remains unemployed.
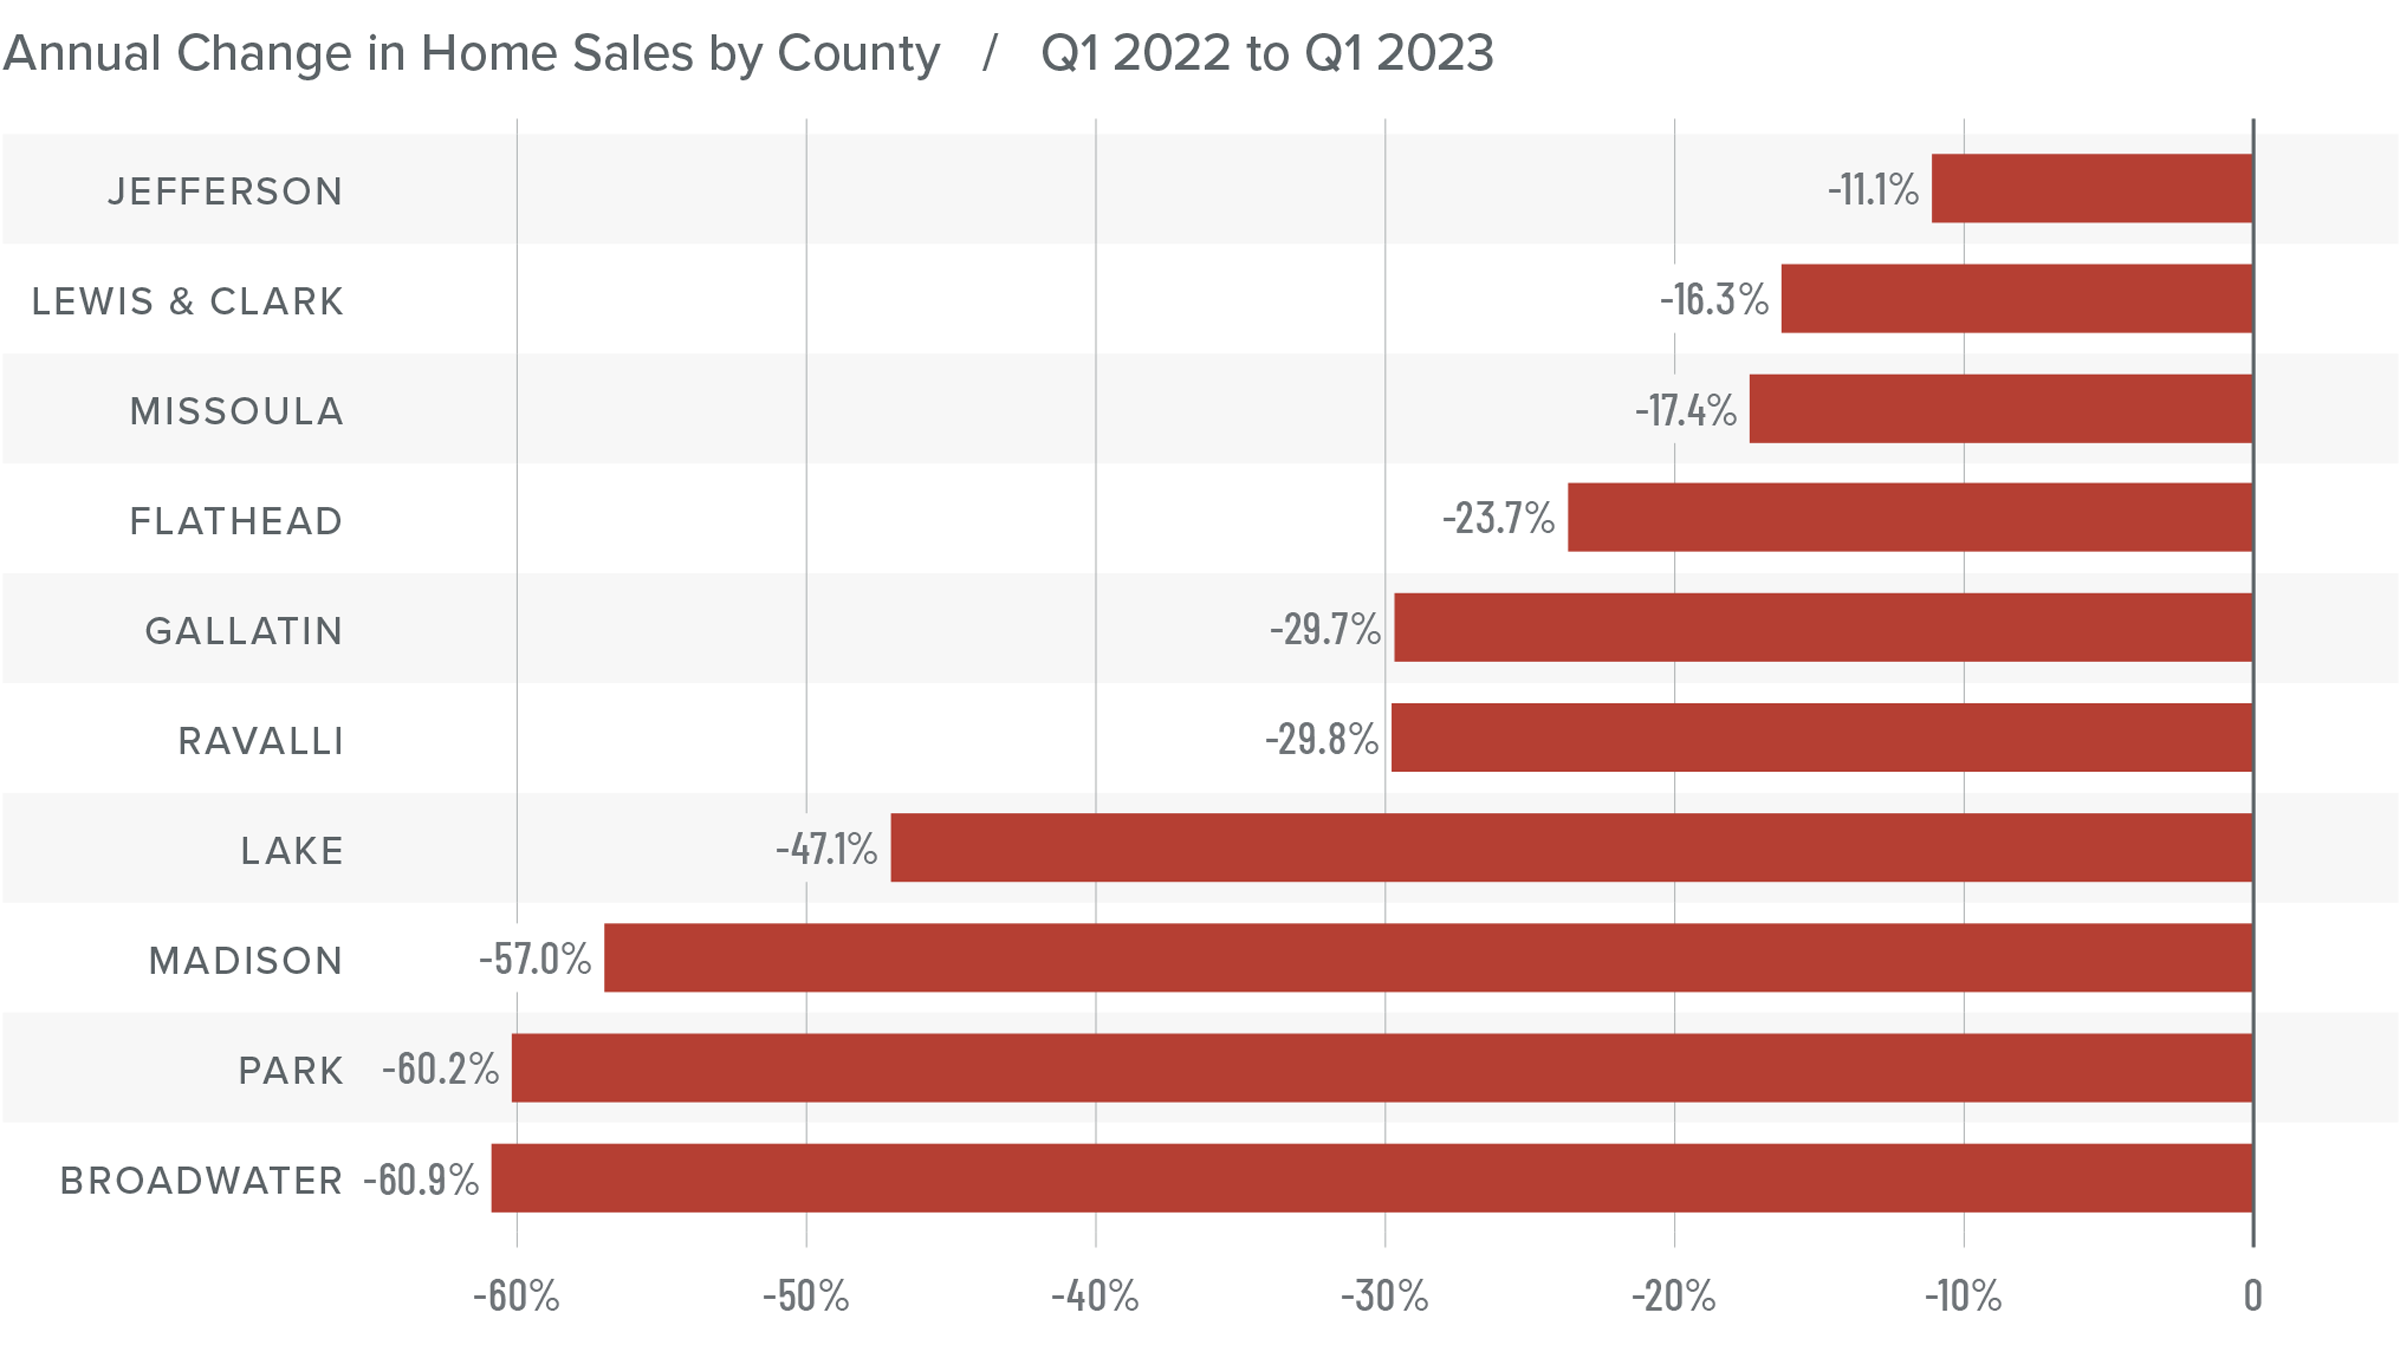
Montana Home Sales
❱ In the first quarter of 2023, 1,273 homes sold, which was a 29.6% decline from the first quarter of 2022. Sales activity fell 23.4% compared to the final quarter of last year.
❱ Listing activity was 66% higher than in the same period of 2022, but down 3.5% compared to the fourth quarter of 2022. The market has become tight again.
❱ Sales fell across the board from the first quarter of 2022. Compared to the final quarter of last year, sales rose in Jefferson County but fell in the rest of the market areas.
❱ Pending sales rose 14.1% quarter over quarter. This suggests that closings in the second quarter could be higher, but low levels of inventory may hold the market back.
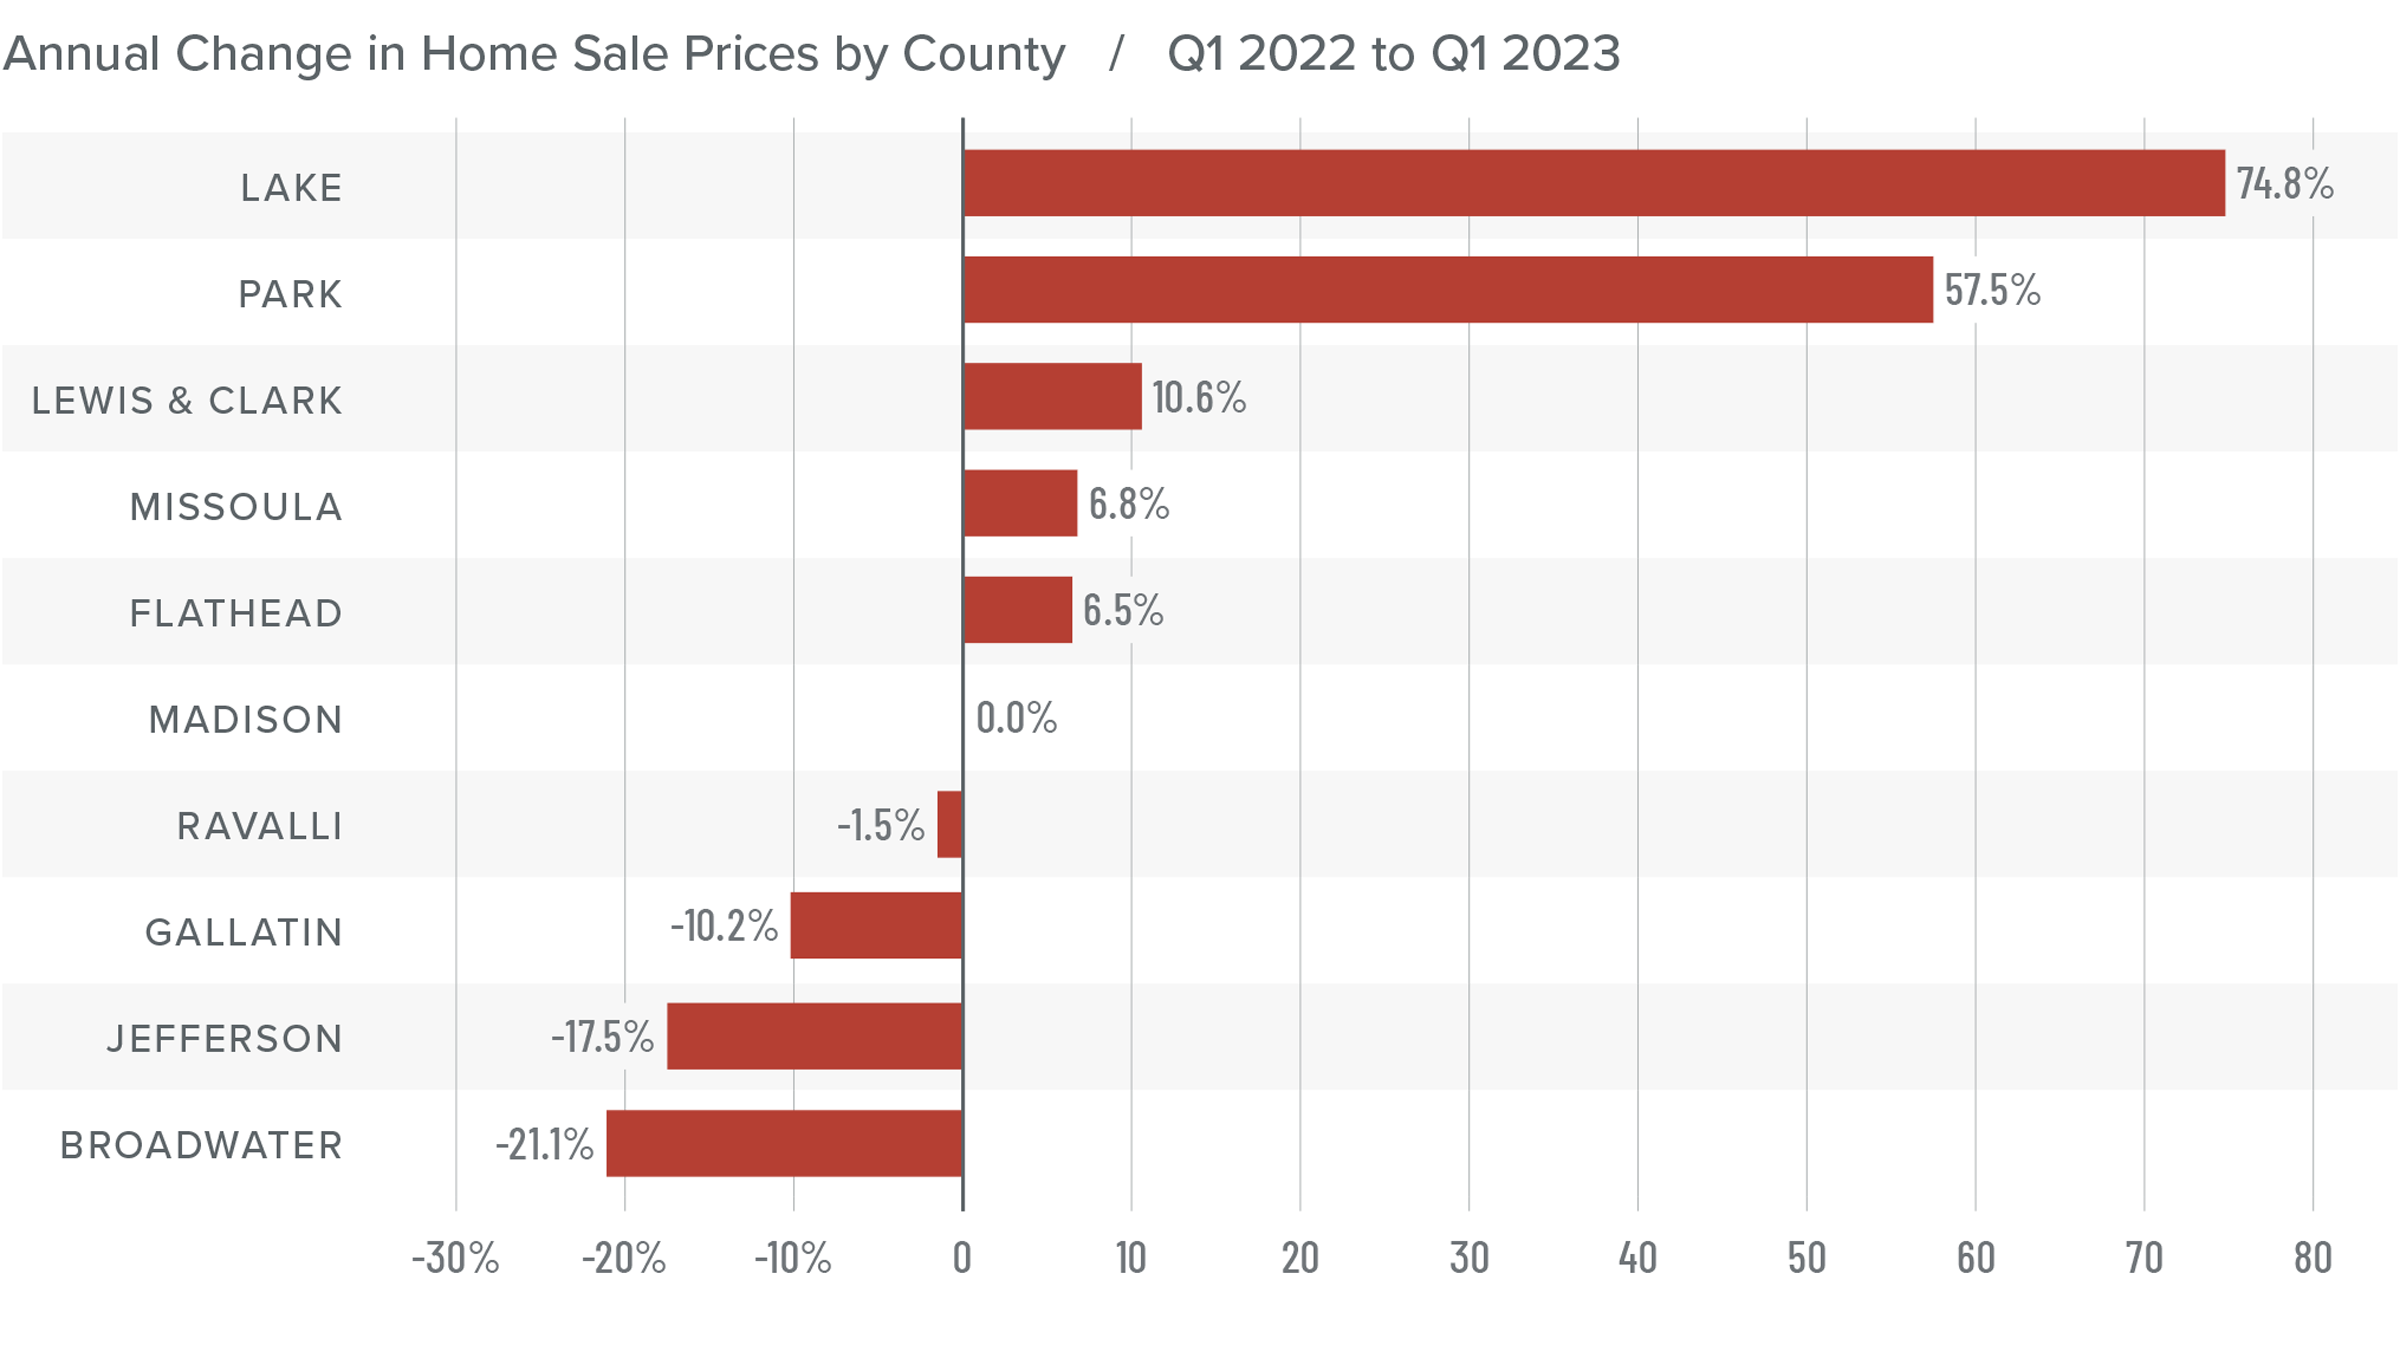
Montana Home Prices
❱ Home prices were up .2% year over year to an average sale price of $747,158. The average sale price rose 3.1% compared to the fourth quarter of 2022.
❱ The market has been more resilient than many had expected, given significantly higher financing costs. It was also interesting that the median listing price across the region was 1.4% higher than at the end of last year. The Montana market remains more confident than most of the country!
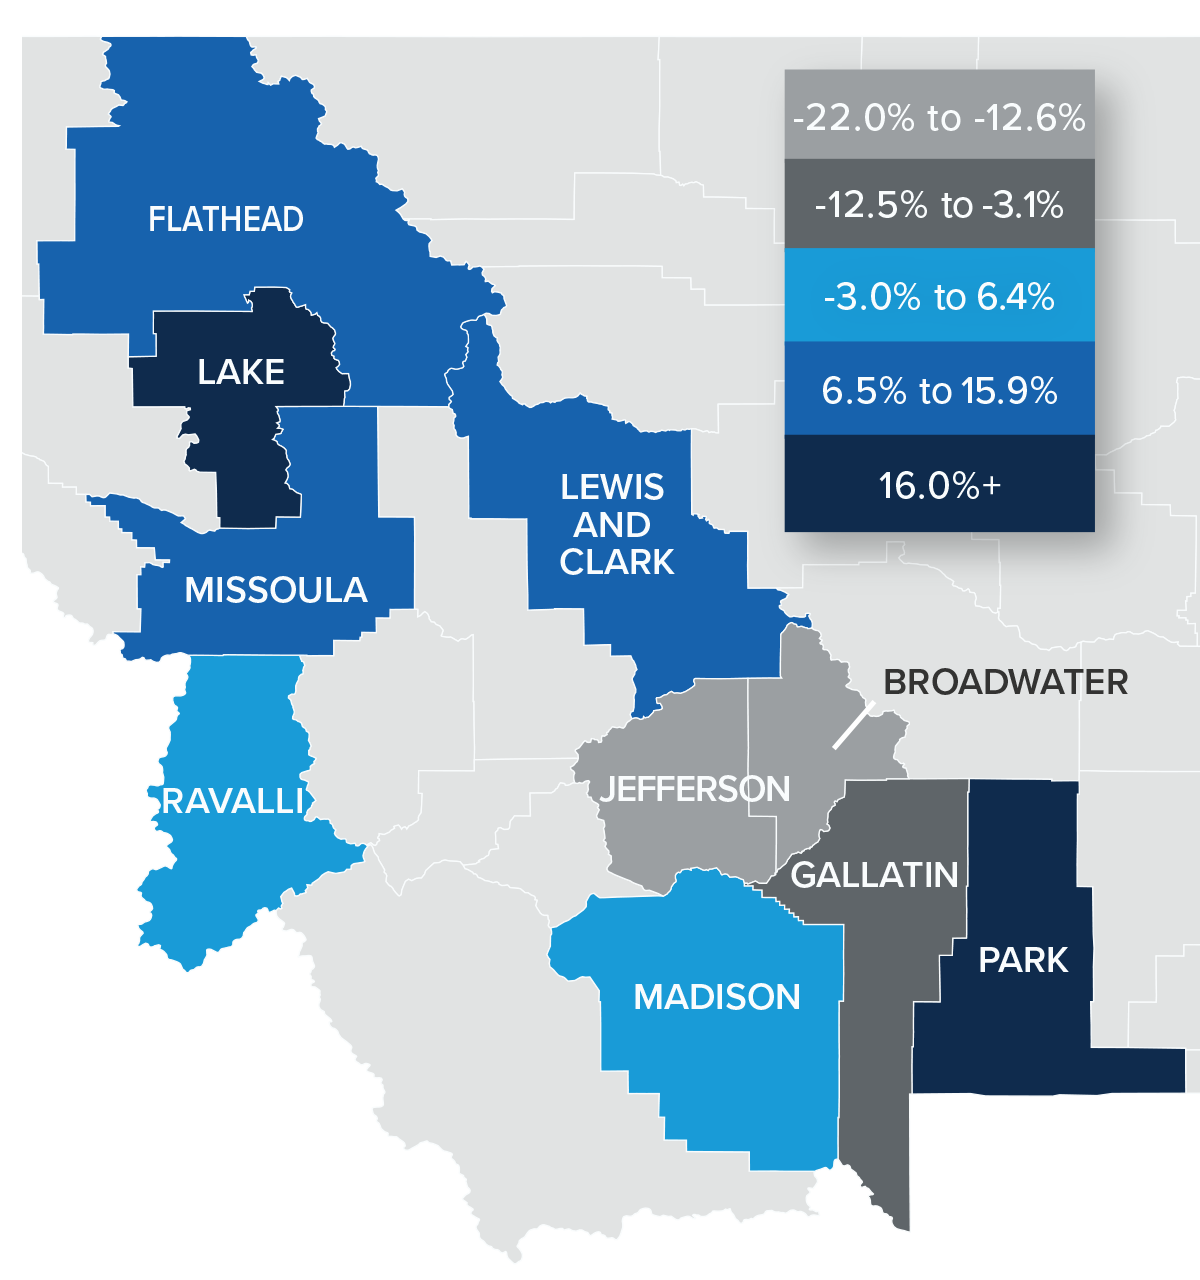
❱ Year over year, prices rose in five counties, remained static in one, and fell in four. What was more interesting, however, was that over half of the counties surveyed saw prices rise quarter over quarter. The only counties that had price declines were Broadwater, Jefferson, Gallatin, and Park.
❱ Ultimately, I expect prices to dip a little more before finding stability this summer and then starting to rise again as mortgage rates fall.
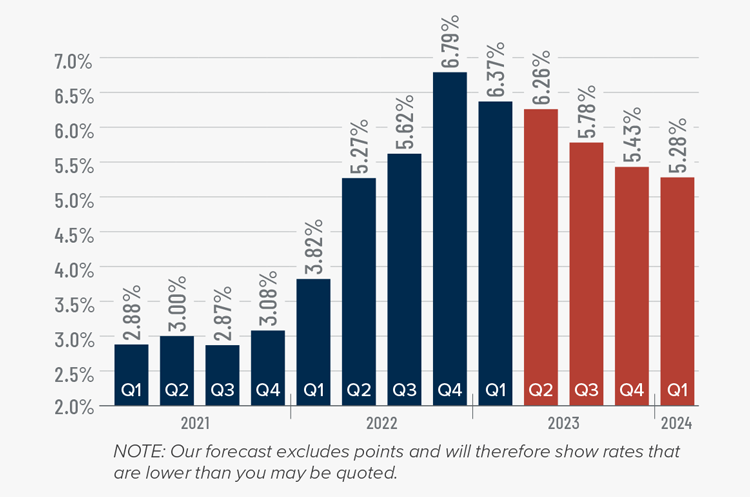
Mortgage Rates
Rates in the first quarter of 2023 were far less volatile than last year, even with the brief but significant impact of early March’s banking crisis. It appears that buyers are jumping in when rates dip, which was the case in mid-January and again in early February.
Even with the March Consumer Price Index report showing inflation slowing, I still expect the Federal Reserve to raise short-term rates one more time following their May meeting before pausing rate increases. This should be the catalyst that allows mortgage rates to start trending lower at a more consistent pace than we have seen so far this year. My current forecast is that rates will continue to move lower with occasional spikes, and that they will hold below 6% in the second half of this year.
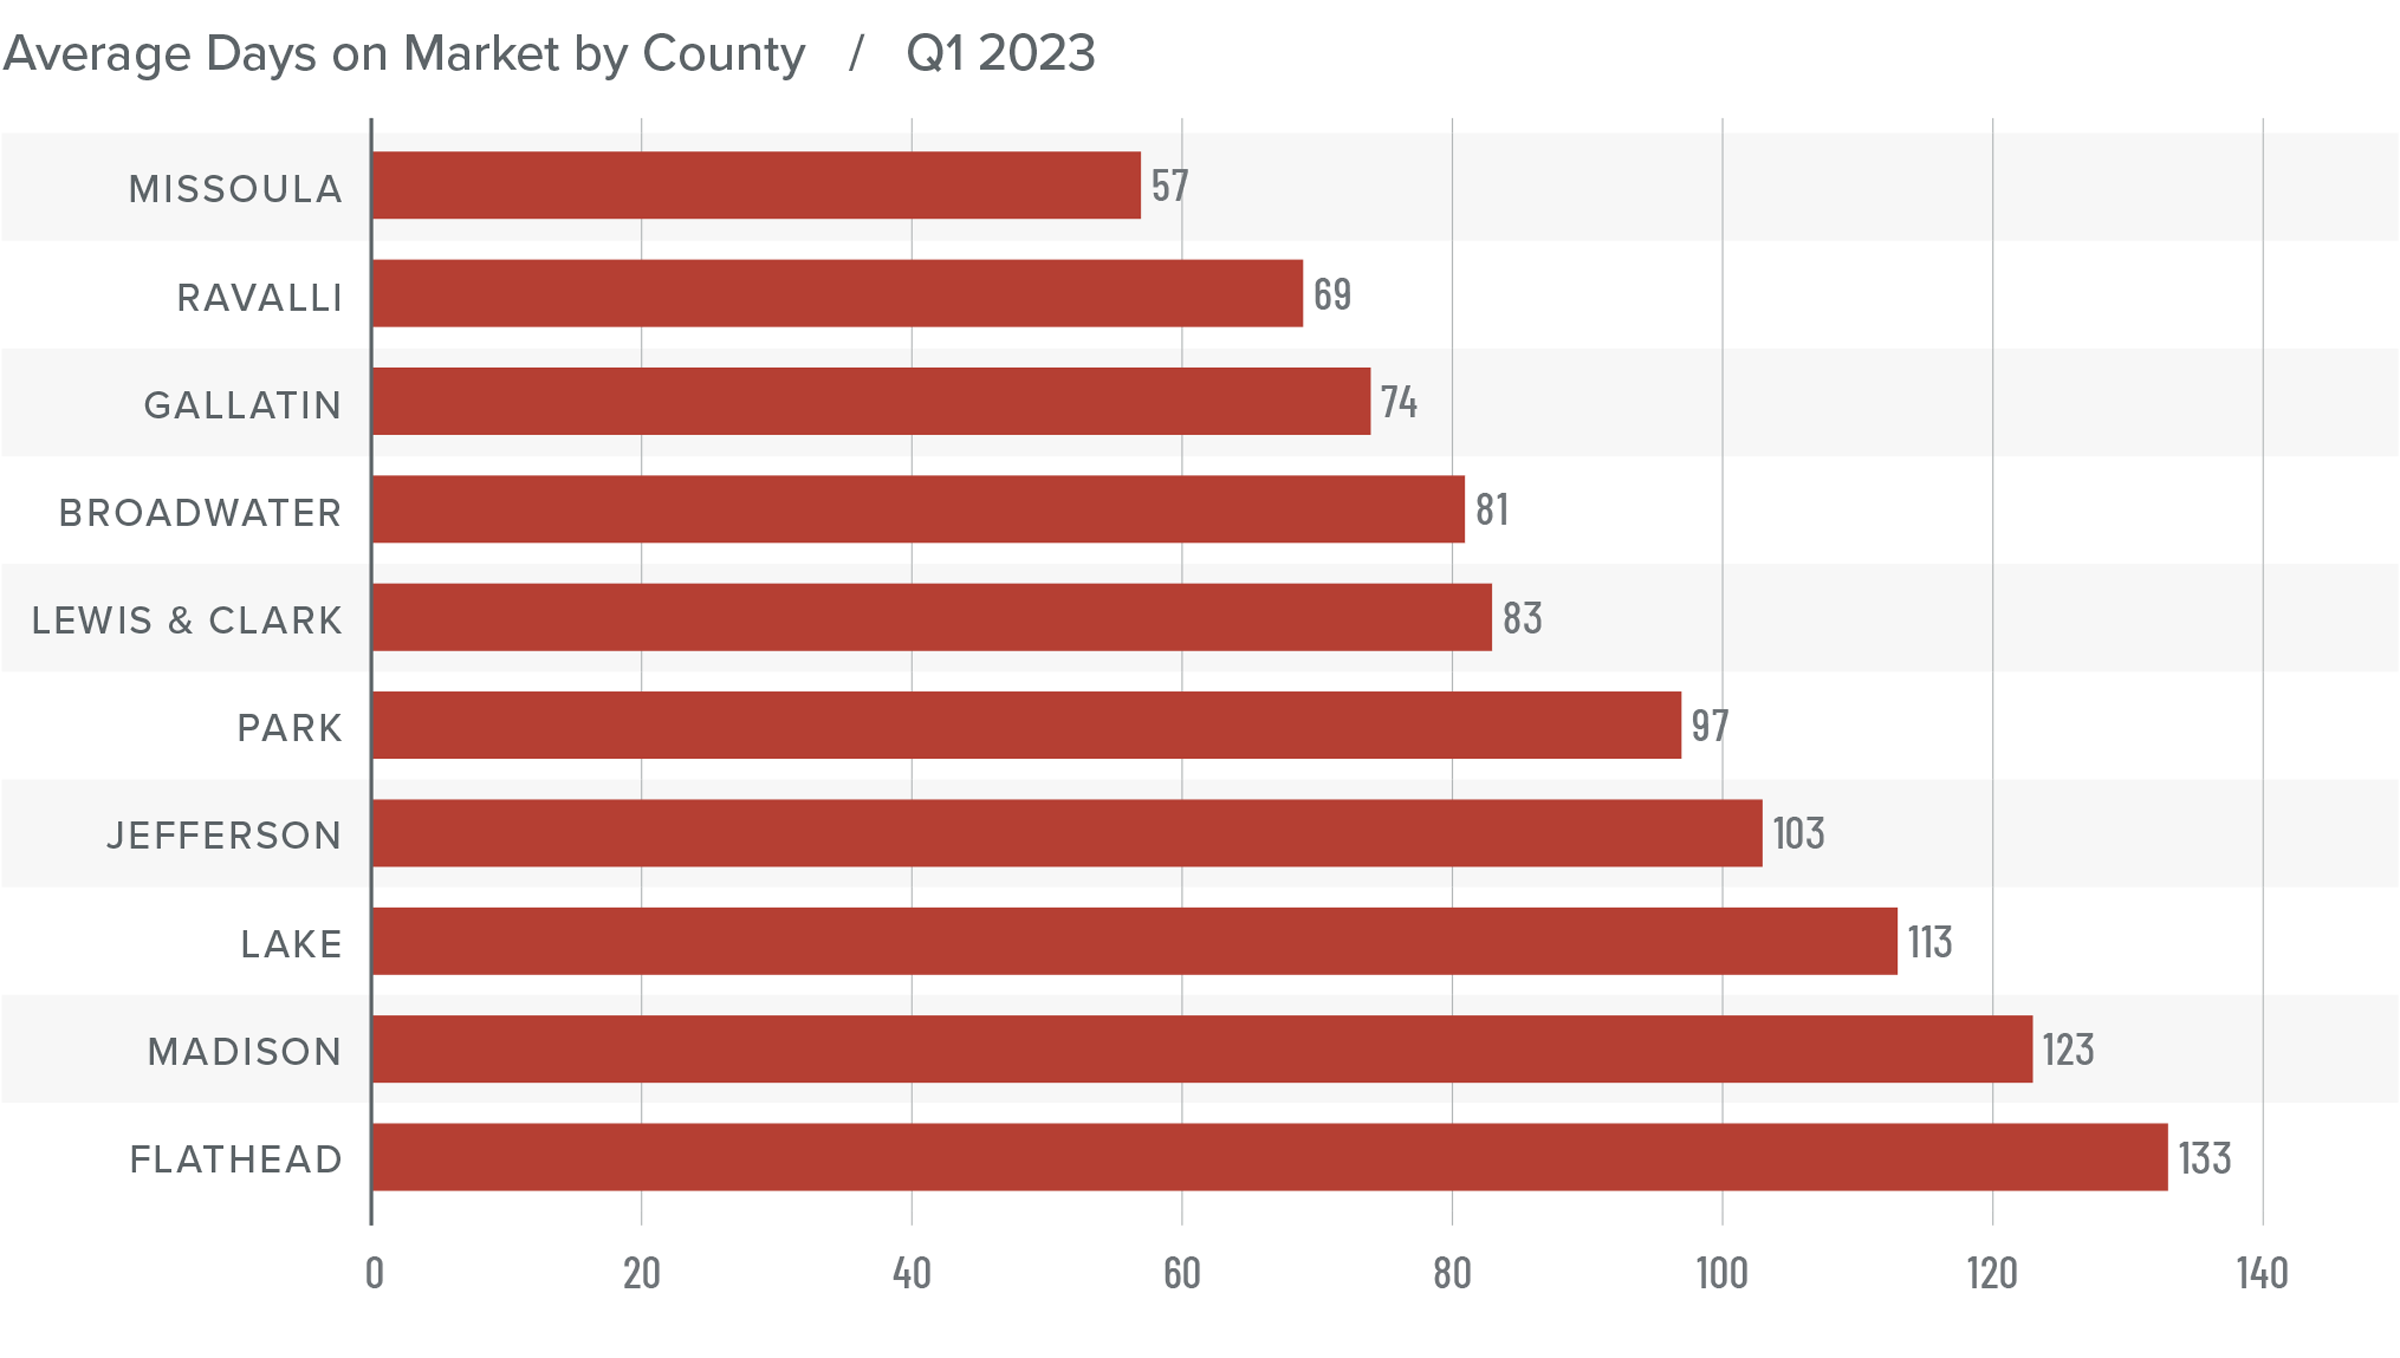
Montana Days on Market
❱ The average time it took to sell a home rose 19 days compared to the same period in 2022.
❱ Homes sold fastest in Missoula County while homes in Flathead County took the longest to sell. Broadwater and Madison counties saw days on market fall compared to the same period in 2022. Average market time rose in the rest of the region.
❱ During the first quarter, it took an average of 93 days to sell a home in the markets covered by this report.
❱ Compared to the final quarter of 2022, average market time rose in all counties other than Broadwater (-17 days) and Ravalli (-13 days).
Conclusions
This speedometer reflects the state of the region’s real estate market using housing inventory, price gains, home sales, interest rates, and larger economic factors.
Even in the face of significantly higher mortgage rates, the market has been very reluctant to give up the remarkable gains that home values saw during the pandemic period. However, it appears as if the nationwide trend has started to slowly impact the Treasure State. There are markets that have given back some of the value gained over the past few years, but it’s certainly not a collapse by any stretch of the imagination. Lower sales, prices, and longer days on market favor home buyers. However, inventory limitations, solid absorption rates, and higher listing prices benefit home sellers.
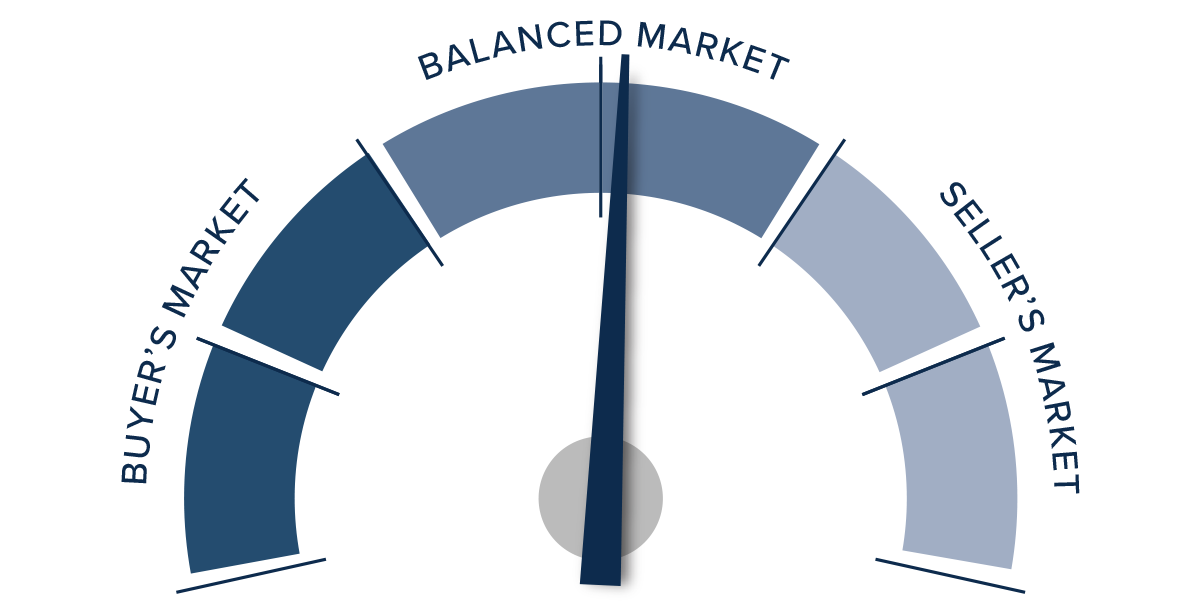
Although further erosion of home values is likely, I anticipate a number of the counties contained in this report will experience price growth in 2023. It’s unlikely to be significant, but it is growth all the same. As such, I am leaving the needle in the balanced area but tilted slightly toward home sellers.
About Matthew Gardner

As Chief Economist for Windermere Real Estate, Matthew Gardner is responsible for analyzing and interpreting economic data and its impact on the real estate market on both a local and national level. Matthew has over 30 years of professional experience both in the U.S. and U.K.
In addition to his day-to-day responsibilities, Matthew sits on the Washington State Governors Council of Economic Advisors; chairs the Board of Trustees at the Washington Center for Real Estate Research at the University of Washington; and is an Advisory Board Member at the Runstad Center for Real Estate Studies at the University of Washington where he also lectures in real estate economics.
")


