
 Facebook
 X
X
 Pinterest
 Copy Link

The following analysis of select Maui real estate markets is provided by Windermere Real Estate Chief Economist Matthew Gardner. We hope that this information may assist you with making better-informed real estate decisions. For further information about the housing market in your area, please don’t hesitate to contact your Windermere agent.
Regional Economic Overview
Maui saw a significant number of jobs return in the fall of 2020, but the momentum did not continue through the new year. In the first quarter, the island saw the return of only 1,200 jobs—compared to the more than 11,000 jobs that returned in the fourth quarter of 2020. Clearly the economy remains in a fragile position and the area is anxiously waiting for tourists to return in greater numbers. The growth in the final quarter of 2020 was a result of relaxed travel restrictions, but rising infection rates on the mainland have led to more restrictions, which has likely impacted the number of jobs returning.
Although the pace of job recovery has stalled, it’s worth noting that Maui has recovered 13,650 of the 28,850 jobs that were lost due to the pandemic. Maui’s unemployment rate was 12.5% in March, down from 13.8% at the end of 2020. The state unemployment rate was 9% in March, down from 10.3% in December. All of the islands continue to suffer from slow economic growth due to the pandemic, but I remain hopeful that jobs will return, and the pace of recovery will pick up speed in the second half of the year.
Maui, Hawaii Home Sales
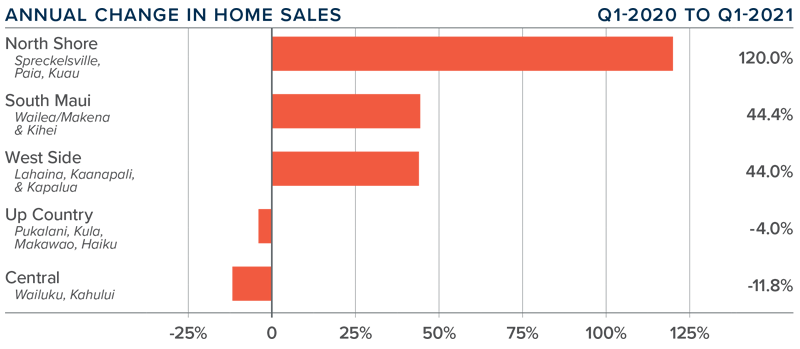
❱ In the first quarter, 684 homes sold, which was an increase of 25.3% compared to a year ago and 11.2% higher than in the final quarter of 2020.
❱ Home sales were not equally spread across the island, with sales rising in three areas and declining in two. The very small North Shore market saw the largest percentage increase in sales, but South Maui saw the largest increase in absolute terms, with 99 more transactions in the quarter than a year ago.
❱ Listing activity remains limited. The average number of homes for sale was down 29% compared to the same quarter in 2020 and 34% lower than in the fourth quarter of last year.
❱ Pending home sales jumped 52% compared to the prior quarter, suggesting that closings in the second quarter will likely show further improvement.
maui, hawaii Home Prices

❱ Listing activity remains limited. The average number of homes for sale was down 29% compared to the same quarter in 2020 and 34% lower than in the fourth quarter of last year.
❱ Pending home sales jumped 52% compared to the prior quarter, suggesting that closings in the second quarter will likely show further improvement.
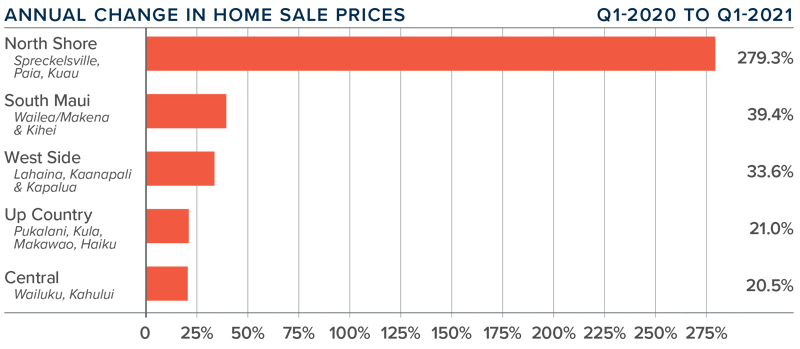
❱ Home prices in all markets saw very significant increases, which is likely due to the limited number of homes for sale and demand exceeding supply. The jump in the area’s average price was partly driven by the North Shore market which saw prices rising from $723,000 to $2.7M.
❱ Price growth will continue as we move through 2021, but the frenetic pace is likely to taper somewhat.
Days on Market
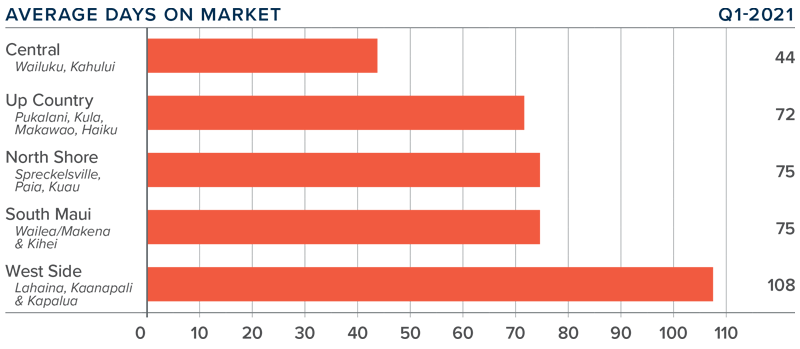
❱ The average number of days it took to sell a home on Maui rose 18 days compared to the first quarter of 2020.
❱ The length of time it took to sell a home rose in all markets on the island.
❱ In the quarter, it took an average of 75 days to sell a home, with sales occurring the fastest in the Central area and slowest on the Westside.
❱ Market time also rose four days compared to the fourth quarter of 2020, giving further credence to my position that affordability issues are still outweighing the limited number of homes for sale.
Conclusions
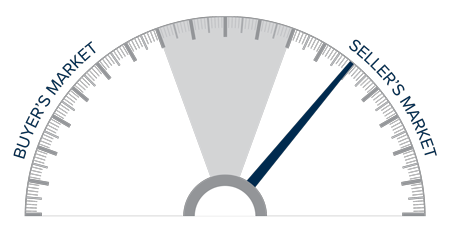
This speedometer reflects the state of the region’s real estate market using housing inventory, price gains, home sales, interest rates, and larger economic factors.
As noted in this report, prices have been rising significantly and demand is exceeding supply. That said, market time has risen, which would suggest that it may not be as much of a seller’s market as one might think. I believe that affordability, combined with persistently high COVID-19 infection rates on the mainland, may be keeping mainland buyers away. If I am correct, we should see more buyers as the vaccine is more broadly distributed, which will stimulate the market again.
As such, the market still favors sellers, and I am moving the needle a little more in their favor.
About Matthew Gardner

As Chief Economist for Windermere Real Estate, Matthew Gardner is responsible for analyzing and interpreting economic data and its impact on the real estate market on both a local and national level. Matthew has over 30 years of professional experience both in the U.S. and U.K.
In addition to his day-to-day responsibilities, Matthew sits on the Washington State Governors Council of Economic Advisors; chairs the Board of Trustees at the Washington Center for Real Estate Research at the University of Washington; and is an Advisory Board Member at the Runstad Center for Real Estate Studies at the University of Washington where he also lectures in real estate economics.
")


