
 Facebook
 X
X
 Pinterest
 Copy Link

The following analysis of select counties of the greater Las Vegas real estate market is provided by Windermere Real Estate Chief Economist Matthew Gardner. We hope that this information may assist you with making better-informed real estate decisions. For further information about the housing market in your area, please don’t hesitate to contact your Windermere Real Estate agent.
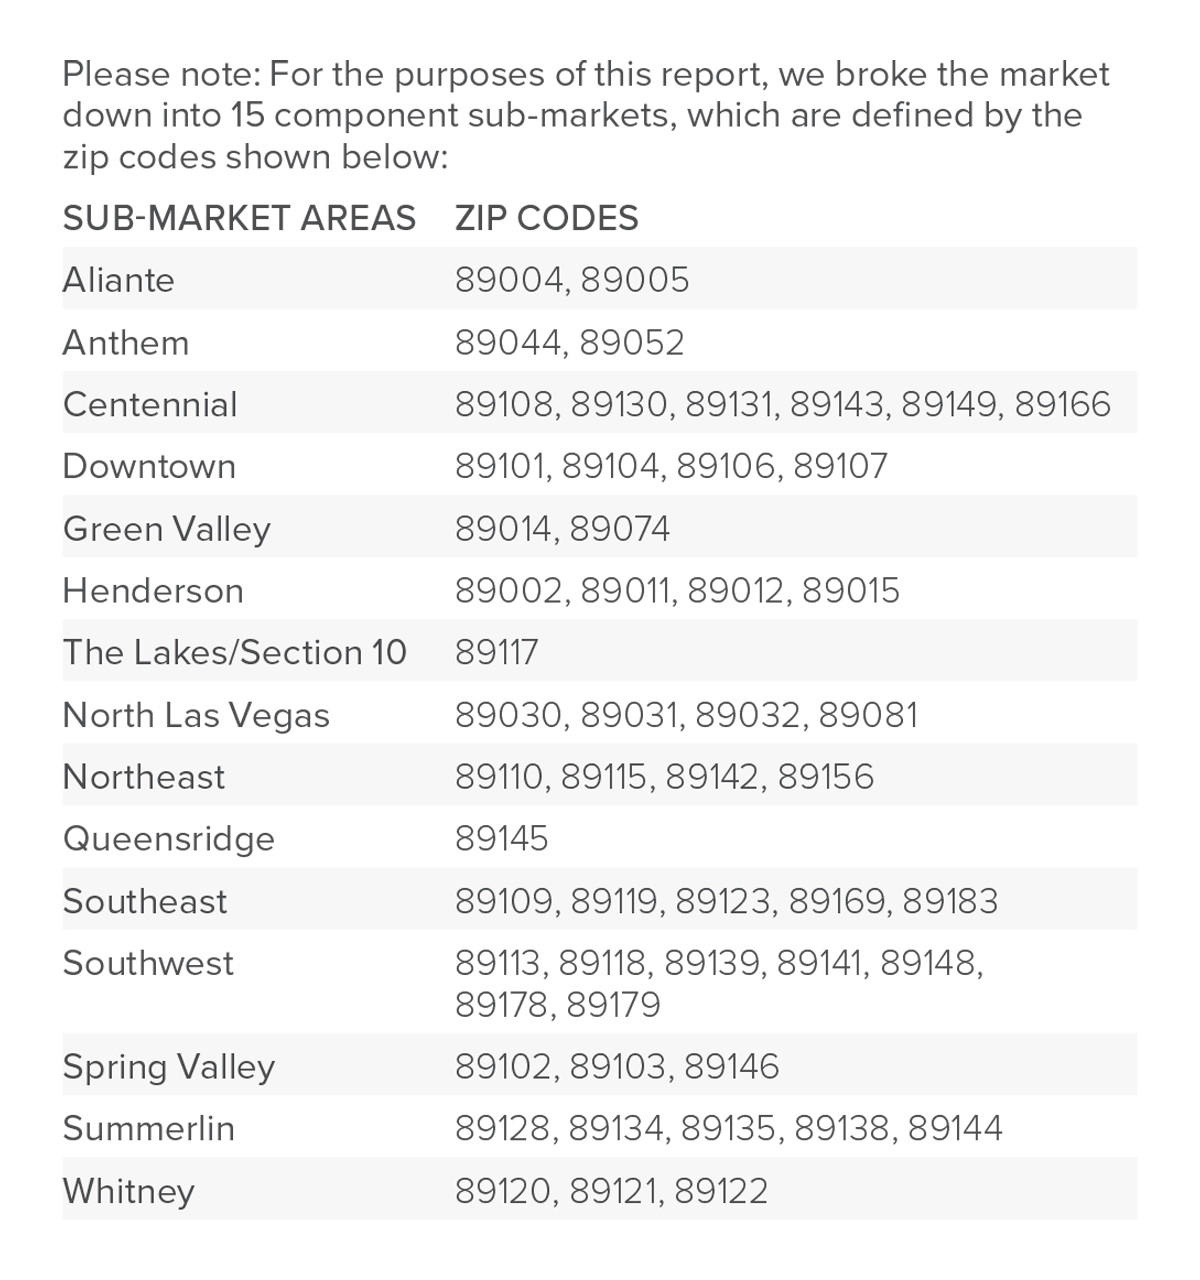
Regional Economic Overview
The Las Vegas area continues to add jobs and the pace of growth remains impressive. There are currently 1.118 million people working in the metro area, which is 58,000 more than during the same period in 2022 and represents an annual growth rate of 5.5%. Although the job market remains remarkably robust, the unemployment rate continues to tick modestly higher. Though this may seem unusual, it really isn’t. The number of jobs being added is substantial, which has led the labor force to grow significantly. When people start looking for work, they are counted as “unemployed,” which can raise the jobless rate. The non-seasonally adjusted unemployment rate in February was 6%, which was up from 5.3% in the first quarter of 2022. The seasonally adjusted rate was 6.2%, which was up from 5.5% during the same period in 2022.
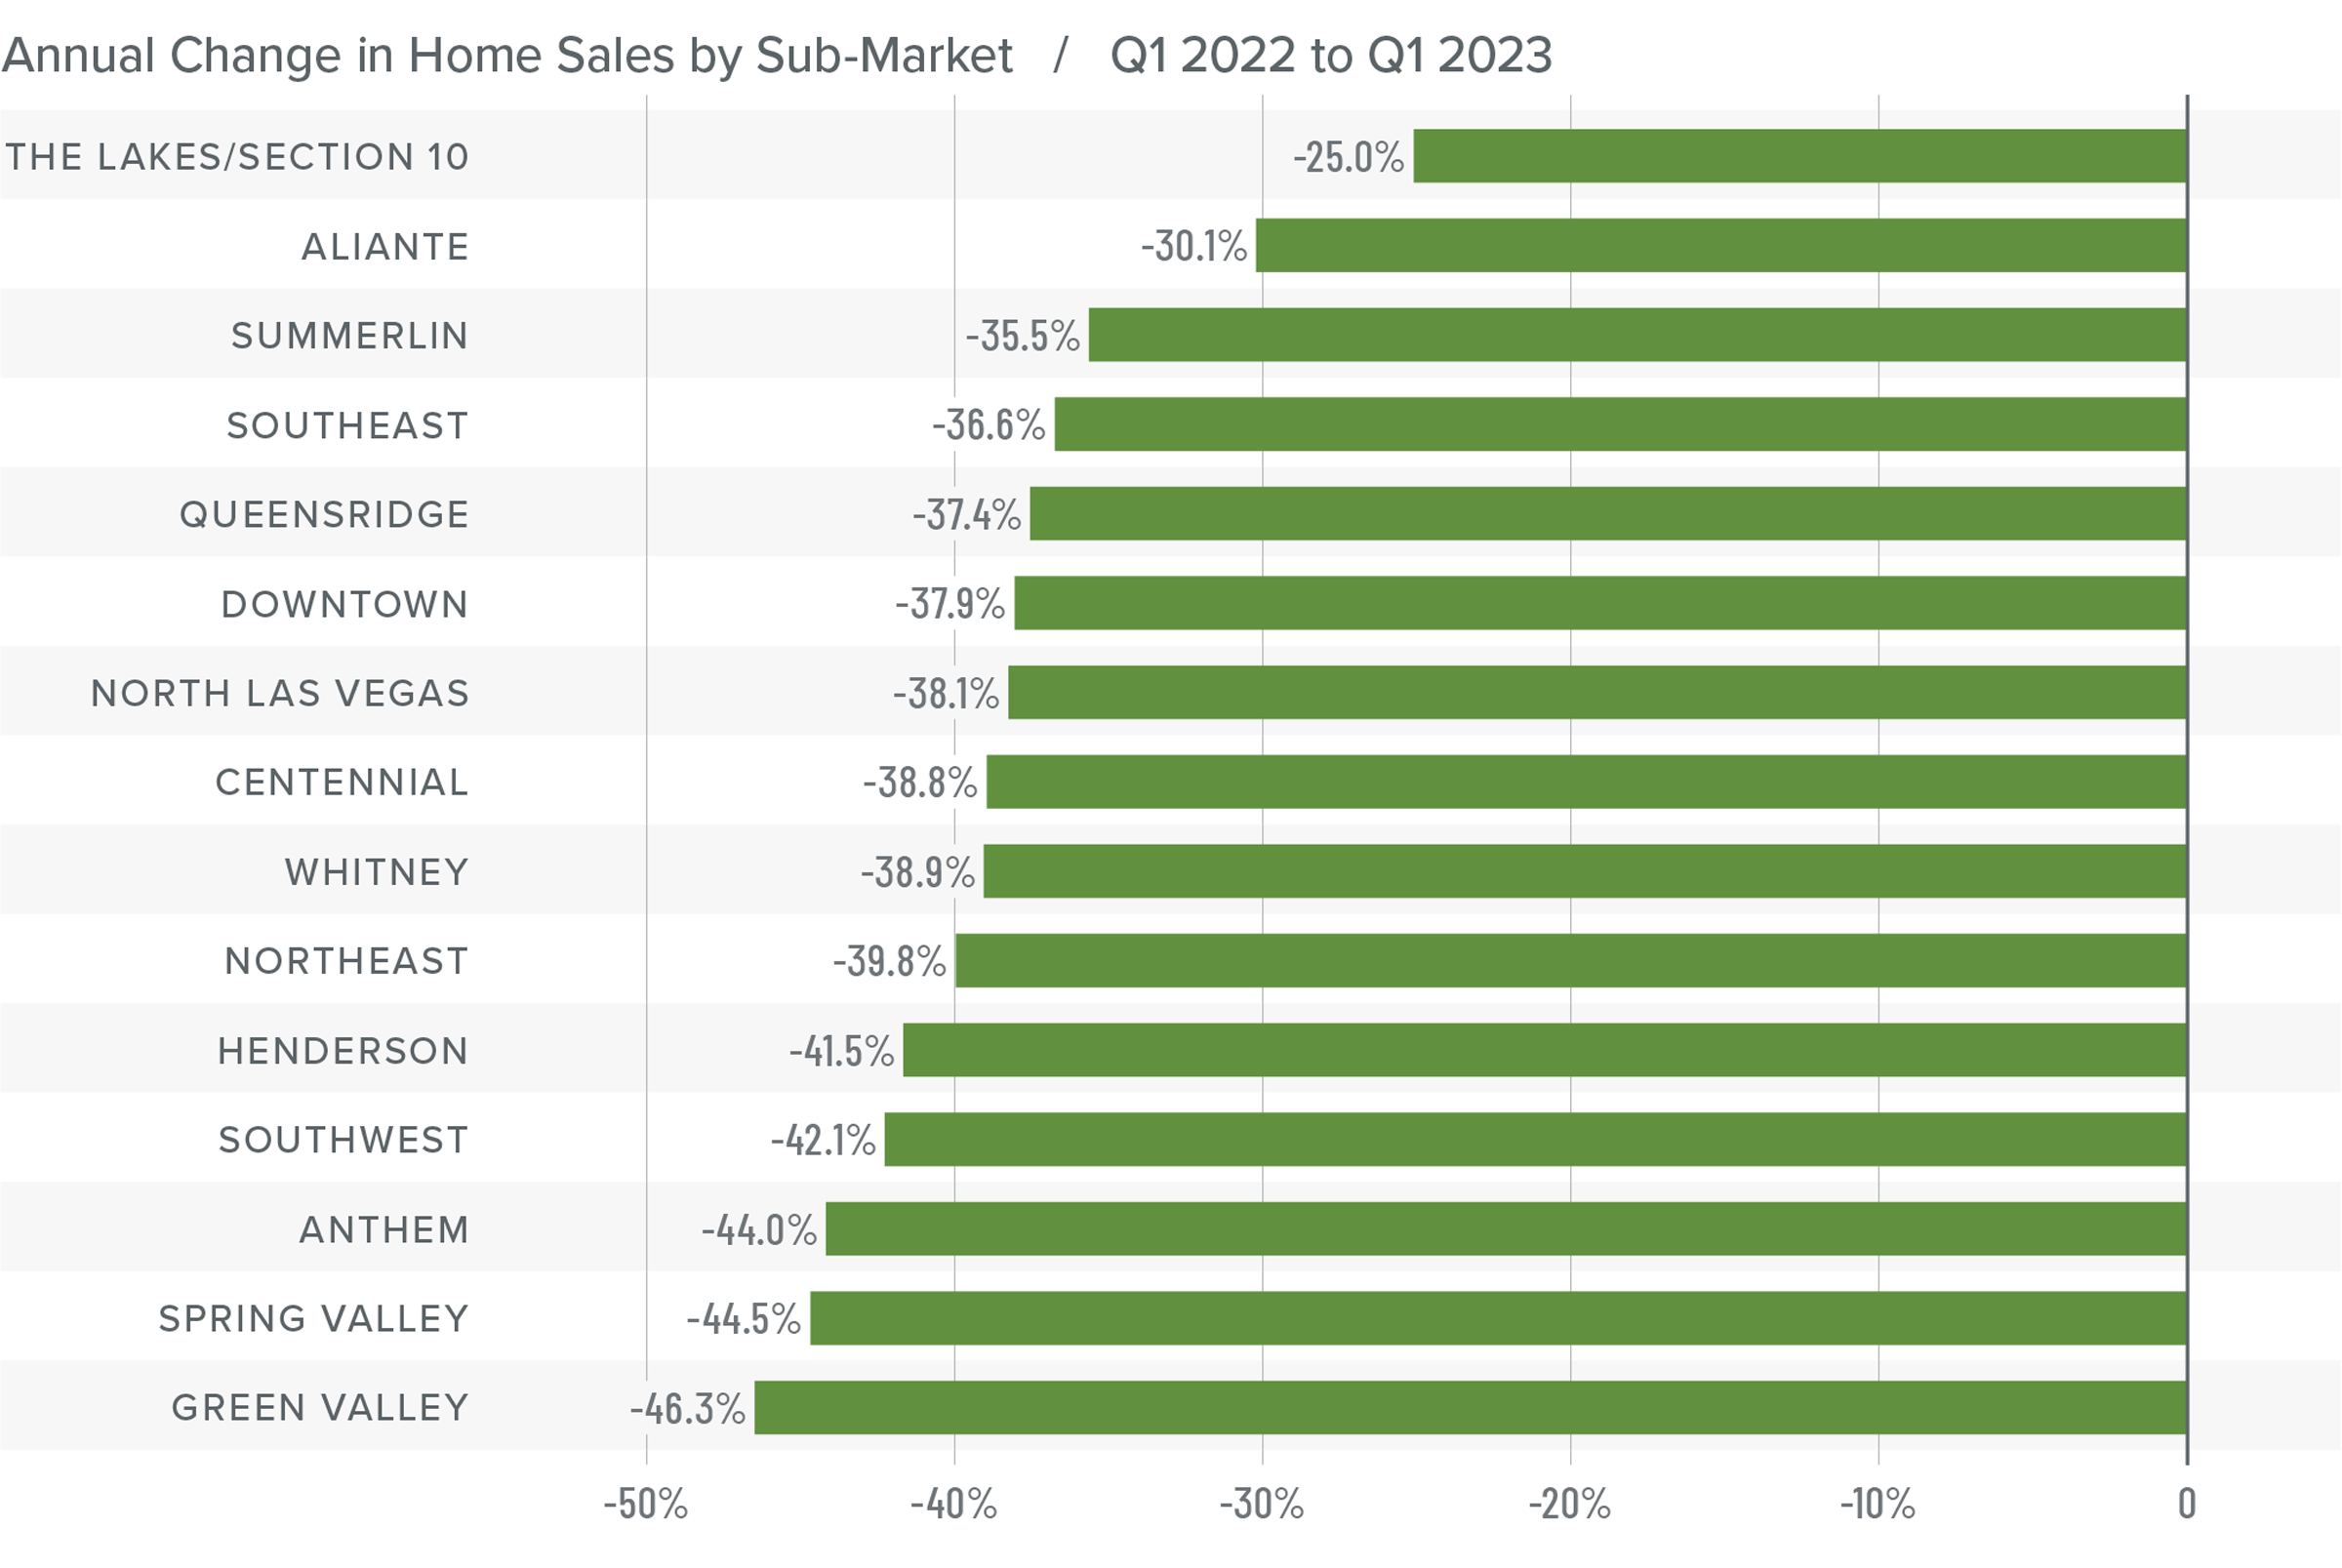
Nevada Home Sales
❱ A total of 5,537 homes sold in the first quarter of the year, which was a drop of 39.4% compared to the same period in 2022. Sales were up 12% from the fourth quarter of last year.
❱ Year over year, sales fell significantly in every neighborhood covered by this report. Compared to the fourth quarter of 2022, sales rose in every neighborhood except Green Valley, where there was a very modest decline.
❱ Particularly impressive was the fact that sales rose while the average number of homes for sale fell more than 32%. This can happen given the higher inventory levels we saw in the fourth quarter, but it is impressive all the same.
❱ Pending sales, which are an indicator of future closings, rose 45.4% compared to the fourth quarter, suggesting that the market may see further growth in sales in the second quarter.
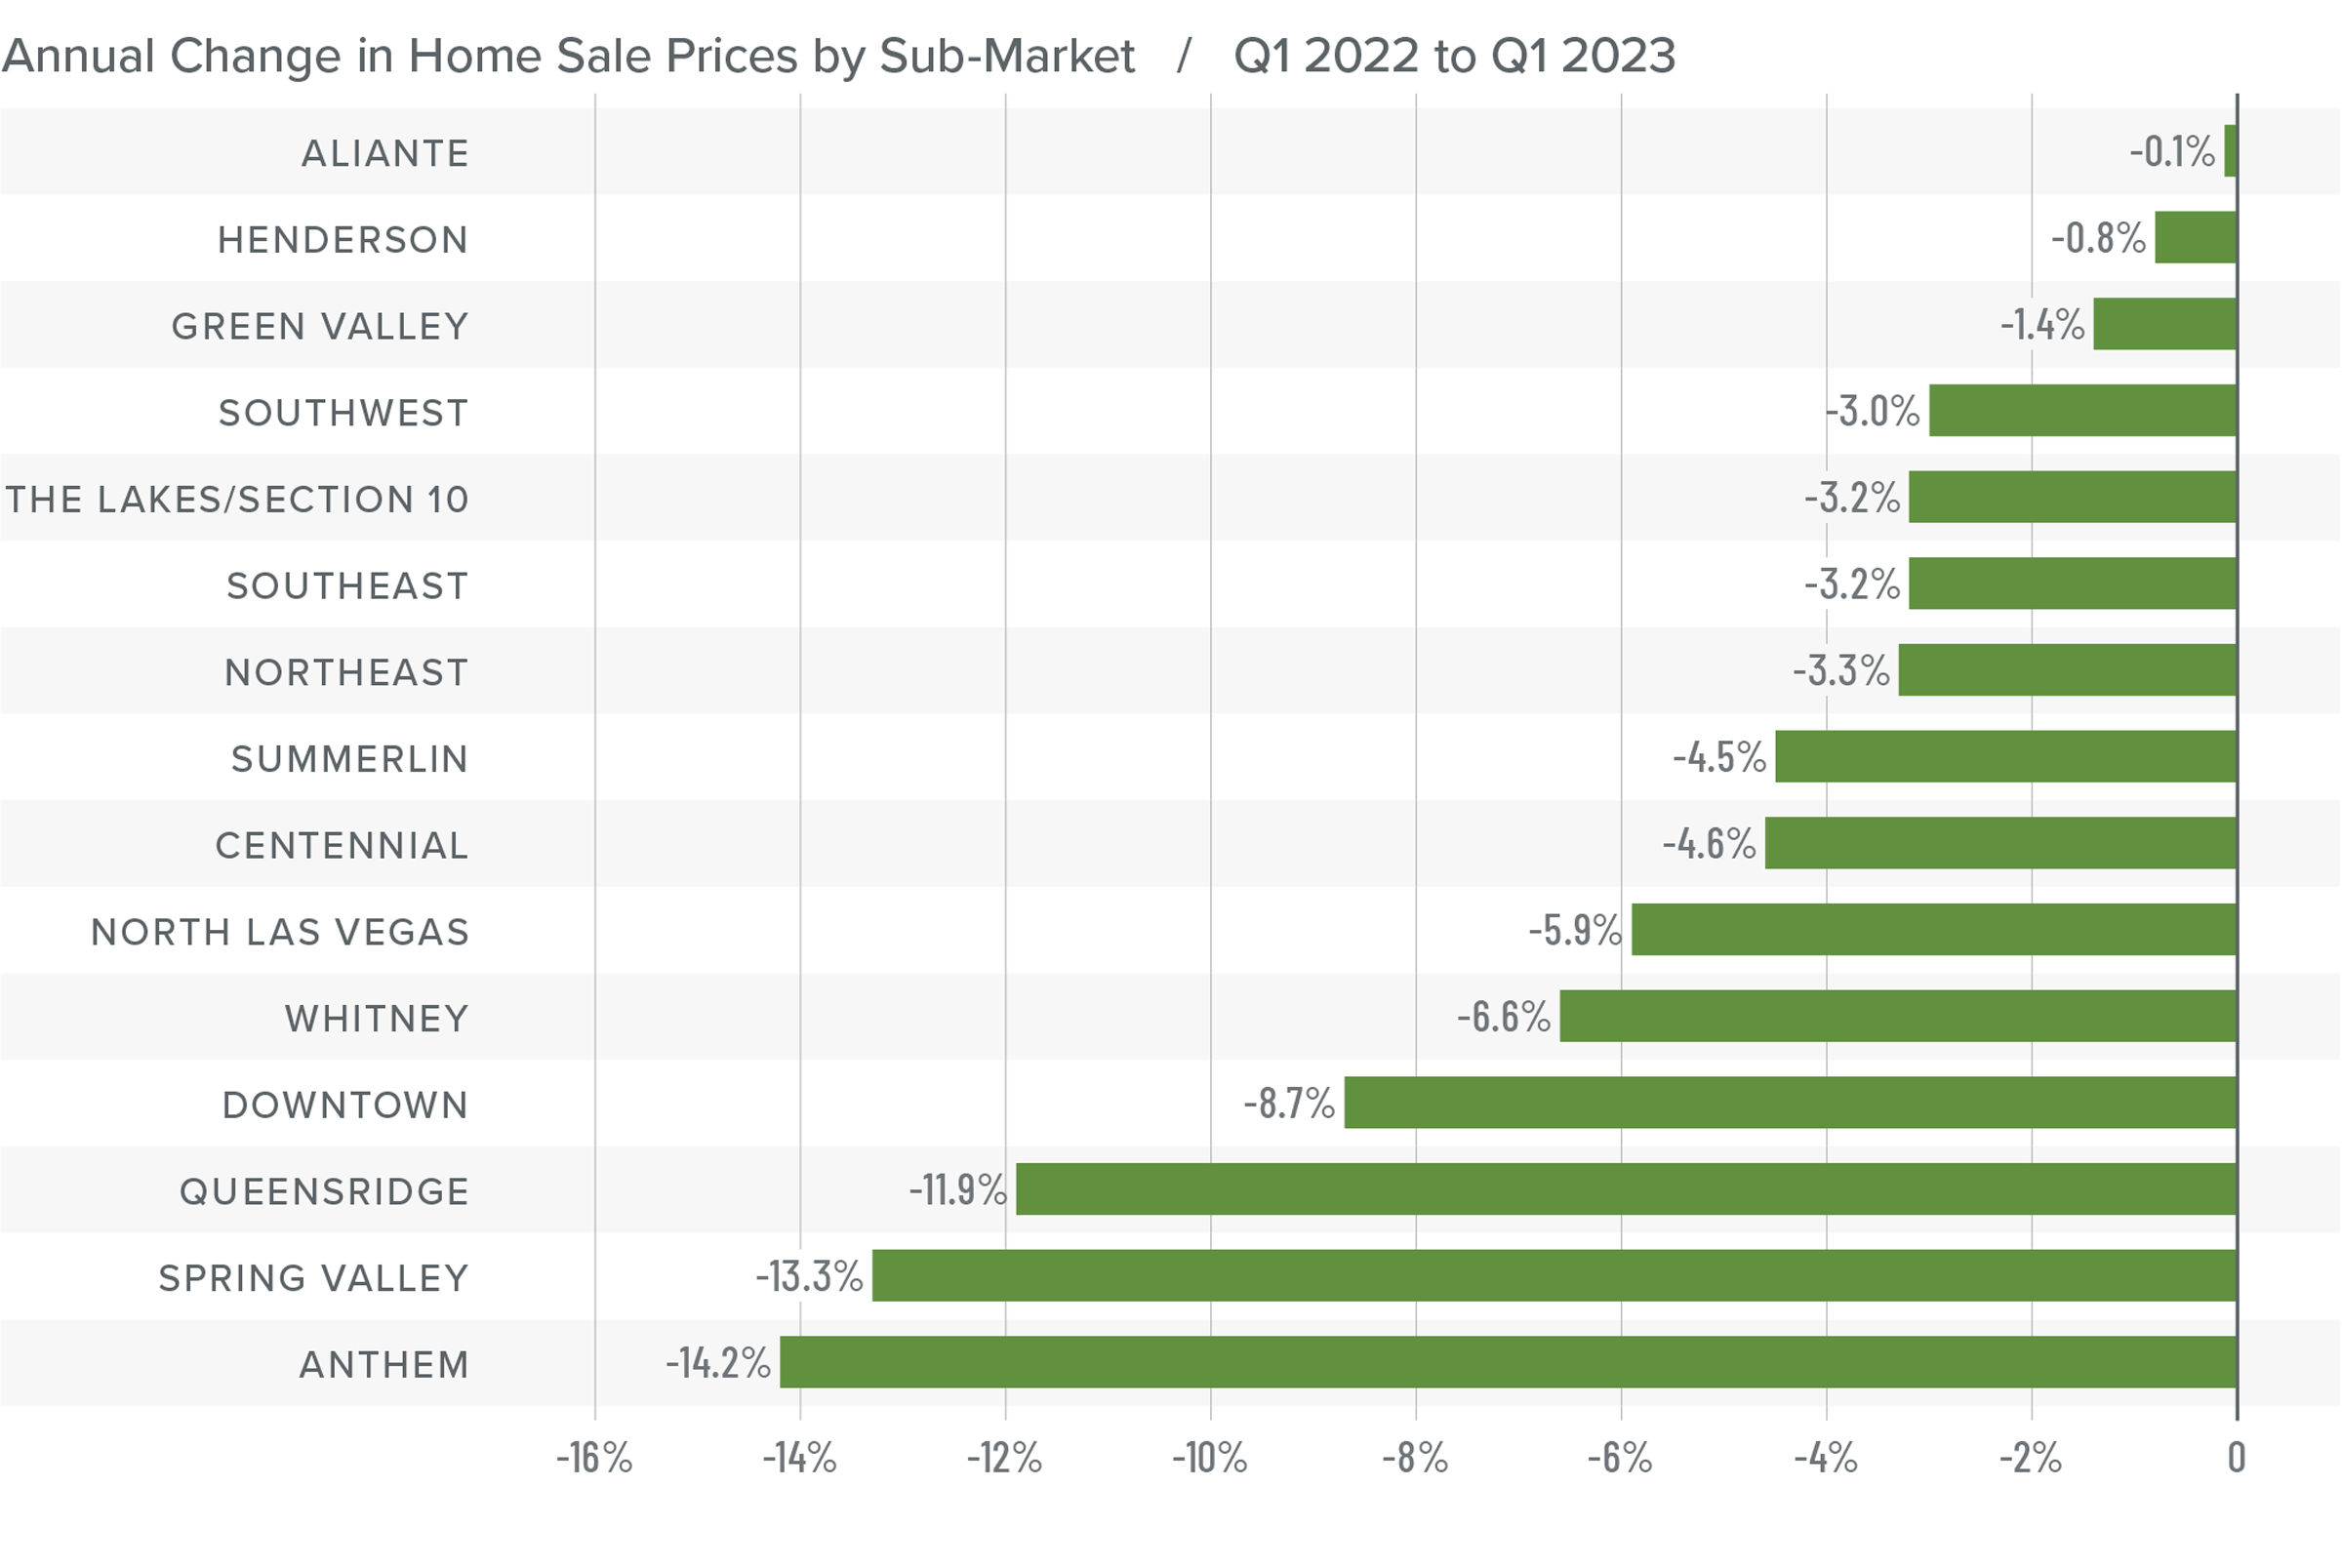
Nevada Home Prices
❱ If the level of sales activity was a surprise, prices decreasing by 7.2% from the first quarter of 2022 and 3.9% from the fourth quarter should make things clear: buyers were making deals.
❱ Listing prices, which are a leading indicator of the market, fell 3.9% from the final quarter of 2022. The market is clearly responding to higher financing costs. However, not all markets are the same. In Southwest Las Vegas, Summerlin, Anthem, Henderson, and The Lakes/Section 10, median listing prices rose quite significantly from the fourth quarter of 2022.
❱ Year over year, prices fell across the board. Compared to the fourth quarter of 2022, six neighborhoods saw higher prices. These were Centennial, Green Valley, The Lakes/Section 10, Southeast Las Vegas, Spring Valley, and Whitney.
❱ Nobody should be surprised to see prices fall given the rapid pace of appreciation through the pandemic period. It’s a necessary adjustment that will end later this year, at which point I expect prices to start rising again, though at a significantly slower pace.
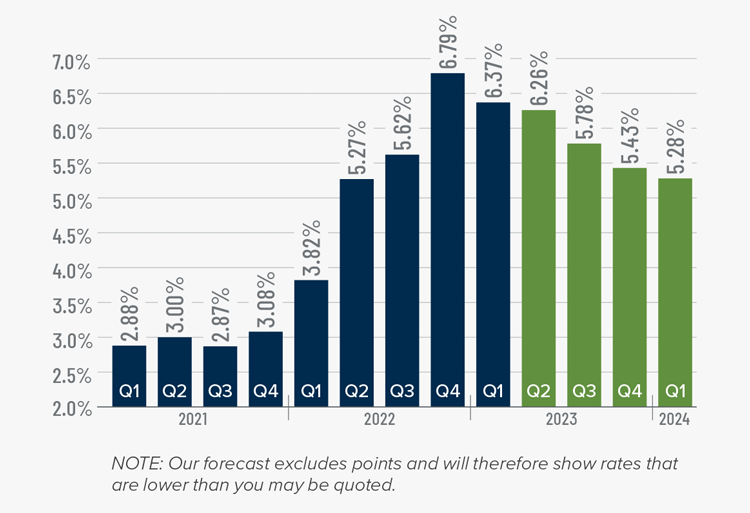
Mortgage Rates
Rates in the first quarter of 2023 were far less volatile than last year, even with the brief but significant impact of early March’s banking crisis. It appears that buyers are jumping in when rates dip, which was the case in mid-January and again in early February.
Even with the March Consumer Price Index report showing inflation slowing, I still expect the Federal Reserve to raise short-term rates one more time following their May meeting before pausing rate increases. This should be the catalyst that allows mortgage rates to start trending lower at a more consistent pace than we have seen so far this year. My current forecast is that rates will continue to move lower with occasional spikes, and that they will hold below 6% in the second half of this year.
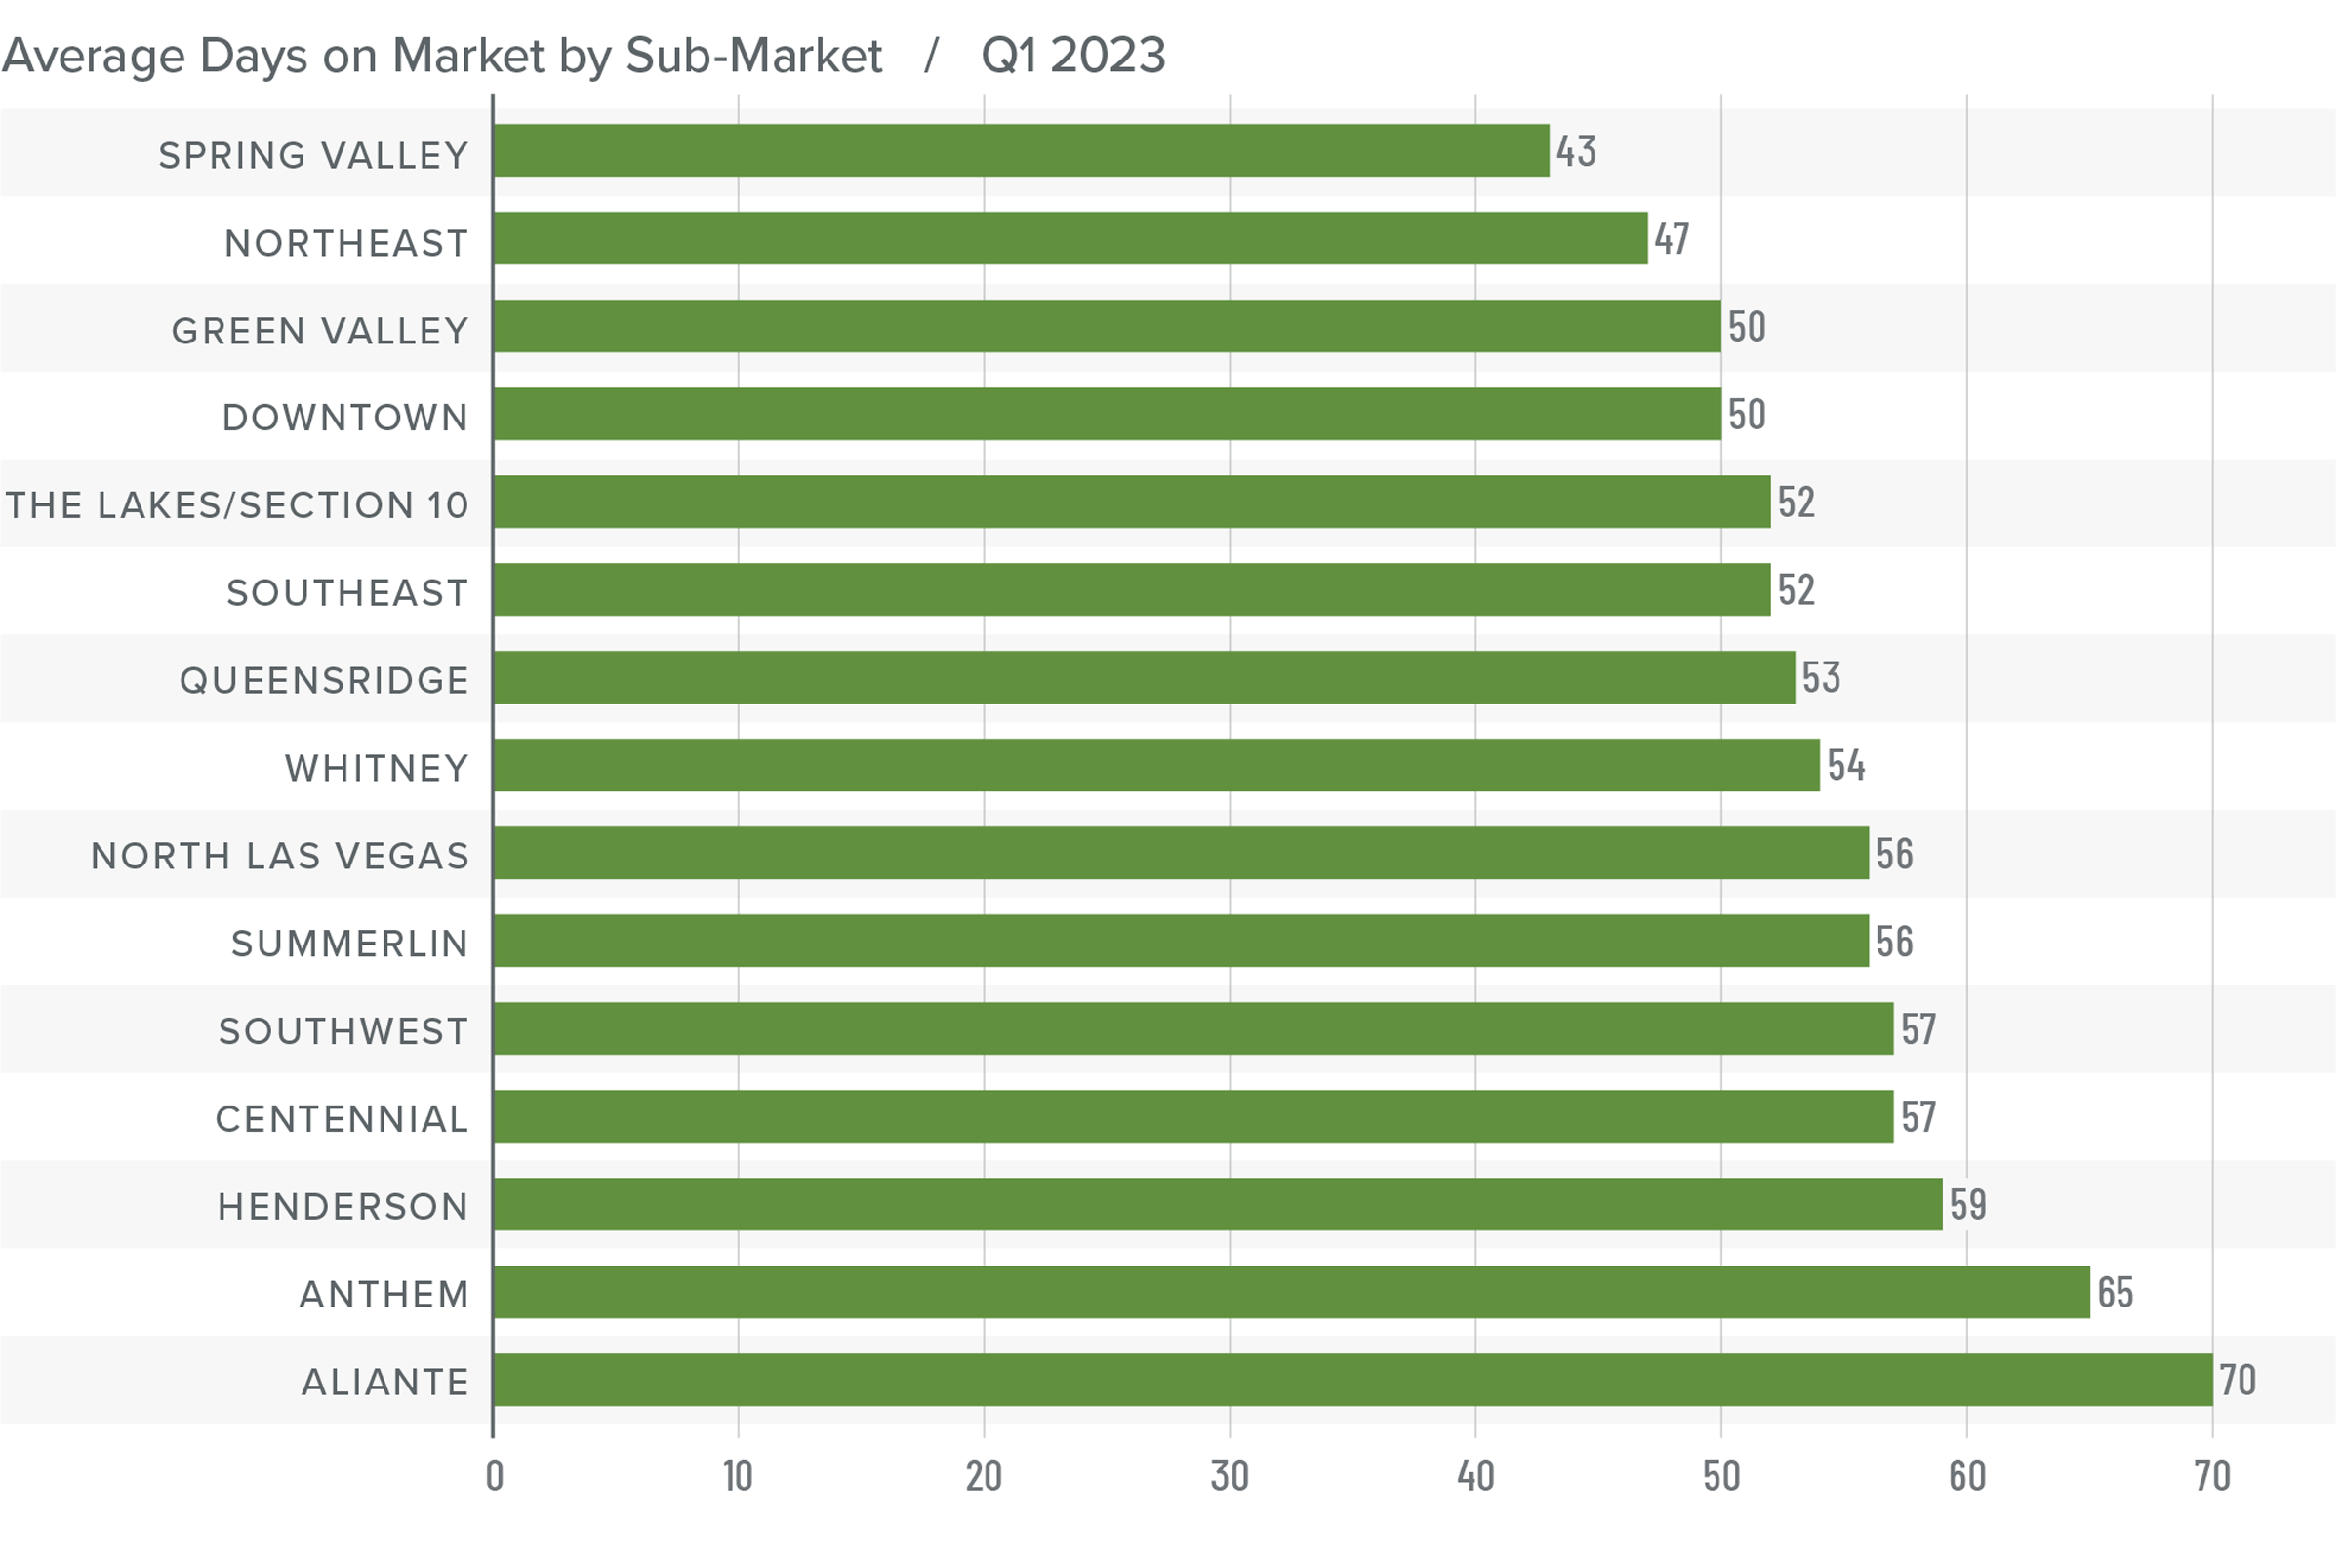
Nevada Days on Market
❱ The average time it took to sell a home in the region rose 32 days compared to the first quarter of 2022.
❱ It took an average of 55 days to sell a home in the quarter, which was 12 days longer than it took in the final quarter of 2022.
❱ Days on market rose in all neighborhoods compared to both the same period in 2022 and the fourth quarter.
❱ Even with prices pulling back in many markets, buyers were still taking their time and, possibly, waiting to take advantage of the dips in mortgage rates that occurred in the quarter.
Conclusions
This speedometer reflects the state of the region’s real estate market using housing inventory, price gains, home sales, interest rates, and larger economic factors.
In last quarter’s Gardner Report, I suggested that a price ceiling had been reached in the Las Vegas market. That forecast appears to have been correct. Compared to the fourth quarter of 2022, lower sale prices, longer days on market, and lower listing prices have benefitted home buyers, and it appears they have been taking advantage of the situation. That said, they’re not having it all their own way. Lower inventory levels, higher pending and closed sales, and higher absorption rates of homes that are on the market indicate that home sellers are not completely defeated.
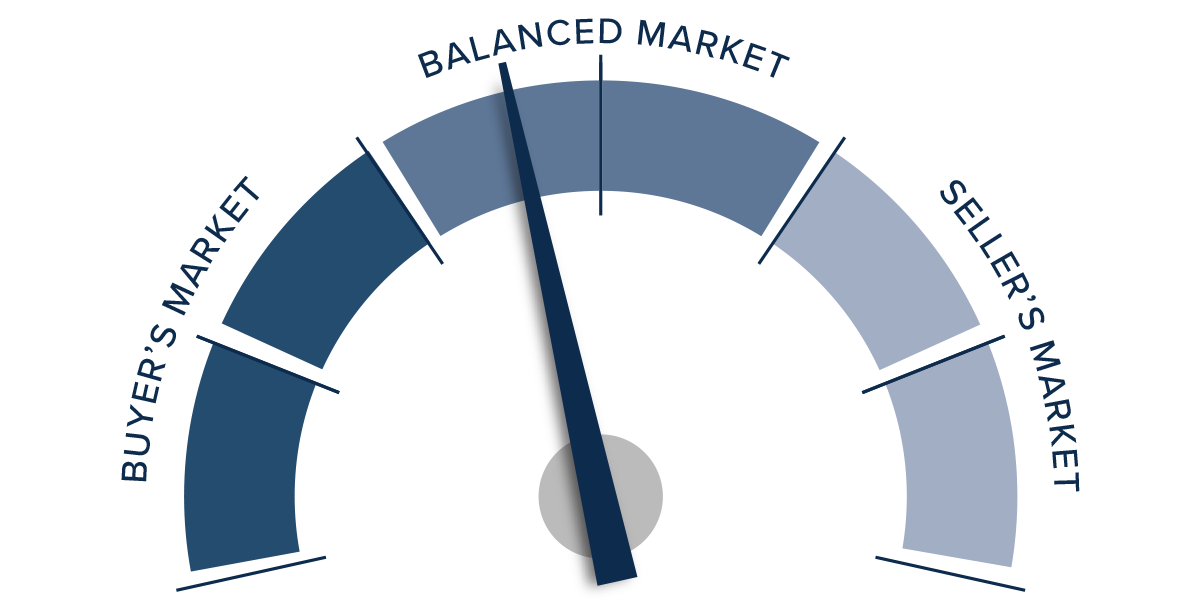
The price correction the market is experiencing was necessary to return to some sense of balance. I expect home prices will pull back a bit further before they start to stabilize this summer. At that point, prices should trend higher again, but at a far more modest pace than during the pandemic period. Given all these factors, I am leaving the needle in neutral territory but leaning a bit toward buyers, who still have a modestly better hand.
About Matthew Gardner

As Chief Economist for Windermere Real Estate, Matthew Gardner is responsible for analyzing and interpreting economic data and its impact on the real estate market on both a local and national level. Matthew has over 30 years of professional experience both in the U.S. and U.K.
In addition to his day-to-day responsibilities, Matthew sits on the Washington State Governors Council of Economic Advisors; chairs the Board of Trustees at the Washington Center for Real Estate Research at the University of Washington; and is an Advisory Board Member at the Runstad Center for Real Estate Studies at the University of Washington where he also lectures in real estate economics.
")


