
 Facebook
 X
X
 Pinterest
 Copy Link

The following analysis of select Maui real estate markets is provided by Windermere Real Estate Chief Economist Matthew Gardner. We hope that this information may assist you with making better-informed real estate decisions. For further information about the housing market in your area, please don’t hesitate to contact your Windermere Real Estate agent.
Regional Economic Overview
I mentioned in the first quarter Gardner Report that Maui’s job recovery, which was doing well in the fall of 2020, had started to lose steam. I am afraid this trend continued through the second quarter. Maui added 1,050 jobs in the second quarter, down from 1,100 in the first quarter and significantly lower than the 11,000 jobs that returned in the final quarter of 2020. The Islands’ economic recovery remains fragile. As of early July, travel restrictions have been relaxed for some fully vaccinated travelers. Hopefully this will bring more visitors, which will certainly help the labor market. As of the end of the second quarter, Maui has recovered 13,600 of the 28,850 jobs lost due to COVID-19. There is a long way to go, and the pace of improvement may face additional headwinds with the rise of the Delta and Lambda variants of COVID-19. Only time will tell. Maui’s unemployment rate remains elevated at 10.9% in June, down from 12.7% in March. The state unemployment rate was 7.7% in June, down from 9.1% in March.
maui, hawaii Home Sales
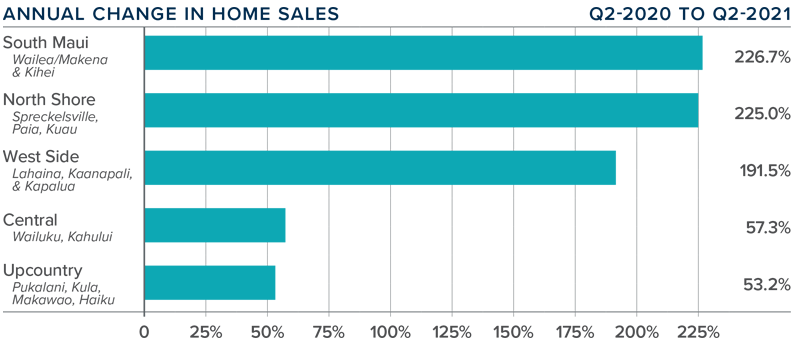
❱ In the second quarter, 879 homes were sold, a huge increase of 146.2% compared to a year ago when COVID-19 was in full force. Sales were up by a very solid 28.5% compared to the first quarter of this year.
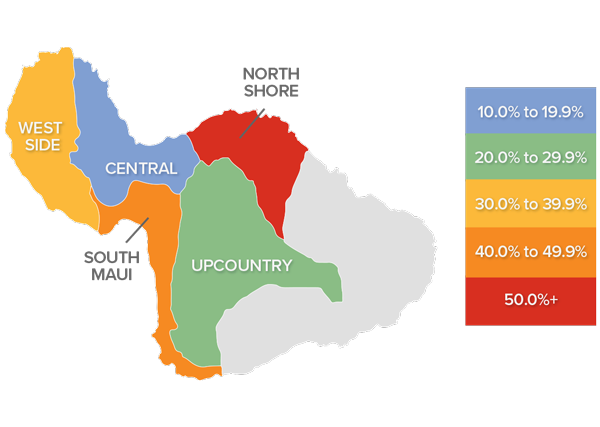
❱ Closed home sales rose across the board, with very large increases in the South Maui, North Shore, and Westside neighborhoods. It’s also worth noting that closed sales were also higher across the board compared to the first quarter of this year.
❱ The number of homes for sale remains woefully inadequate to meet demand, with the average number of listings down 58.3% compared to a year ago and 39.1% lower than in the first quarter of 2021.
❱ Pending home sales dropped 19.7% compared to the first quarter, suggesting that closings in the third quarter may not be as impressive as this one.
maui, hawaii Home Prices
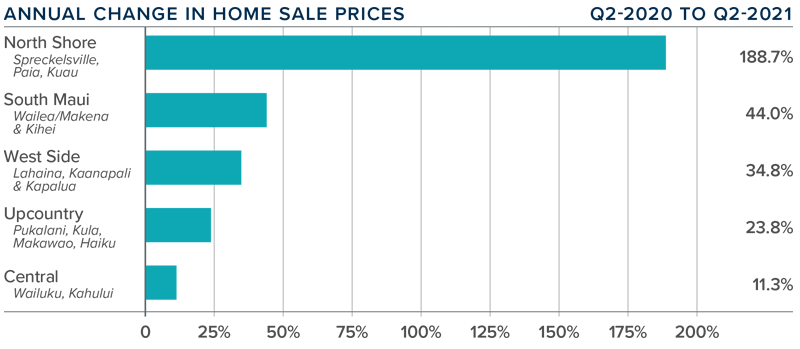
❱ The average home price on the island rose 41.6% year over year to $1.38 million and was 11% higher than in the first quarter of the year.
❱ Affordability issues persist, but with financing rates still remarkably favorable and persistently low levels of inventory, I still think prices will continue to rise at above-average rates as we move through the second half of 2021.
❱ All markets saw significant increases in year-over-year price growth, and all but one (North Shore) saw higher prices than in the first quarter.
❱ Limited inventory has created bullish sellers and rising prices, but the market is showing some signs of resistance. Clearly, the pace of price growth is unsustainable, and this will lead to a softening in appreciation—the question is when.
Days on Market
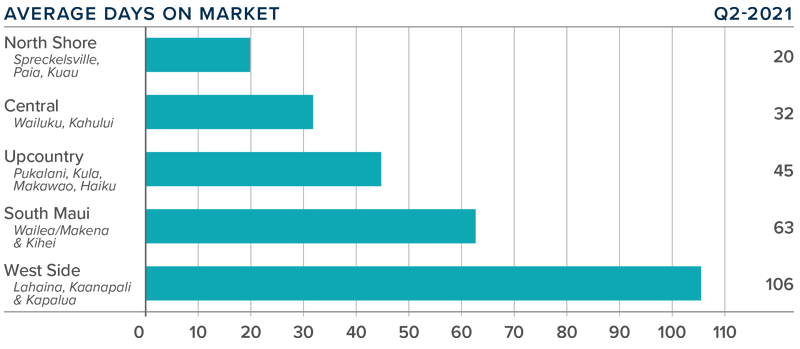
❱ The average number of days it took to sell a home on Maui dropped 16 days compared to the second quarter of 2020.
❱ The length of time it took to sell a home dropped in the Central, North Shore, and Upcountry market areas compared to a year ago, but rose in South Maui and the Westside.
❱ It took an average of 53 days to sell a home, with transactions occurring the fastest in the North Shore area and slowest on the Westside.
❱ When compared to the first quarter, market time dropped in all areas covered in this report.
Conclusions
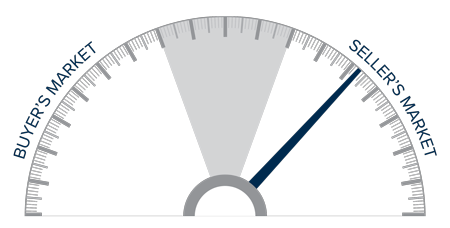
This speedometer reflects the state of the region’s real estate market using housing inventory, price gains, home sales, interest rates, and larger economic factors.
Without a doubt, supply levels are not meeting the very strong demand. The modest uptick in mortgage rates in the first quarter was not maintained and rates have lowered again, which undoubtedly has influenced rising demand.
Even with the economic recovery stalling—and COVID-19 cases spiking again—the housing market is still on solid footing. I would be very surprised to see a significant uptick in the number of homes for sale in the coming months, which will clearly favor home sellers. Given these factors, I am moving the needle more in their favor.
About Matthew Gardner

As Chief Economist for Windermere Real Estate, Matthew Gardner is responsible for analyzing and interpreting economic data and its impact on the real estate market on both a local and national level. Matthew has over 30 years of professional experience both in the U.S. and U.K.
In addition to his day-to-day responsibilities, Matthew sits on the Washington State Governors Council of Economic Advisors; chairs the Board of Trustees at the Washington Center for Real Estate Research at the University of Washington; and is an Advisory Board Member at the Runstad Center for Real Estate Studies at the University of Washington where he also lectures in real estate economics.
")


