
 Facebook
 X
X
 Pinterest
 Copy Link

The following analysis of the Big Island real estate market is provided by Windermere Real Estate Chief Economist Matthew Gardner. We hope that this information may assist you with making better-informed real estate decisions. For further information about the housing market in your area, please don’t hesitate to contact your Windermere Real Estate agent.
Regional Economic Overview
Job recovery on the Big Island remains stalled, with employment levels down 100 jobs from the end of the second quarter, but still up 4,823 versus a year ago. This is likely a function of the governor’s announcement discouraging tourists from visiting as COVID-19 cases in the state started to rise again. At the end of the third quarter, Hawaii County had recovered 6,574 of the more than 17,000 jobs that were lost due to COVID-19. With employment levels still down more than 10,600 from the pre-pandemic peak, there is much work to be done. New COVID-19 cases have started to slow, which may allow for more robust job growth in the final quarter of this year, but we likely will not see a full job recovery until 2022 at the earliest. The unemployment rate on the Big Island remained elevated in September, with 6.3% of the workforce still without jobs, but this is still considerably better than the 22% rate in April of last year. The state unemployment rate was 6.6% in September, down from 7.7% at the end of the second quarter.
big island of hawaii Home Sales
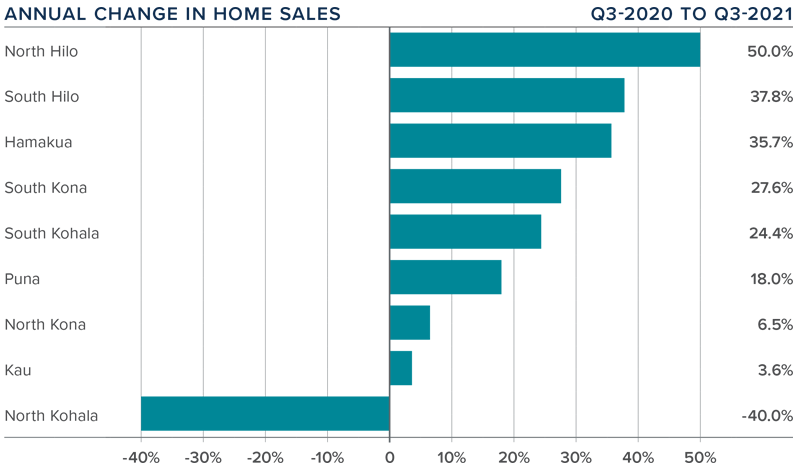
❱ In the third quarter, 1,037 homes were sold on the Big Island. This was an increase of 15.7% from the same quarter a year ago, but 12.8% lower than in the second quarter of this year.
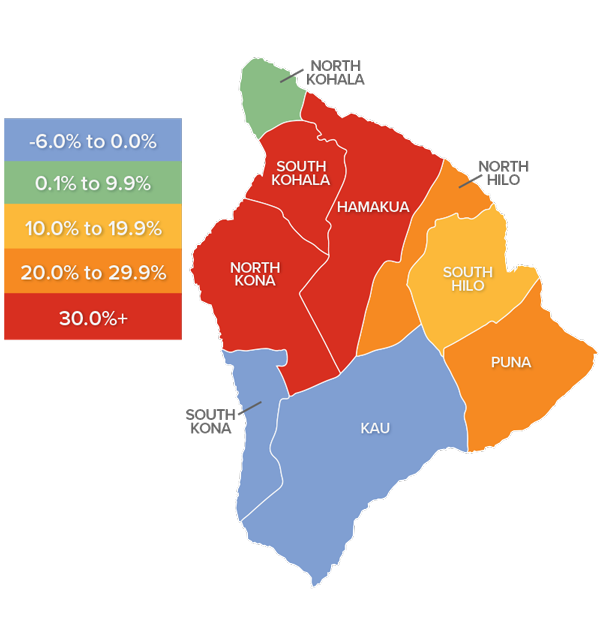
❱ Year-over-year, sales rose in all areas other than North Kohala, but this is a very small area that can see significant swings. Also of note was that six of the remaining eight markets saw sales rise by double digits compared to a year ago. When comparing second and third quarters, sales rose in all areas other than North and South Kohala, North Kona, and Kau.
❱ It’s noteworthy that sales pulled back even as the number of homes rose. The average number of homes on the market in the third quarter was 3.2% higher than in the second quarter, suggesting that some of the heat may be coming off the market.
❱ Pending home sales fell 13.9% compared to the second quarter of the year, which may lead total sales to drop modestly in the final quarter of the year.
big island of hawaii Home Prices
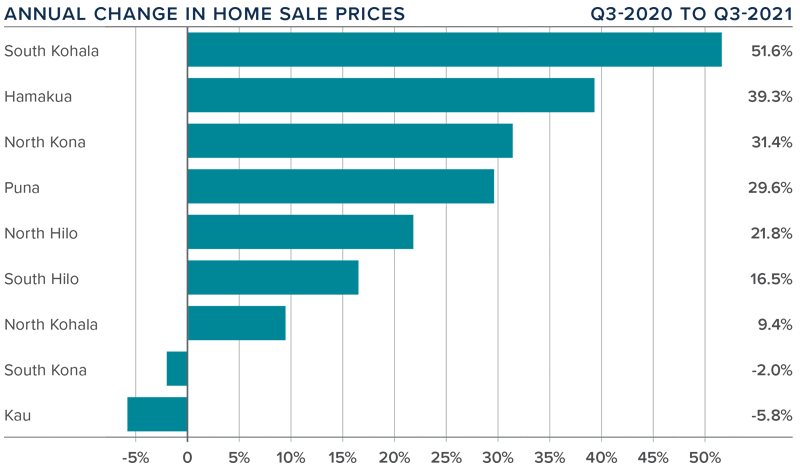
❱ The average home price on the Island rose a solid 29.1% year over year to $810,810, but prices fell 8.4% compared to the second quarter of 2021.
❱ Versus the second quarter, sale prices were up in Puna, South Hilo, Hamakua, and South Kohala but lower in all the other areas.
❱ Prices rose by double digits in six of the market areas covered by this report but fell in South Kona and Kau.
❱ I mentioned in the second quarter Gardner Report that I was seeing price growth showing some signs of strain, which appears to have been an accurate statement.
Days on Market
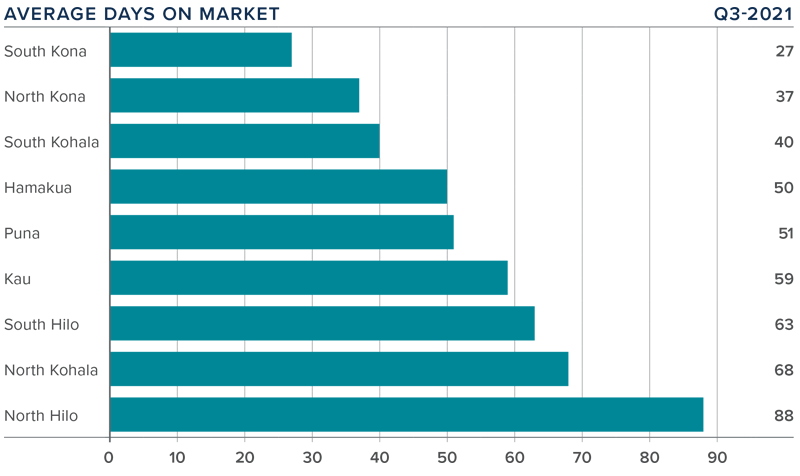
❱ The average time it took to sell a home on the Big Island dropped 52 days compared to the third quarter of 2020.
❱ The amount of time it took to sell a home dropped across the board compared to a year ago.
❱ It took an average of 54 days to sell a home, with the fastest sales occurring in South Kona and the slowest in North Hilo.
❱ It took 24 fewer days to sell a home in the third quarter of 2021 than it did in the second, with all markets showing market time dropping.
Conclusions

This speedometer reflects the state of the region’s real estate market using housing inventory, price gains, home sales, interest rates, and larger economic factors.
The number of homes for sale ticked higher, while both sales and prices ticked lower—all of which favor home buyers. That said, market time dropped, and interest rates remain very low, which favors home sellers. If inventory levels continue to trend higher, this may further impact prices and make the market more competitive for sellers. As such, I have moved the needle a little more toward buyers but overall, it remains a seller’s market.
About Matthew Gardner

As Chief Economist for Windermere Real Estate, Matthew Gardner is responsible for analyzing and interpreting economic data and its impact on the real estate market on both a local and national level. Matthew has over 30 years of professional experience both in the U.S. and U.K.
In addition to his day-to-day responsibilities, Matthew sits on the Washington State Governors Council of Economic Advisors; chairs the Board of Trustees at the Washington Center for Real Estate Research at the University of Washington; and is an Advisory Board Member at the Runstad Center for Real Estate Studies at the University of Washington where he also lectures in real estate economics.
")


