
 Facebook
 X
X
 Pinterest
 Copy Link

The following analysis of the Big Island real estate market is provided by Windermere Real Estate Chief Economist Matthew Gardner. We hope that this information may assist you with making better-informed real estate decisions. For further information about the housing market in your area, please don’t hesitate to contact your Windermere Real Estate agent.
Regional Economic Overview
The Big Island saw a significant number of jobs return in the fall of 2020, but the momentum did not continue through the new year. In the first quarter, only 900 jobs returned—compared to the 7,500 jobs that returned in the fourth quarter. Clearly the economy remains in a fragile position and the area is anxiously waiting for tourists to return in greater numbers. The growth in the final quarter of 2020 was a result of relaxed travel restrictions, but rising infection rates on the mainland have led to more restrictions, which has likely impacted the number of jobs returning. Although the pace of job recovery has stalled, it’s worth noting that the island has recovered 12,650 of the 21,850 jobs that were lost due to the pandemic. The island’s unemployment rate remains elevated. It was 8.4% in March, down from 9.2% at the end of 2020. The state unemployment rate was 9% in March, down from 10.3% in December. All of the islands continue to suffer from slow economic growth due to the pandemic, but I remain hopeful that jobs will return, and the pace of recovery will pick up speed in the second half of the year.
big island of hawaii Home Sales
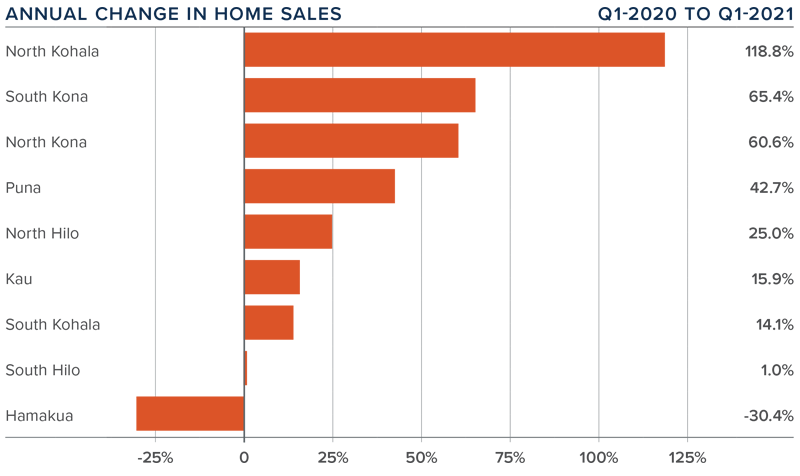
❱ In the first quarter of 2021, 1,110 homes sold on the Big Island, an increase of 35.5% compared to the first quarter of 2020, and 2.5% higher than in the final quarter of last year.
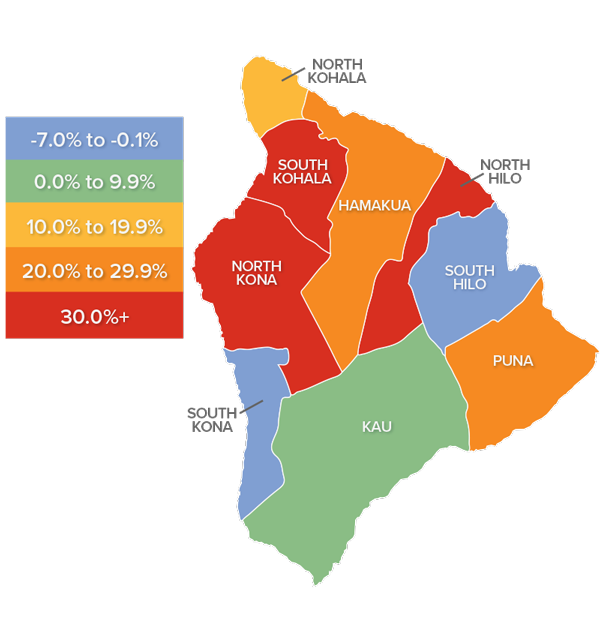
❱ Sales were higher in all markets other than Hamakua, where they dropped more than 30%. Sales in North Kohala more than doubled and several other areas saw significant increases in sales activity.
❱ The growth in sales came even with inventory levels 53.3% lower than a year ago and down 31.7% compared to last quarter.
❱ Pending home sales rose 15.9% compared to the final quarter of 2020, suggesting that closings in the second quarter will show further growth.
big island of hawaii Home Prices
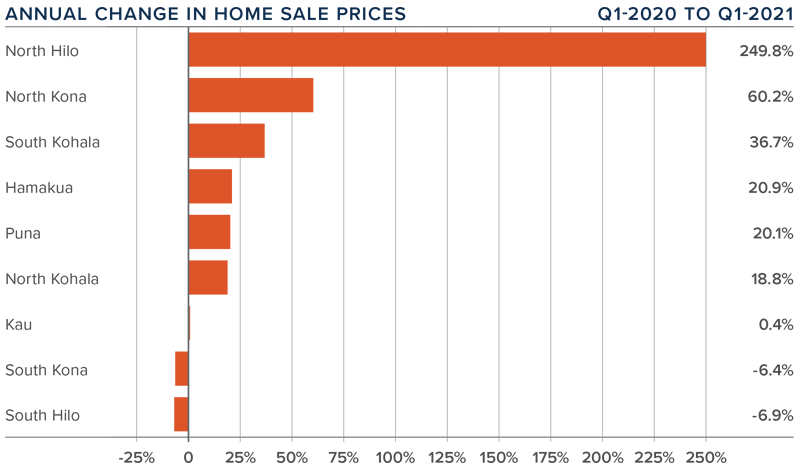
❱ The average home price on the island rose by a very impressive 41.7% year over year to $878,267. Prices were also 13.2% higher compared to the fourth quarter of 2020.
❱ Sale prices were lower in two markets compared to a year ago, but I do not see this as a trend that will continue.
❱ The substantial increase in prices was driven by significant price growth in North Hilo, where the average sale price rose from $248,000 to $866,000. Six additional markets saw prices increase by double-digits.
❱ After the events of 2020, the housing market—if not the job market—continues to recover admirably.
Days on Market
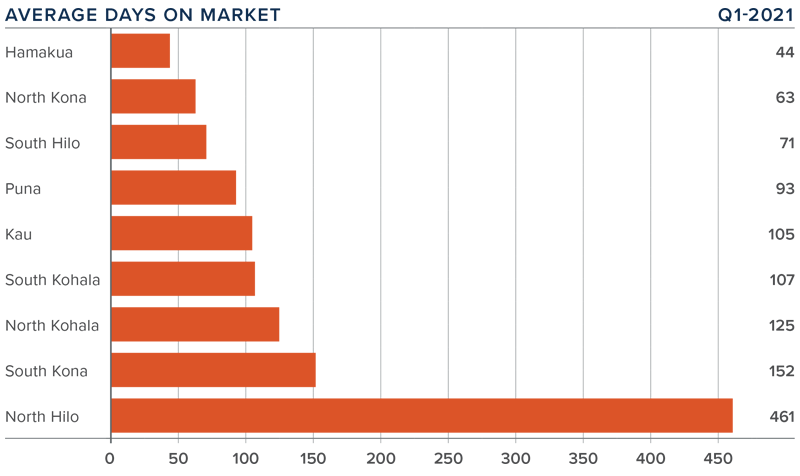
❱ The average time it took to sell a home on the Big Island rose 26 days compared to the first quarter of 2020.
❱ The amount of time it took to sell a home dropped in North Kohala, North Kona, Puna, South Hilo, Hamakua, and Kau, but rose in the other three markets.
❱ In the quarter, it took an average of 136 days to sell a home, with the fastest sales occurring in Hamakua and the slowest in North Hilo.
❱ It took 34 more days to sell a home in the first quarter of 2021 than in the prior quarter.
Conclusions

This speedometer reflects the state of the region’s real estate market using housing inventory, price gains, home sales, interest rates, and larger economic factors.
The Big Island housing market is unusual given rising sales and prices but longer days on market. As vaccines are more broadly distributed on the mainland—and in other countries that favor Hawaii real estate—I expect we will see more demand, which, in concert with persistently low levels of inventory, will favor home sellers.
The fundamentals of the market are solid, and even though mortgage rates have ticked higher, sellers continue to have the upper hand. Given these factors, I am moving the needle more in their favor.
About Matthew Gardner

As Chief Economist for Windermere Real Estate, Matthew Gardner is responsible for analyzing and interpreting economic data and its impact on the real estate market on both a local and national level. Matthew has over 30 years of professional experience both in the U.S. and U.K.
In addition to his day-to-day responsibilities, Matthew sits on the Washington State Governors Council of Economic Advisors; chairs the Board of Trustees at the Washington Center for Real Estate Research at the University of Washington; and is an Advisory Board Member at the Runstad Center for Real Estate Studies at the University of Washington where he also lectures in real estate economics.
")


