
 Facebook
 X
X
 Pinterest
 Copy Link

The following analysis of select counties of the Utah real estate market is provided by Windermere Real Estate Chief Economist Matthew Gardner. We hope that this information may assist you with making better-informed real estate decisions. For further information about the housing market in your area, please don’t hesitate to contact your Windermere Real Estate agent.
Regional Economic Overview
Although it slowed in the first quarter of 2023, employment growth has stabilized in Utah. The state added 52,400 jobs over the past 12 months, which represents an annual growth rate of 3.1%. The counties covered by this report added almost 33,000 new jobs over the past year, representing a growth rate of 2.4%. As we saw in the first quarter of the year, the fastest growing county was Summit, which had a 5.8% annual growth rate. The slowest was again Morgan County, where the job level rose 1.6%. Utah’s unemployment rate in May was 2.5%, up .03% from the level in the second quarter of 2022. At the county level, the lowest jobless rate was in Morgan County (1.8%) and the highest was in Weber County, where 2.5% of the workforce was without a job. In aggregate, the unemployment rate within the counties contained in this report was only 2.3%.
Utah Home Sales
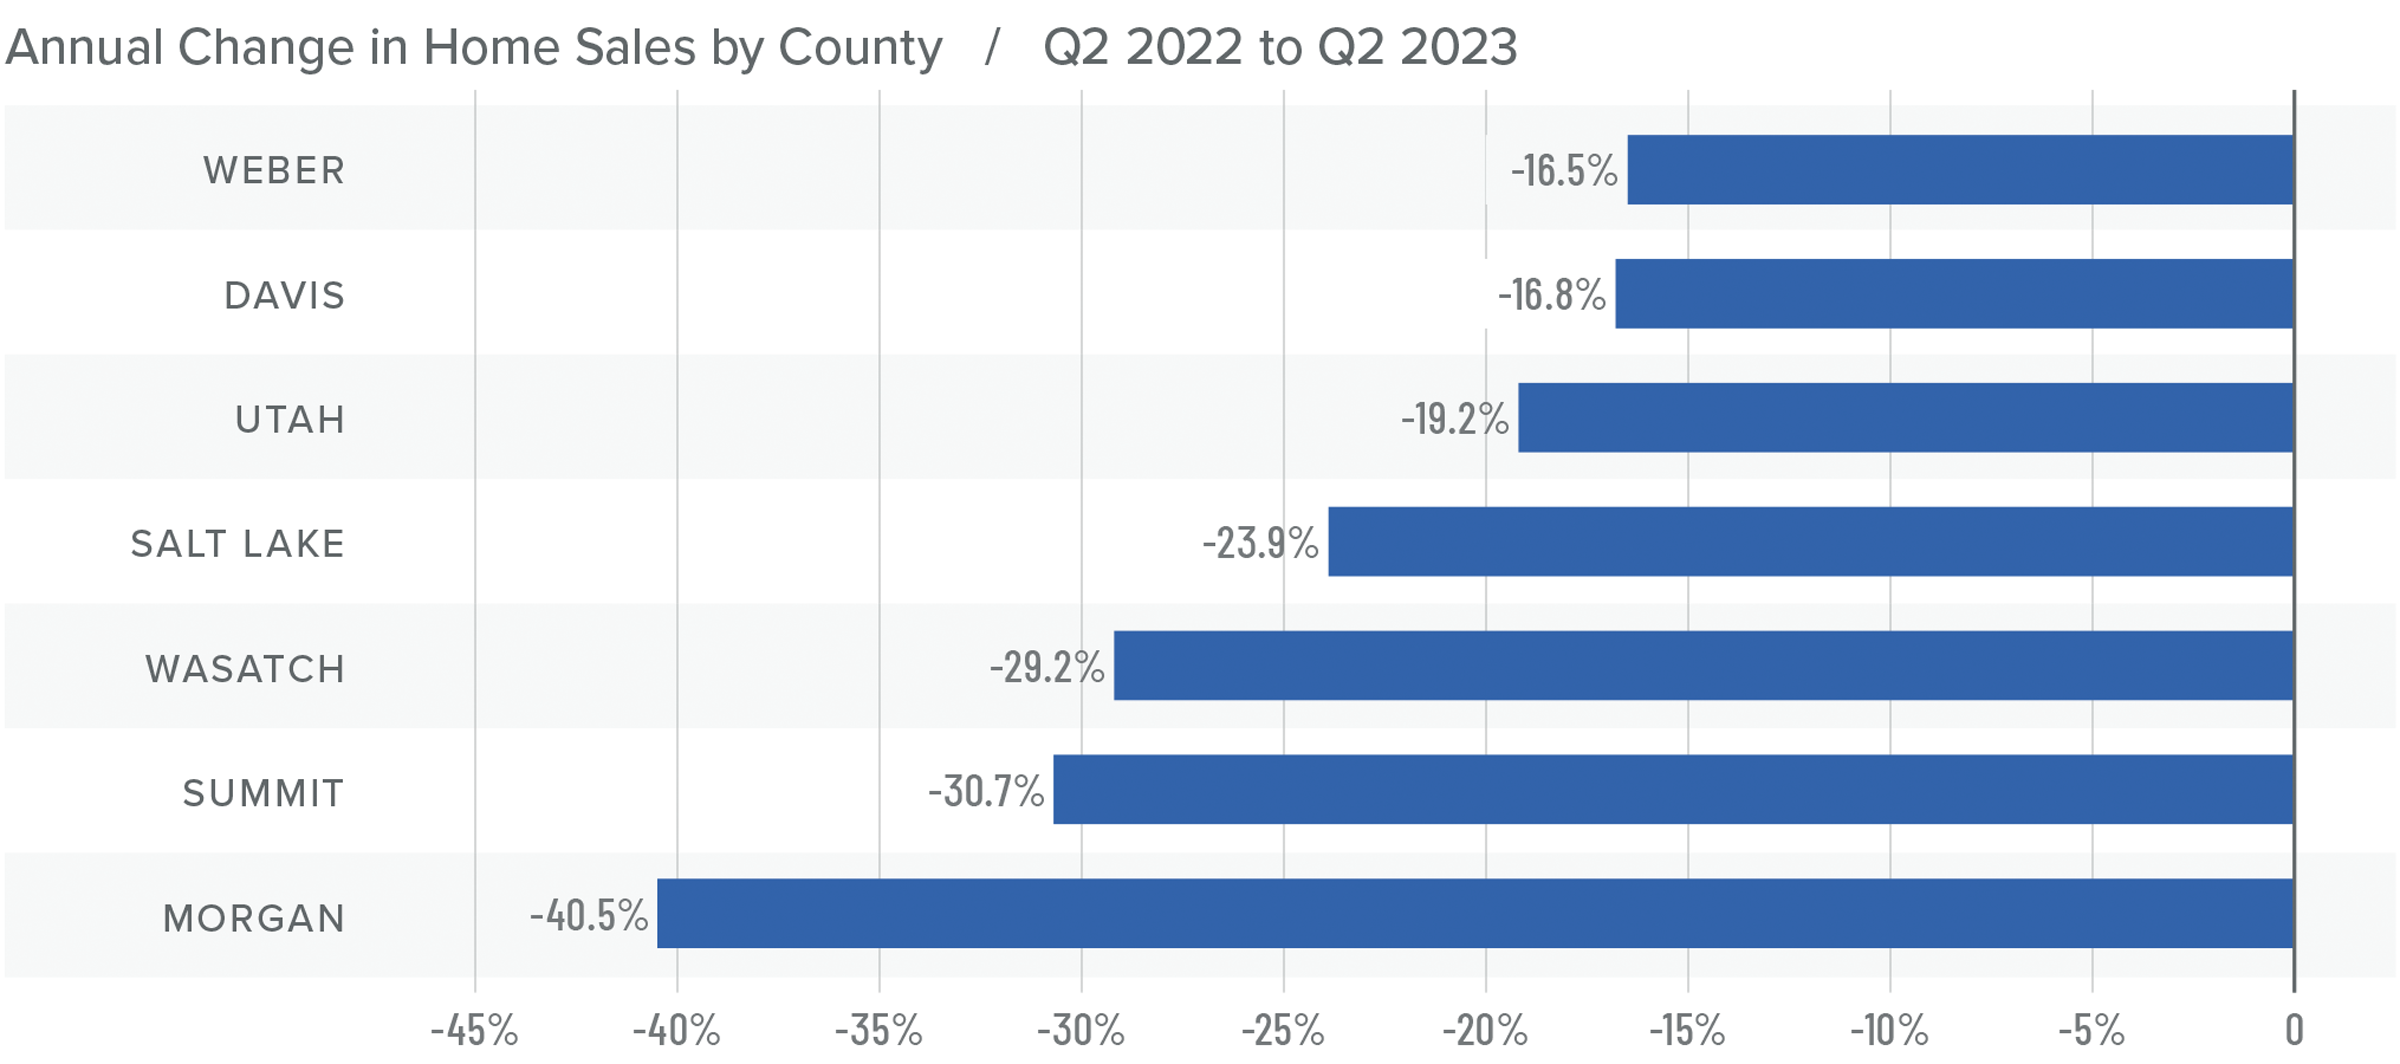
❱ In the second quarter, 6,939 homes were sold in the areas covered by this report. This was down 21% compared to the second quarter of 2022 but was 28.3% higher than in the first quarter of this year.
❱ Year over year, sales fell across the board. However, sales increased by double digits in every county covered by this report compared to the first quarter.
❱ It is quite likely that the higher number of homes sold compared to the previous quarter was a result of the impressive increase in the number of homes for sale. Inventory rose 12.6% over the first quarter.
❱ Pending sales rose 14.6% from the first quarter, suggesting that closings in the upcoming quarter will likely rise.
Utah Home Prices
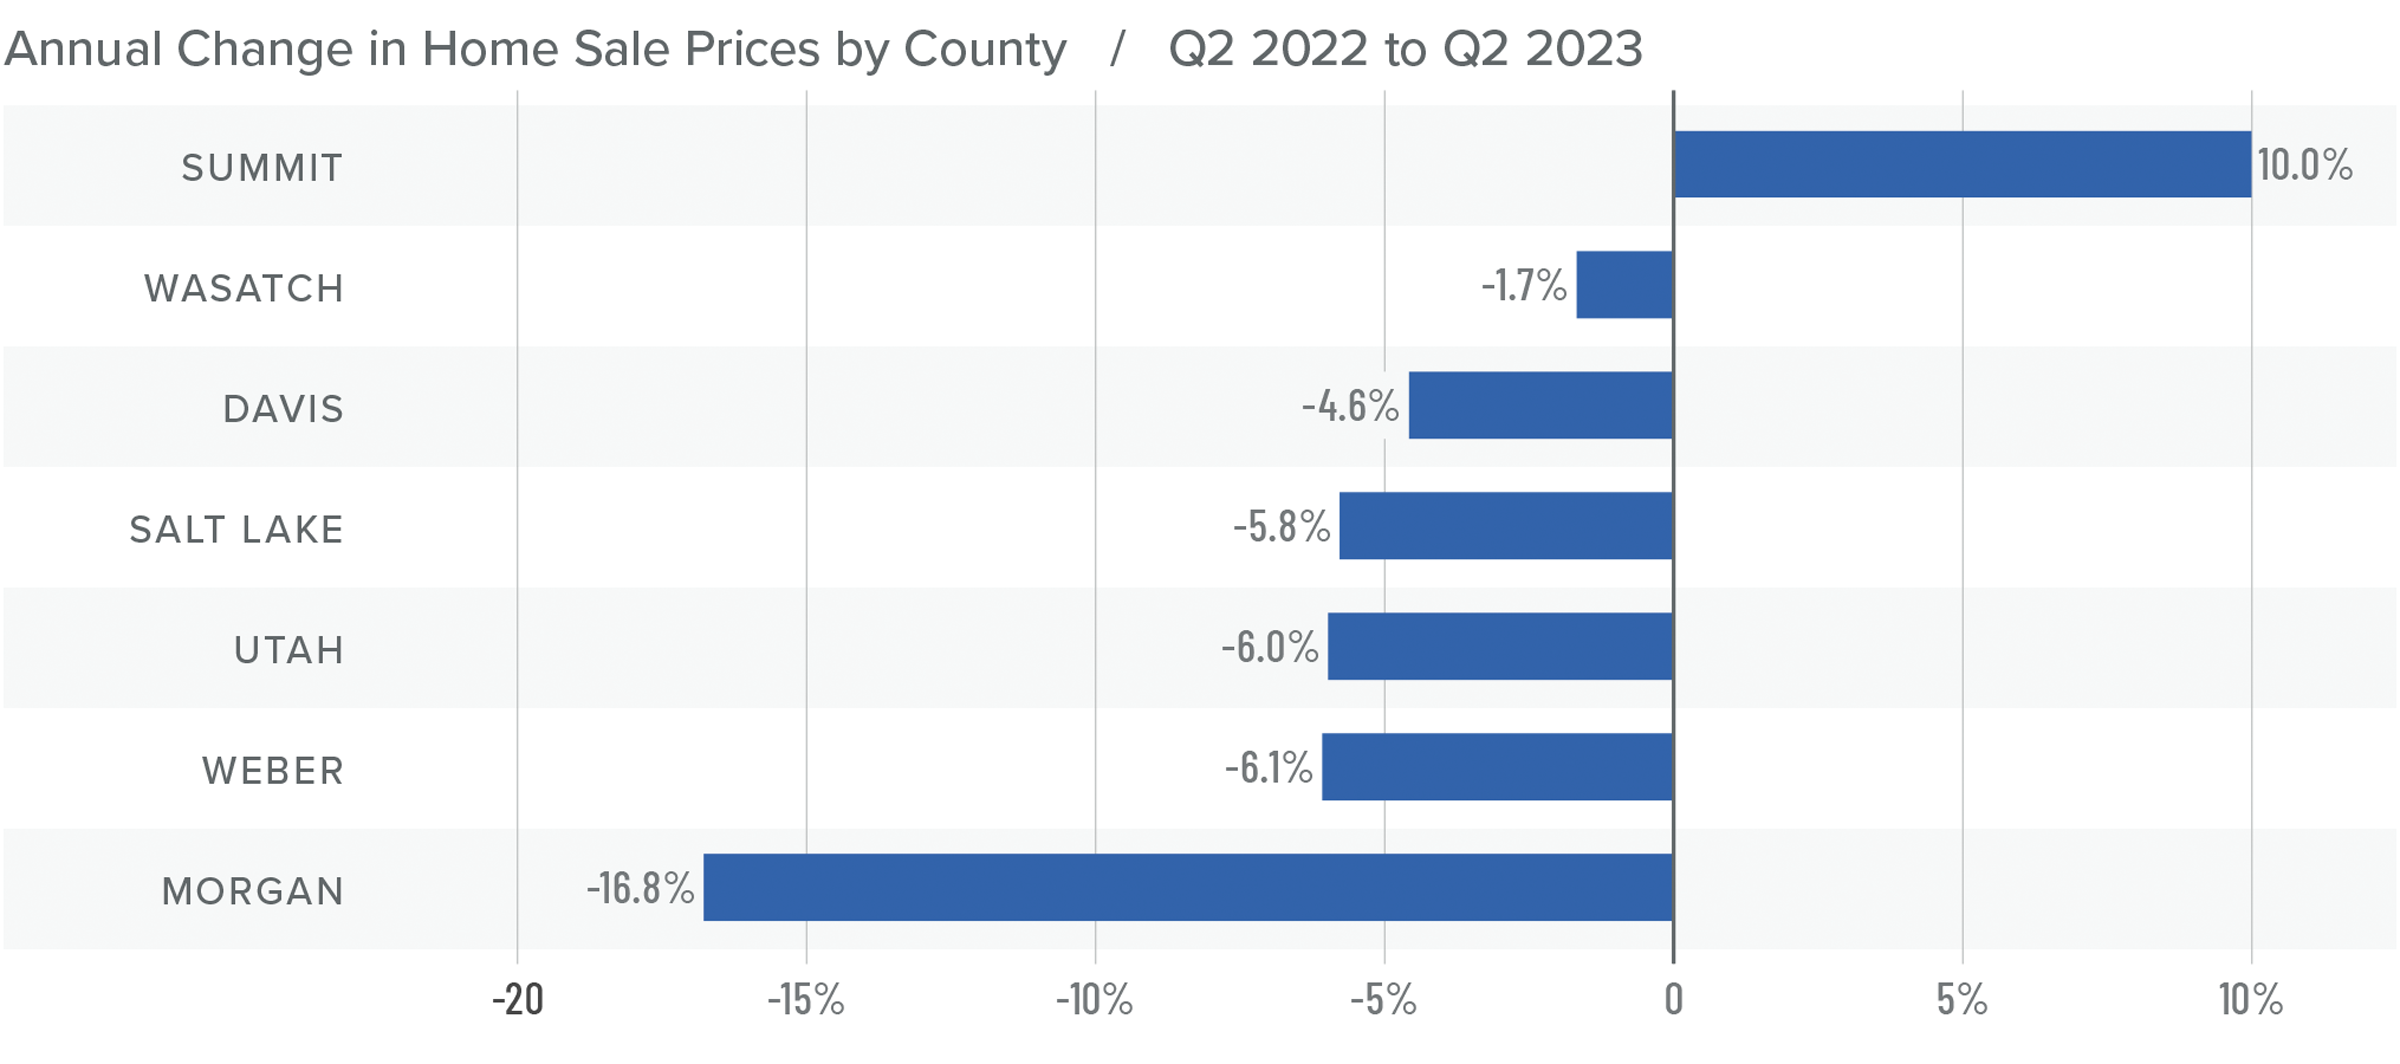
❱ The average sale price in the quarter fell 5.4% from the second quarter of 2022 to $629,289. However, sale prices were 4.1% higher than in the first quarter of 2023.
❱ Median list prices in the second quarter were 8.5% higher than in the first quarter of the year. It’s interesting to see sellers’ continued confidence given the significant increase in mortgage rates the market has experienced.
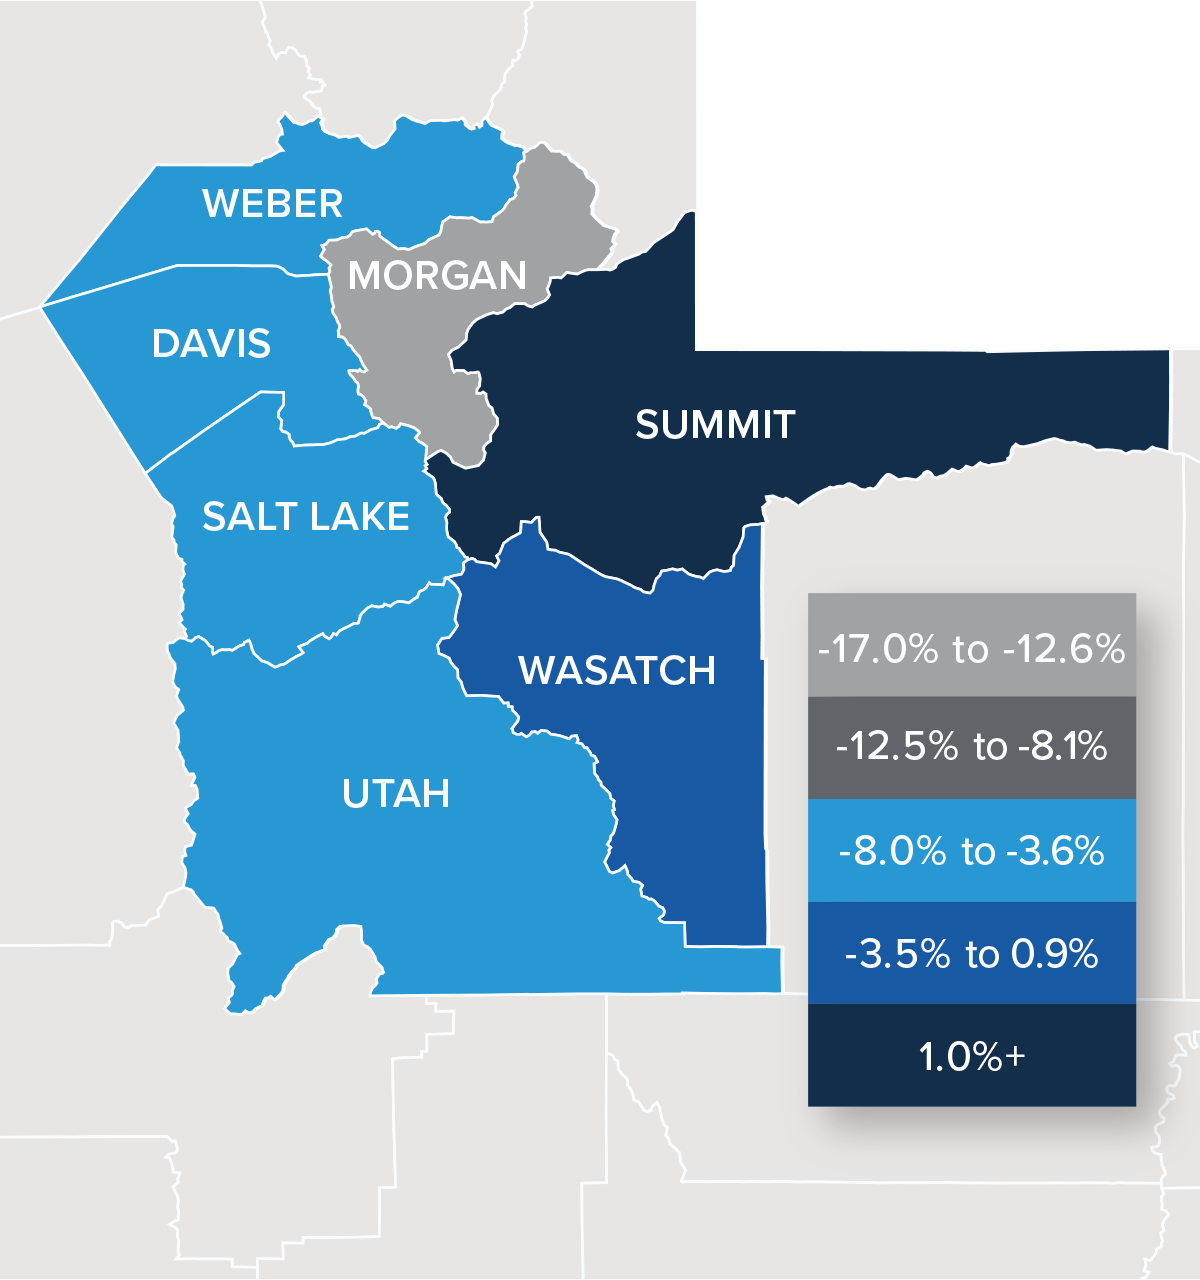
❱ Year over year, prices rose in Summit County but dropped in the other markets. Compared to the first quarter, prices rose in every county other than Wasatch, where they fell 12.7%.
❱ It was notable that the markets that saw list prices rising were in the more affordable areas. Expensive counties, such as Morgan, Summit, and Wasatch, all had lower median list prices than in the first quarter of this year.
Mortgage Rates
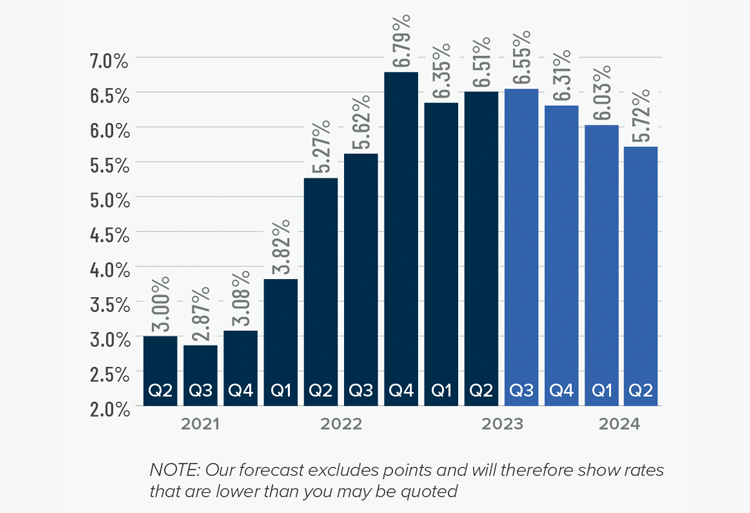
Although they were less erratic than the first quarter, mortgage rates unfortunately trended higher and ended the quarter above 7%. This was due to the short debt ceiling impasse, as well as several economic datasets that suggested the U.S. economy was not slowing at the speed required by the Federal Reserve.
While the June employment report showed fewer jobs created than earlier in the year, as well as downward revisions to prior gains, inflation has not sufficiently slowed. Until it does, rates cannot start to trend consistently lower. With the economy not slowing as fast as expected, I have adjusted my forecast: Rates will hold at current levels in third quarter and then start to trend lower through the fall. Although there are sure to be occasional spikes, my model now shows the 30-year fixed rate breaking below 6% next spring.
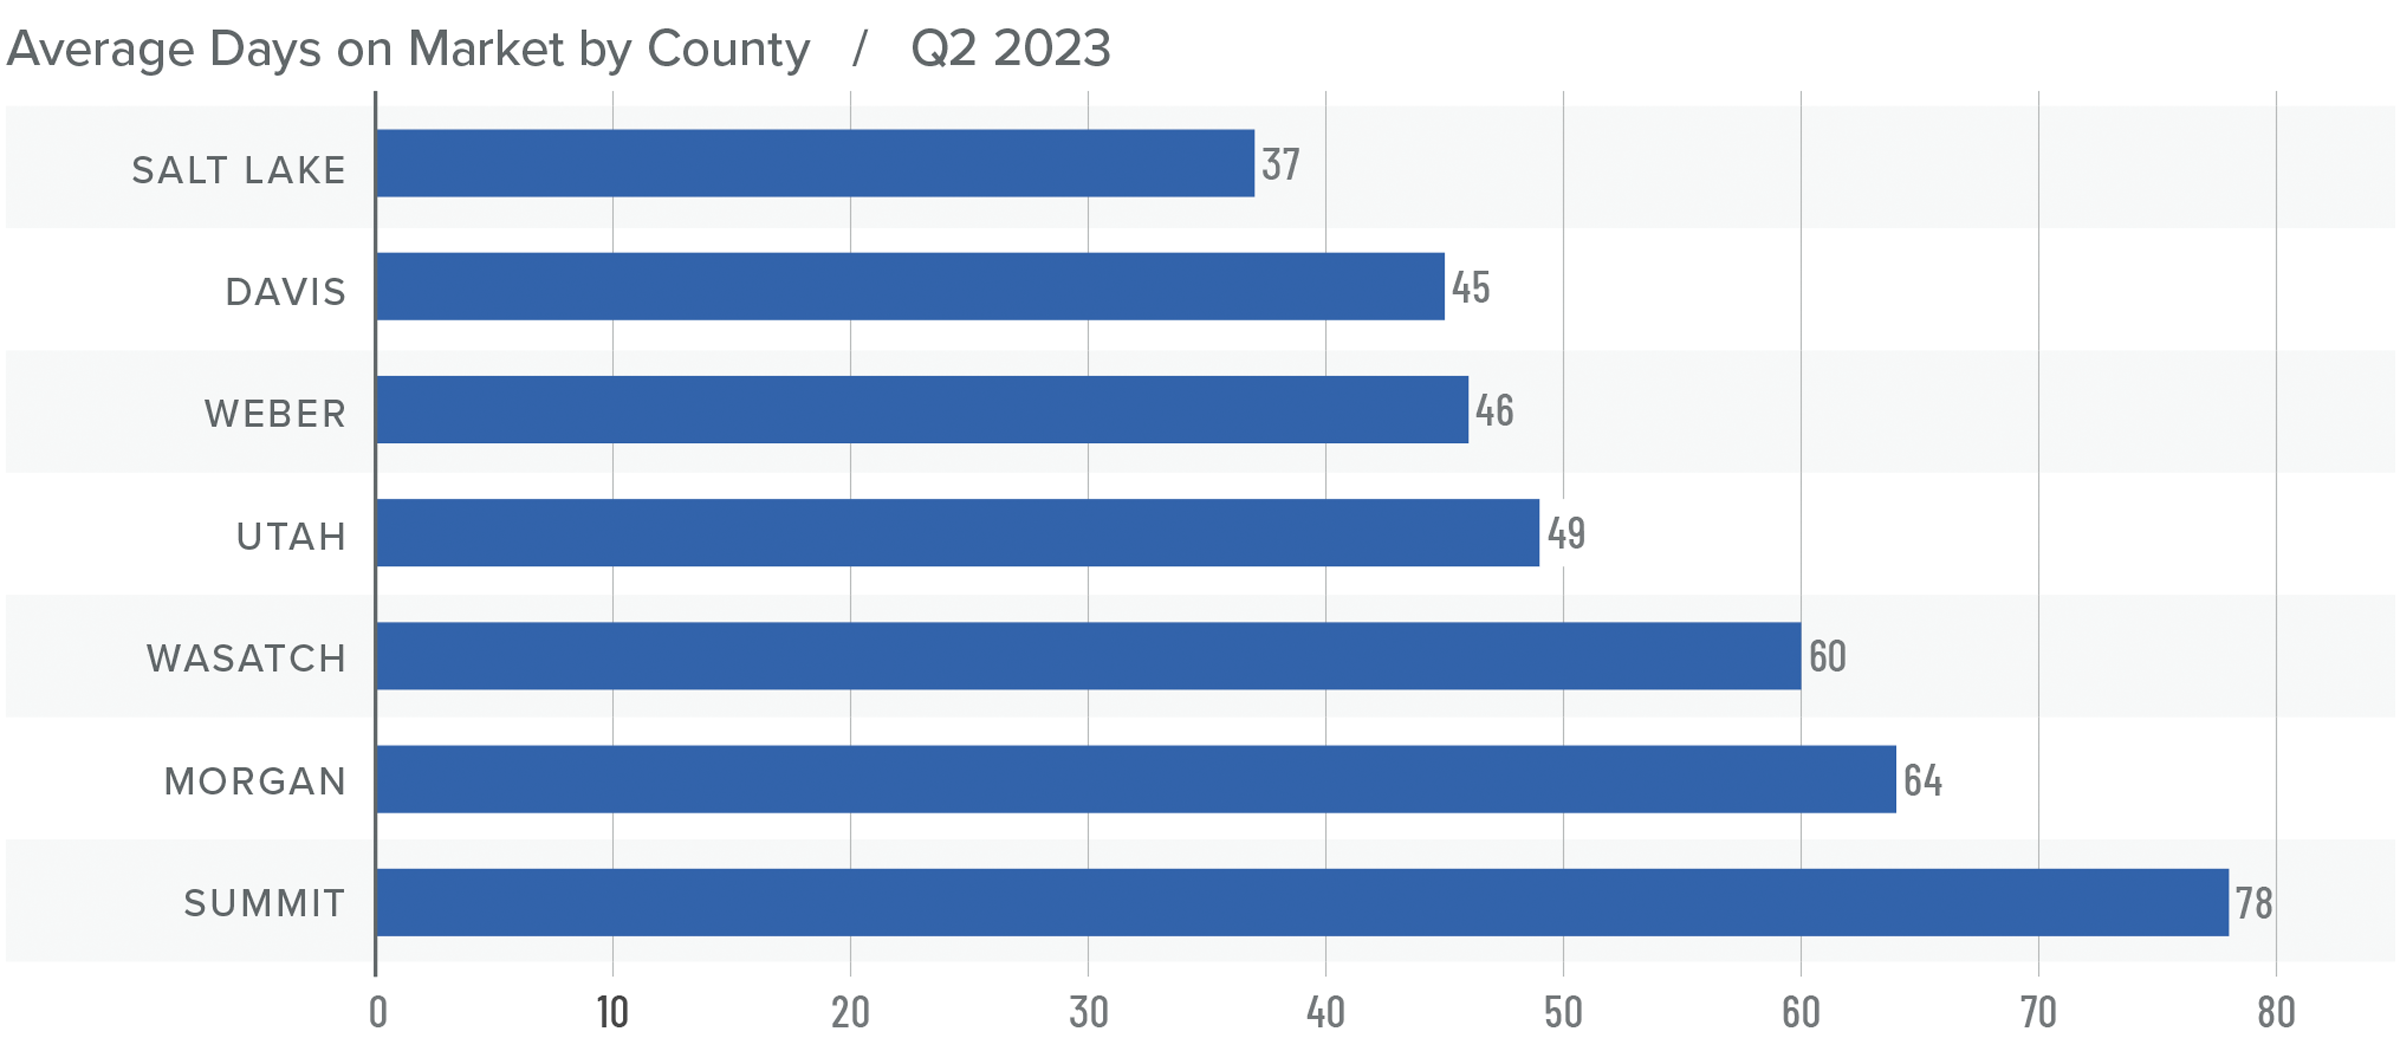
Utah Days on Market
❱ The average time it took to sell a home in the counties covered by this report rose 36 days compared to the same period a year ago.
❱ Homes sold fastest in Salt Lake County and slowest in Summit County. All areas saw average market time rise compared to the second quarter of 2022, but market time fell in all areas compared to the first quarter of this year.
❱ During the second quarter, it took an average of 54 days to sell a home. Market time fell 13 days compared to the first quarter of 2023.
❱ It was impressive to see the length of time it took to sell a home in the region fall significantly despite more inventory and higher financing costs.
Conclusions
This speedometer reflects the state of the region’s real estate market using housing inventory, price gains, home sales, interest rates, and larger economic factors.
In the first quarter Gardner Report, I suggested that the region was “very close to bottoming out” in respect to price. It appears I underestimated the resilience of Utah’s housing market. Given all the data presented here, the only thing that favors buyers is that there are more homes for sale. That said, while inventory levels have risen, they remain remarkably low by historic standards. This doesn’t come as a surprise given that 87.6% of all homeowners with a mortgage have rates below 5% and 31.6% have rates at or below 3%. If they don’t have to sell, why would they?
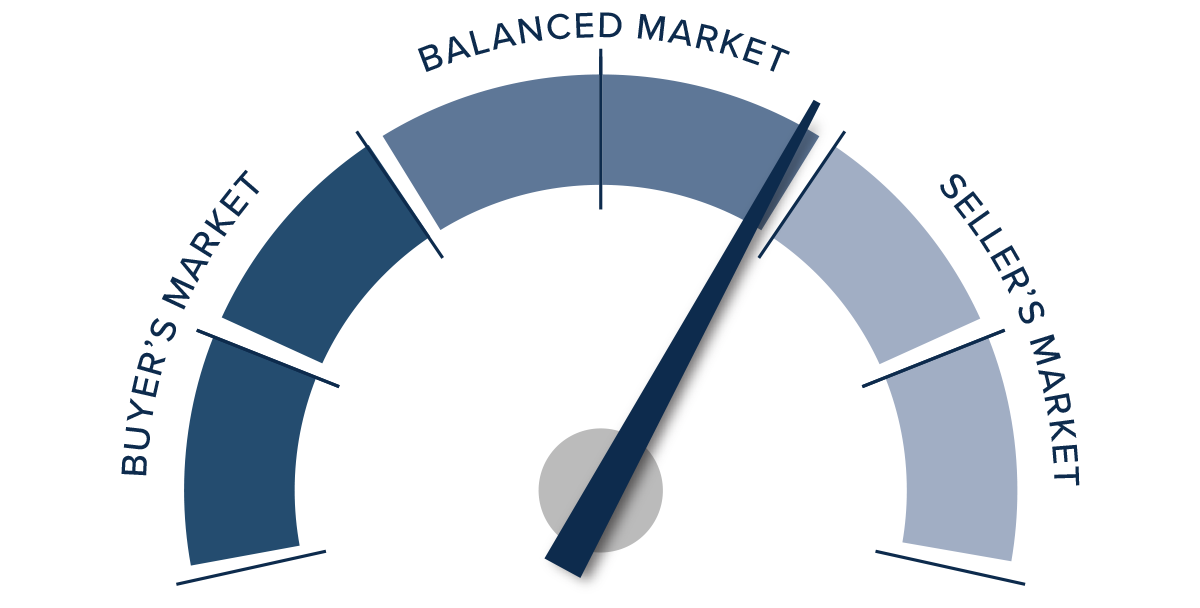
This will keep inventory tight. The only question that remains is how long the market can tolerate high mortgage rates and decreasing affordability. Given all the above factors, I have moved the needle a little more in favor of sellers. I can’t go so far as to suggest that sellers are in a totally dominant position, but they still have the upper hand.
About Matthew Gardner

As Chief Economist for Windermere Real Estate, Matthew Gardner is responsible for analyzing and interpreting economic data and its impact on the real estate market on both a local and national level. Matthew has over 30 years of professional experience both in the U.S. and U.K.
In addition to his day-to-day responsibilities, Matthew sits on the Washington State Governors Council of Economic Advisors; chairs the Board of Trustees at the Washington Center for Real Estate Research at the University of Washington; and is an Advisory Board Member at the Runstad Center for Real Estate Studies at the University of Washington where he also lectures in real estate economics.
")


