
 Facebook
 X
X
 Pinterest
 Copy Link

The following analysis of select Maui real estate markets is provided by Windermere Real Estate Chief Economist Matthew Gardner. We hope that this information may assist you with making better-informed real estate decisions. For further information about the housing market in your area, please don’t hesitate to contact your Windermere agent.
Regional Economic Overview
COVID-19’s impact on the Maui economy remains significant, and spikes in new infections in the fall have weighed on the job recovery. That said, the latest available employment data (November) showed that the labor market has recovered more than 13,000 of the jobs that were lost. Total employment is still down 14,750 from the early 2020 levels. With jobs starting to return, the unemployment rate on the island is improving but still stands at a seasonally adjusted rate of 16.6%. That is down from the peak of 33.5% but significantly higher than the 2.3% rate last March and the 2.5% level at the same time the prior year. All of the islands continue to suffer from slow economic growth due to the pandemic, but I remain hopeful that jobs will continue to return—assuming new infection rates do not go up again.
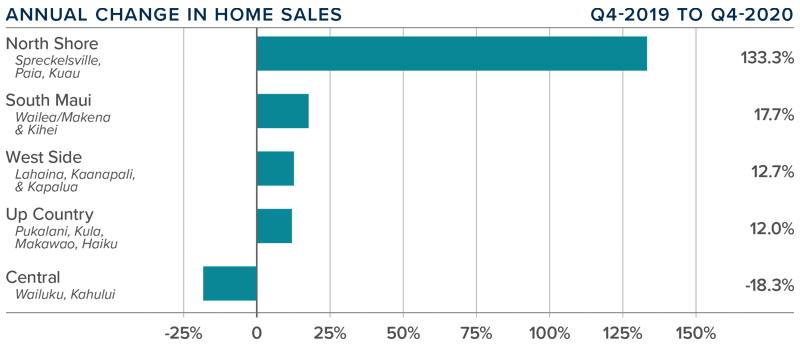
Maui, Hawaii Home Sales
❱ In the fourth quarter of 2020, 615 homes changed hands, an increase of 7.5% compared to the same period the previous year, and 26.3% higher than in the third quarter of 2020.
❱ Sales rose in all markets other than the Central area, but the drop there was small in absolute numbers (26 fewer sales). The largest increase in home sales was in North Shore, but all markets other than the Central area saw double-digit increases compared to the final quarter of 2019.
❱ Listing activity rose 5.6% compared to the same quarter in 2019 but was 5.8% lower than in the third quarter. It is interesting that sales rose even with fewer listings, proving that demand is robust.
❱ Pending home sales were 9.8% higher than in the third quarter of 2020, suggesting that closings in the first quarter of 2021 will likely be positive.
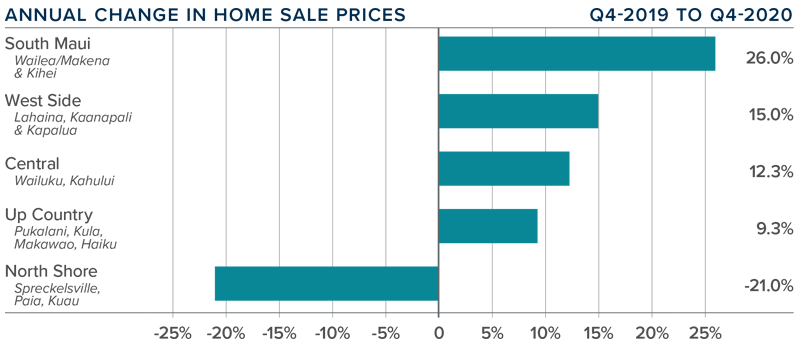
maui, hawaii Home Prices
❱ The average home price on Maui rose 21.3% year-over-year to $1.14 million and was 10.9% higher than in the third quarter of 2020.
❱ Affordability remains a significant issue, but prices continue to appreciate, suggesting that demand is still in place.
❱ The increase in average prices was driven by significant gains in South Maui, the Westside, and in the Central area. Up Country also saw decent growth. The very small North Shore market again saw prices drop but I am not particularly concerned given so few transactions occur there.
❱ I expect prices to continue rising, but I anticipate that growth will be modest given that mortgage rates are unlikely to drop much further.
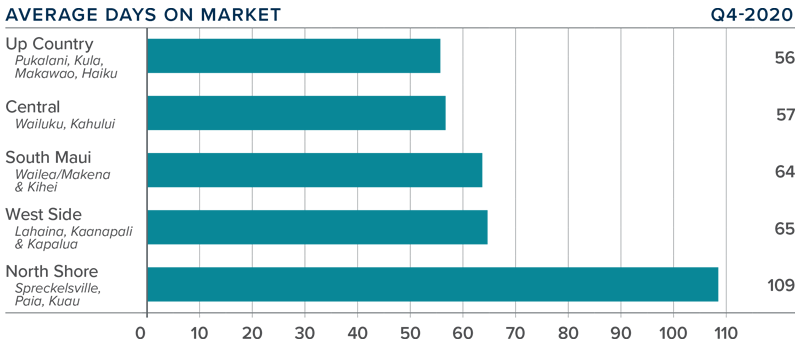
Days on Market
❱ The average number of days it took to sell a home on Maui rose 11 days from the final quarter of 2019.
❱ The amount of time it took to sell a home dropped on the Westside and Up Country but rose in all other areas.
❱ In fourth quarter, it took an average of 70 days to sell a home, with homes selling the fastest in Up Country and slowest in North Shore.
❱ Market time also rose 17 days compared to the third quarter of 2020, giving credence to my belief that affordability issues appear to be outweighing the limited number of homes for sale.
Conclusions
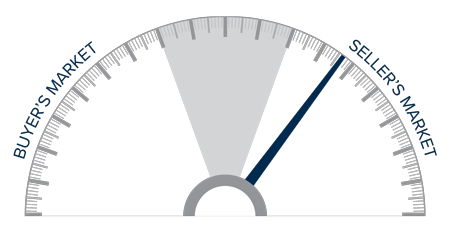
This speedometer reflects the state of the region’s real estate market using housing inventory, price gains, home sales, interest rates, and larger economic factors.
Price growth has been very significant, which, in concert with inventory limitations, should indicate a seller’s market. However, the increase in market time suggests this may not be the case. The pandemic and affordability are still influencing the direction of the housing market, which should favor buyers. Quite the conundrum!
Overall, I expect well-positioned and well-priced homes to continue to sell, but some of the heat appears to have come off the market. Accordingly, I am leaving the needle in the same position as last quarter’s report.
About Matthew Gardner

As Chief Economist for Windermere Real Estate, Matthew Gardner is responsible for analyzing and interpreting economic data and its impact on the real estate market on both a local and national level. Matthew has over 30 years of professional experience both in the U.S. and U.K.
In addition to his day-to-day responsibilities, Matthew sits on the Washington State Governors Council of Economic Advisors; chairs the Board of Trustees at the Washington Center for Real Estate Research at the University of Washington; and is an Advisory Board Member at the Runstad Center for Real Estate Studies at the University of Washington where he also lectures in real estate economics.
")


