
 Facebook
 X
X
 Pinterest
 Copy Link

The following analysis of select neighborhoods in the Park City real estate market is provided by Windermere Real Estate Chief Economist Matthew Gardner. We hope that this information may assist you with making better-informed real estate decisions. For further information about the housing market in your area, please don’t hesitate to contact your Windermere agent.
Regional Economic Overview
The recovery in employment following the very significant job losses in Utah from COVID-19 continues to impress. Of the over 144,000 jobs that were lost in the state, all but 7,800 have returned. With the recovery clearly in place, the unemployment rate, which peaked at 10.4% in April, has dropped as jobs have been recovered and now stands at a very respectable 4.3%.
In the third quarter Gardner Report, I mentioned I was a little concerned that rising COVID-19 infection rates might curtail the economic recovery, but the impact thus far has been minimal. I am pleased to see new infection rates starting to drop again and hope this trend will continue.
park city, utah Home Sales
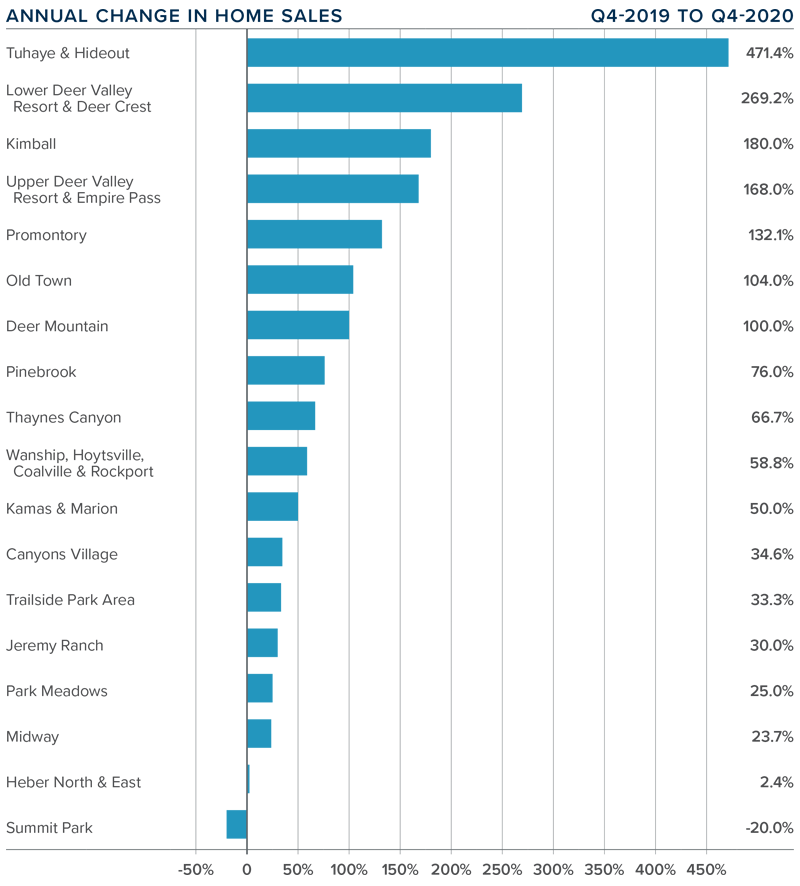
❱ There were 484 home sales in the final quarter of 2020, an increase of 81% compared to the fourth quarter of 2019, and up 38.7% compared to the third quarter of 2020.
❱ Sales rose in all markets other than Summit Park, where they dropped modestly. The Tuhaye/Hideout neighborhood saw a remarkable 471% increase in sales, but that meant that sales only rose from 7 to 40.
❱ The growth in sales was even more impressive given that there were almost 27% fewer listings than in the third quarter of the year.
❱ Pending home sales were 139% higher year over year but were 15.1% lower than in the third quarter. This is likely a function of inventory limitations and seasonality.
park city, utah Home Prices
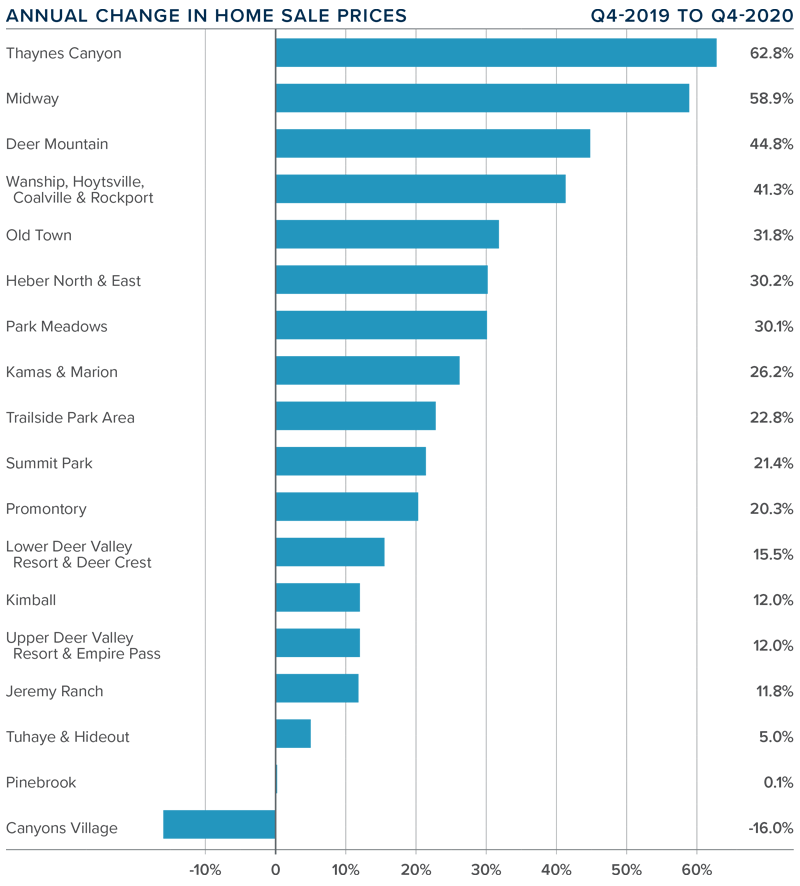
❱ The average home sale price in the Park City neighborhoods contained in this report rose 24.1% year-over-year to $1.543 million. Home prices were 5.1% higher than in the third quarter of 2020.
❱ The most affordable neighborhoods—relative to average sale prices—were in the Kimball, Wanship/Hoytsville/ Coalville/Rockport, and Midway neighborhoods. The most expensive areas were the Upper Deer Valley Resort & Empire Pass, where average sale prices exceeded $3 million.
❱ Prices rose in all but one neighborhood, with double-digit increases in all but three of the markets contained in this report.
❱ The Park City market is relatively small but is home to some very expensive real estate. It is clear that the pandemic has not impacted demand for homes in the area, as limited supply and significant demand continue to push prices higher.
Days on Market
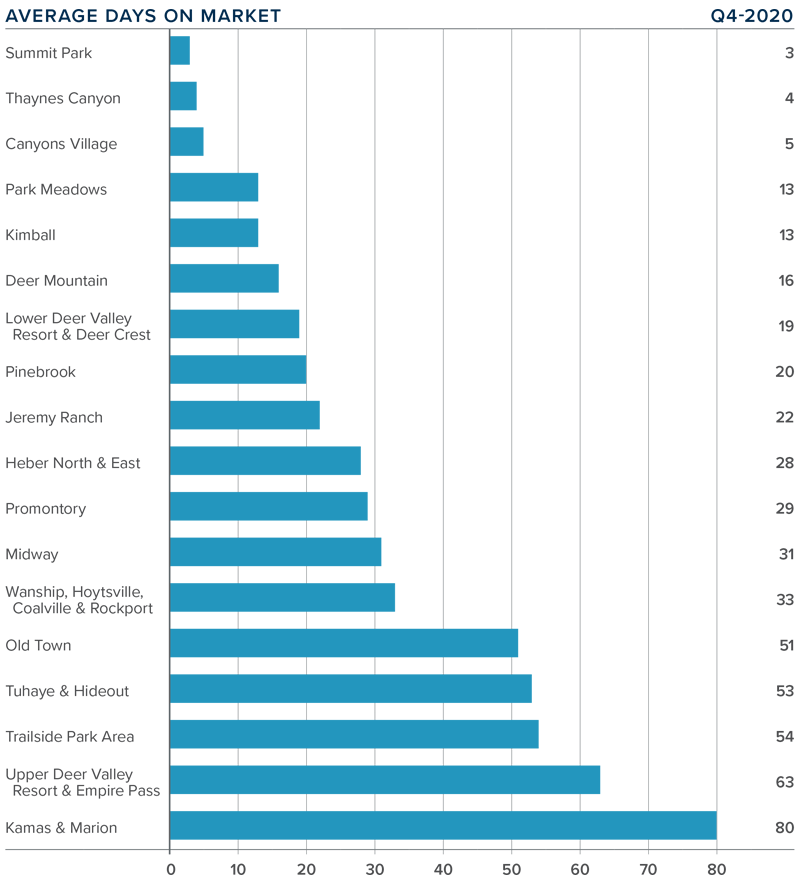
❱ The average time it took to sell a home in the Park City area dropped 30 days compared to the final quarter of 2019.
❱ The amount of time it took to sell a home dropped in all but four neighborhoods—Old Town, Kamas & Marion, Trailside Park, and Tuhaye/Hideout—relative to the fourth quarter of 2019.
❱ In the final quarter of 2020, it took an average of 31 days to sell a home. Homes sold fastest in the Summit Park, Thaynes Canyon, and Canyon Village areas, and slowest in the Kamas & Marion neighborhood.
❱ The significant drop in market time was primarily due to the local multiple listing service instituting a rule that led new construction developments to add sales “en-masse.” This lowered market time dramatically.
Conclusions
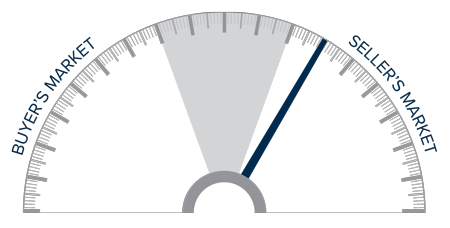
This speedometer reflects the state of the region’s real estate market using housing inventory, price gains, home sales, interest rates, and larger economic factors.
Even as mortgage rates start to increase, I do not believe this will have much of a slowing effect on the Park City market. In fact, jumbo mortgage rates, which spiked significantly when COVID-19 hit but have since dropped, have encouraged buyers to resume taking advantage of relatively cheap money.
Given all these factors, sellers still have the upper hand, and I am therefore moving the needle a little more in their favor.
About Matthew Gardner

As Chief Economist for Windermere Real Estate, Matthew Gardner is responsible for analyzing and interpreting economic data and its impact on the real estate market on both a local and national level. Matthew has over 30 years of professional experience both in the U.S. and U.K.
In addition to his day-to-day responsibilities, Matthew sits on the Washington State Governors Council of Economic Advisors; chairs the Board of Trustees at the Washington Center for Real Estate Research at the University of Washington; and is an Advisory Board Member at the Runstad Center for Real Estate Studies at the University of Washington where he also lectures in real estate economics.
")


