
 Facebook
 X
X
 Pinterest
 Copy Link

The following analysis of select counties of the Northern California real estate market is provided by Windermere Real Estate Chief Economist Matthew Gardner. We hope that this information may assist you with making better-informed real estate decisions. For further information about the housing market in your area, please don’t hesitate to contact your Windermere Real Estate agent.
Regional Economic Overview
Total employment in the counties covered by this report continues to slow, as demonstrated by the addition of only 45,300 jobs over the past 12 months. Although the numbers are adjusted for seasonality every January, this is highly unlikely to be totally responsible for the poor pace of growth of only 1.5%. On a more positive note, the regional unemployment rate fell from 3.8% to 3.6% from the same period in 2022. The lowest jobless rate was in Santa Clara County (3.1%) and the highest rate was in Shasta County at 5.8%.
Northern California Home Sales
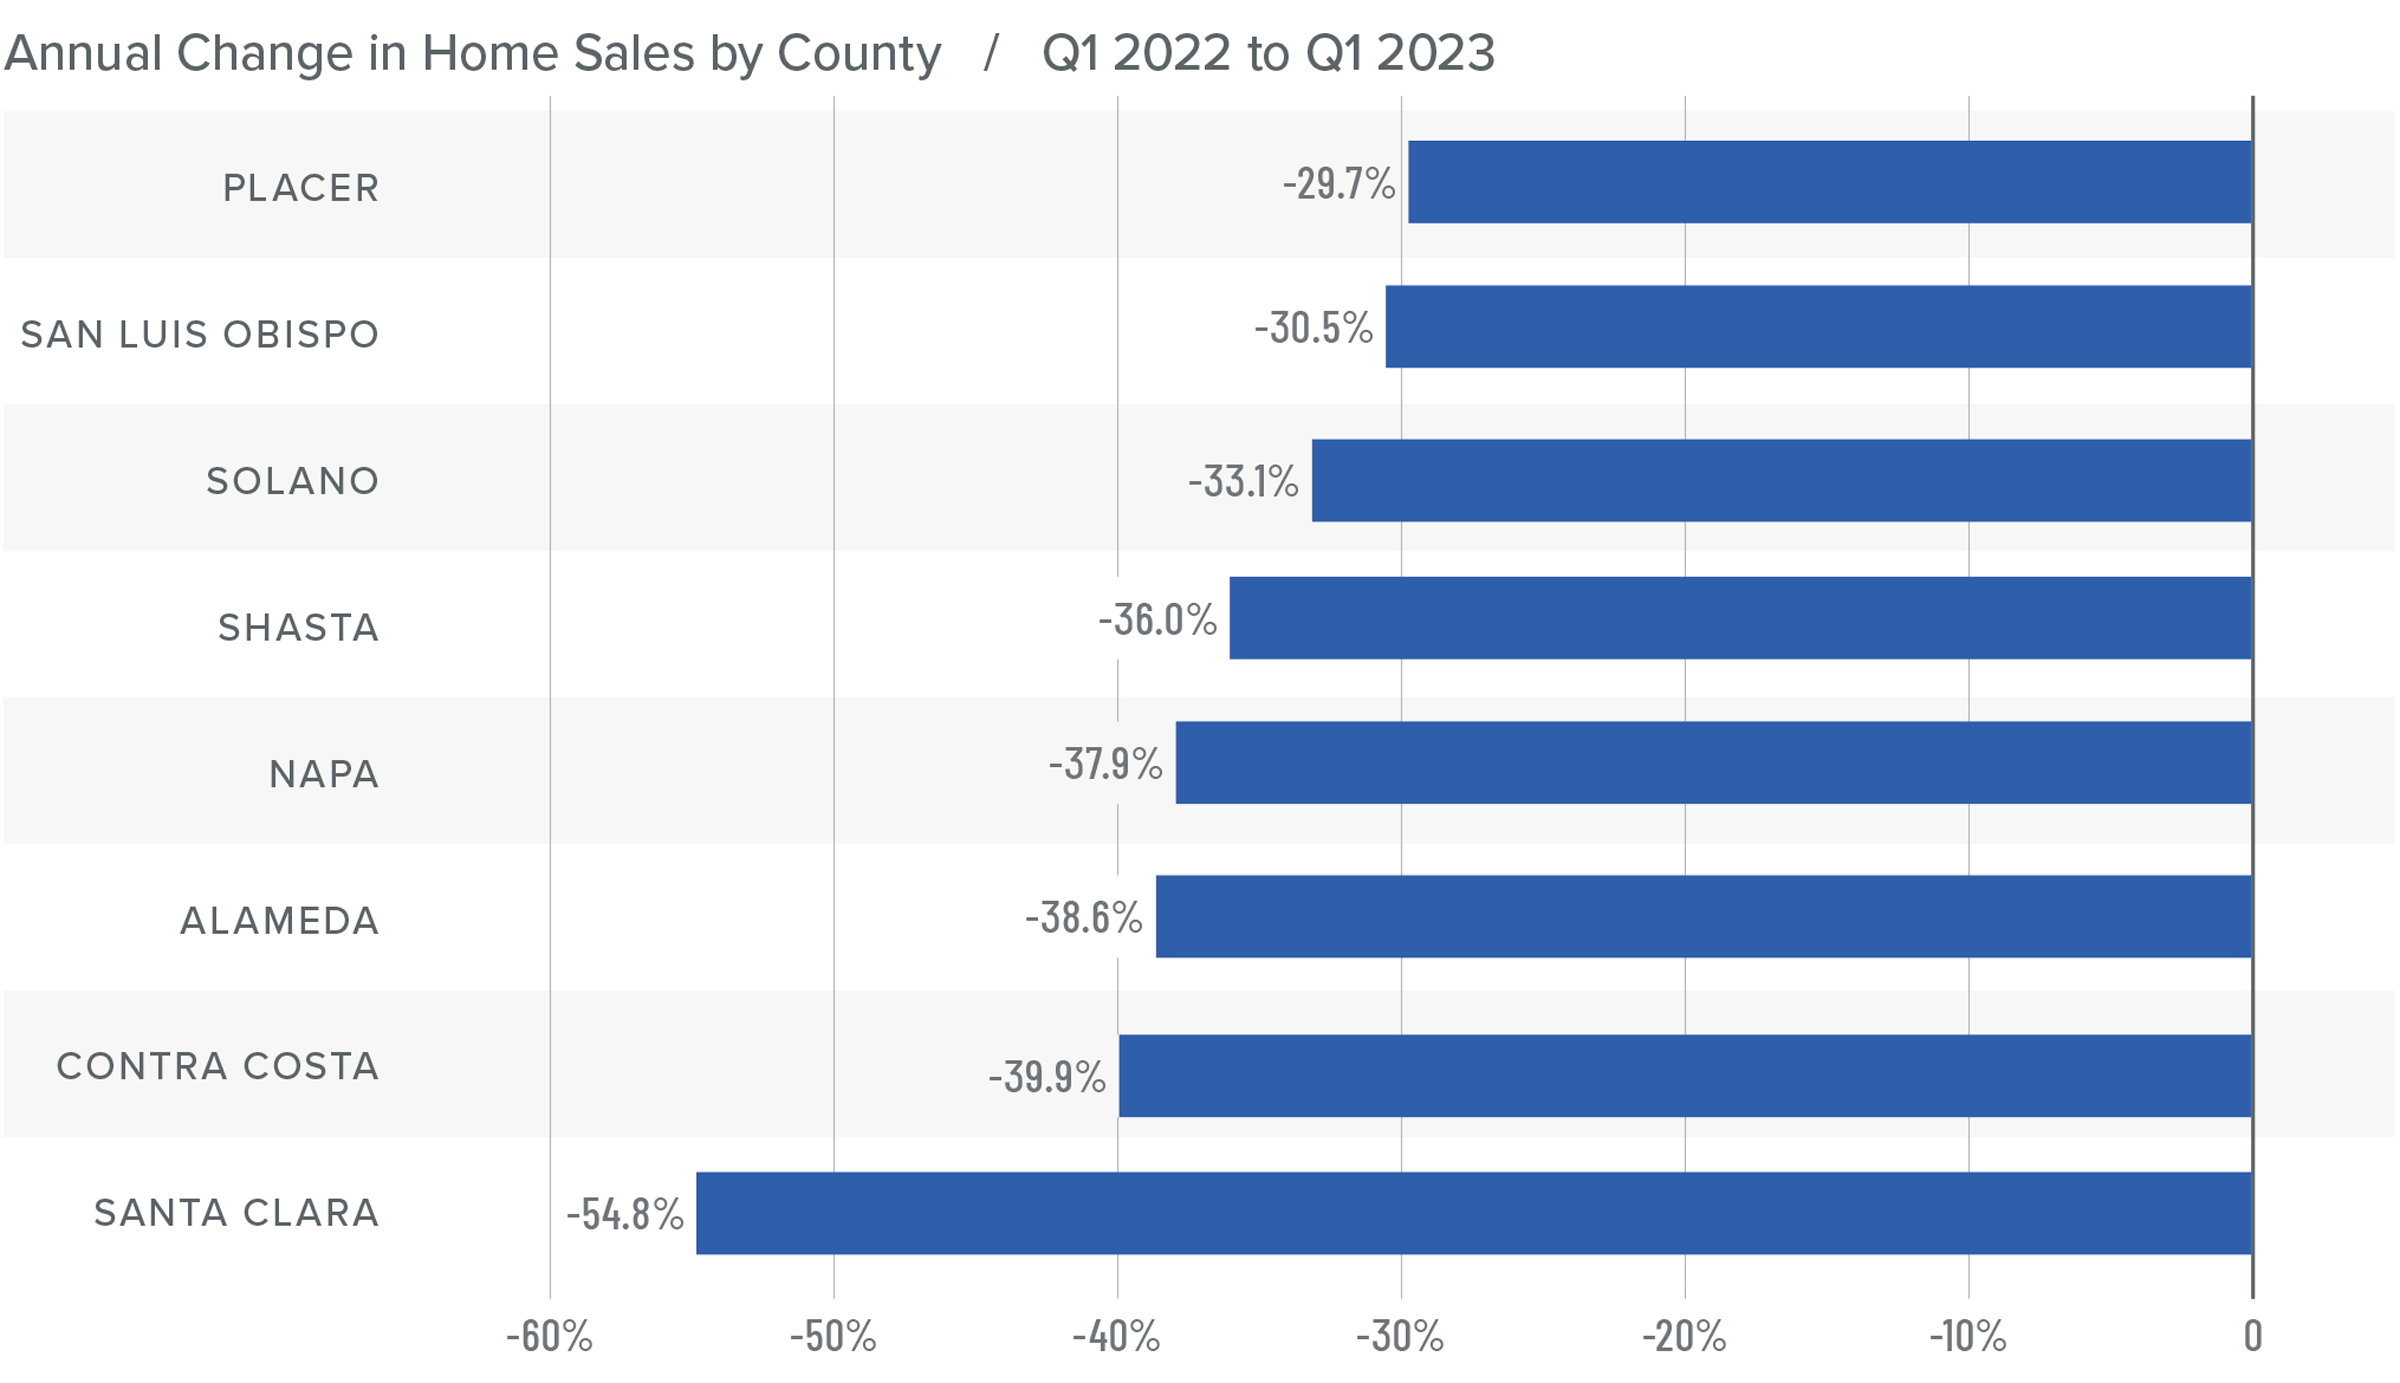
❱ In the first quarter of the year, 5,106 homes sold, a significant drop from the more than 8,100 homes that sold in the first quarter of 2022. Closed sales were 21.6% lower than in the final quarter of 2022.
❱ Year over year, sales fell across the board. The largest drop was in Santa Clara County, but the decline in sales activity was pronounced across the region.
❱ Listing inventory in the first quarter was down 32.4% from the prior quarter, which certainly contributed to the poor sales numbers.
❱ Pending home sales were up 9% compared to the fourth quarter of 2022, so it is possible that closed sales may pick up in the second quarter.
Northern California Home Prices
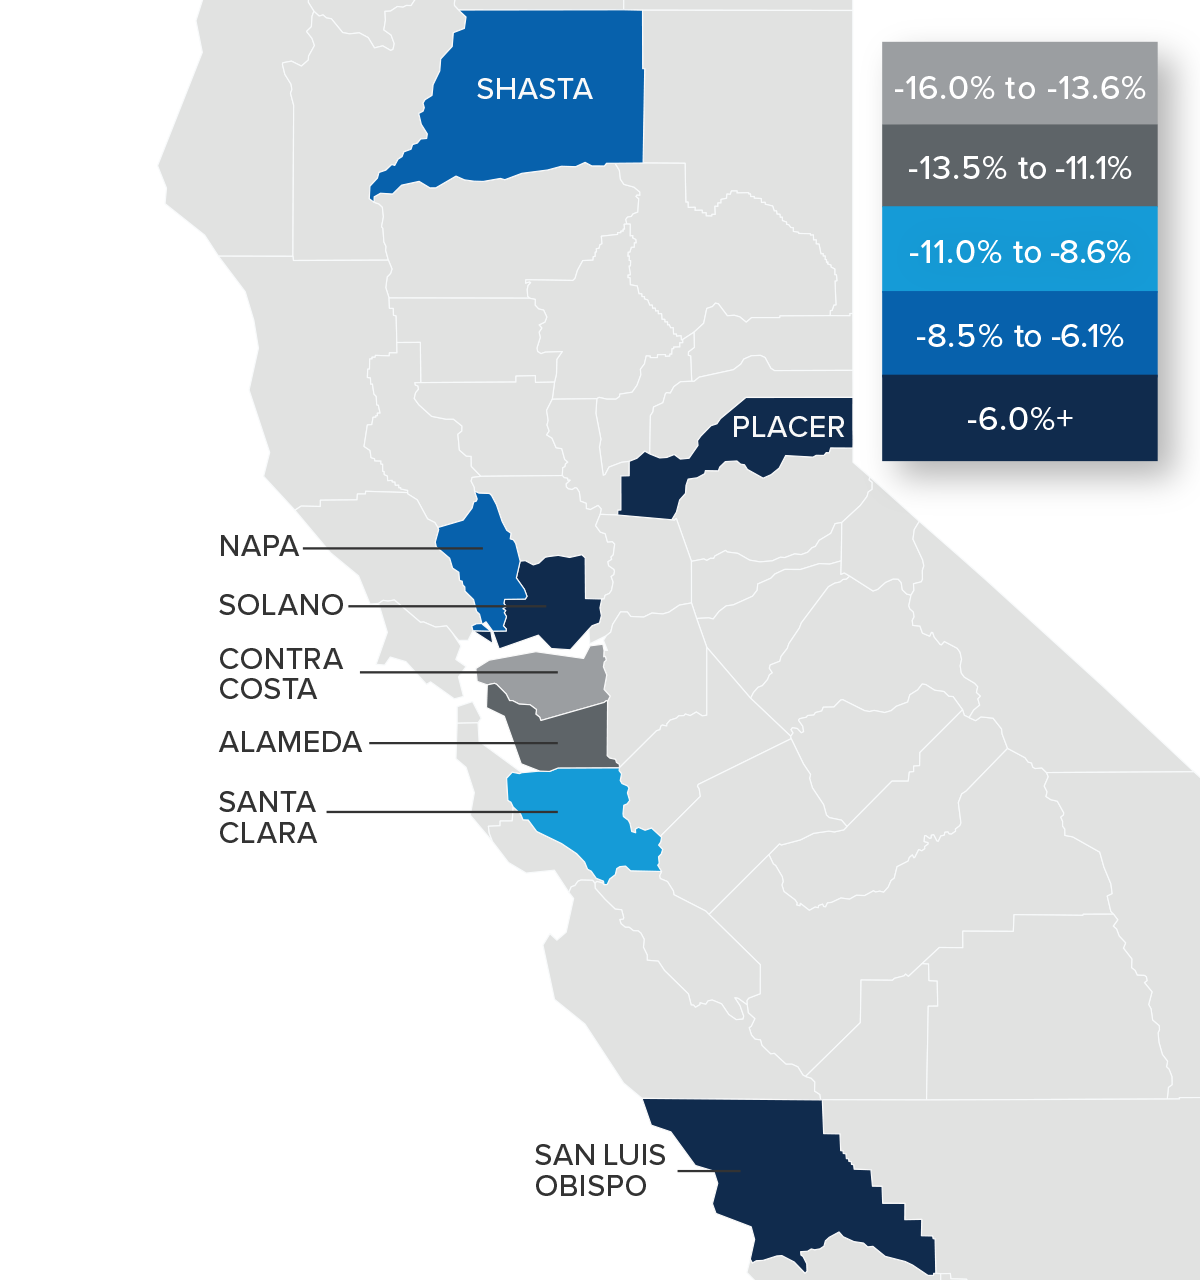
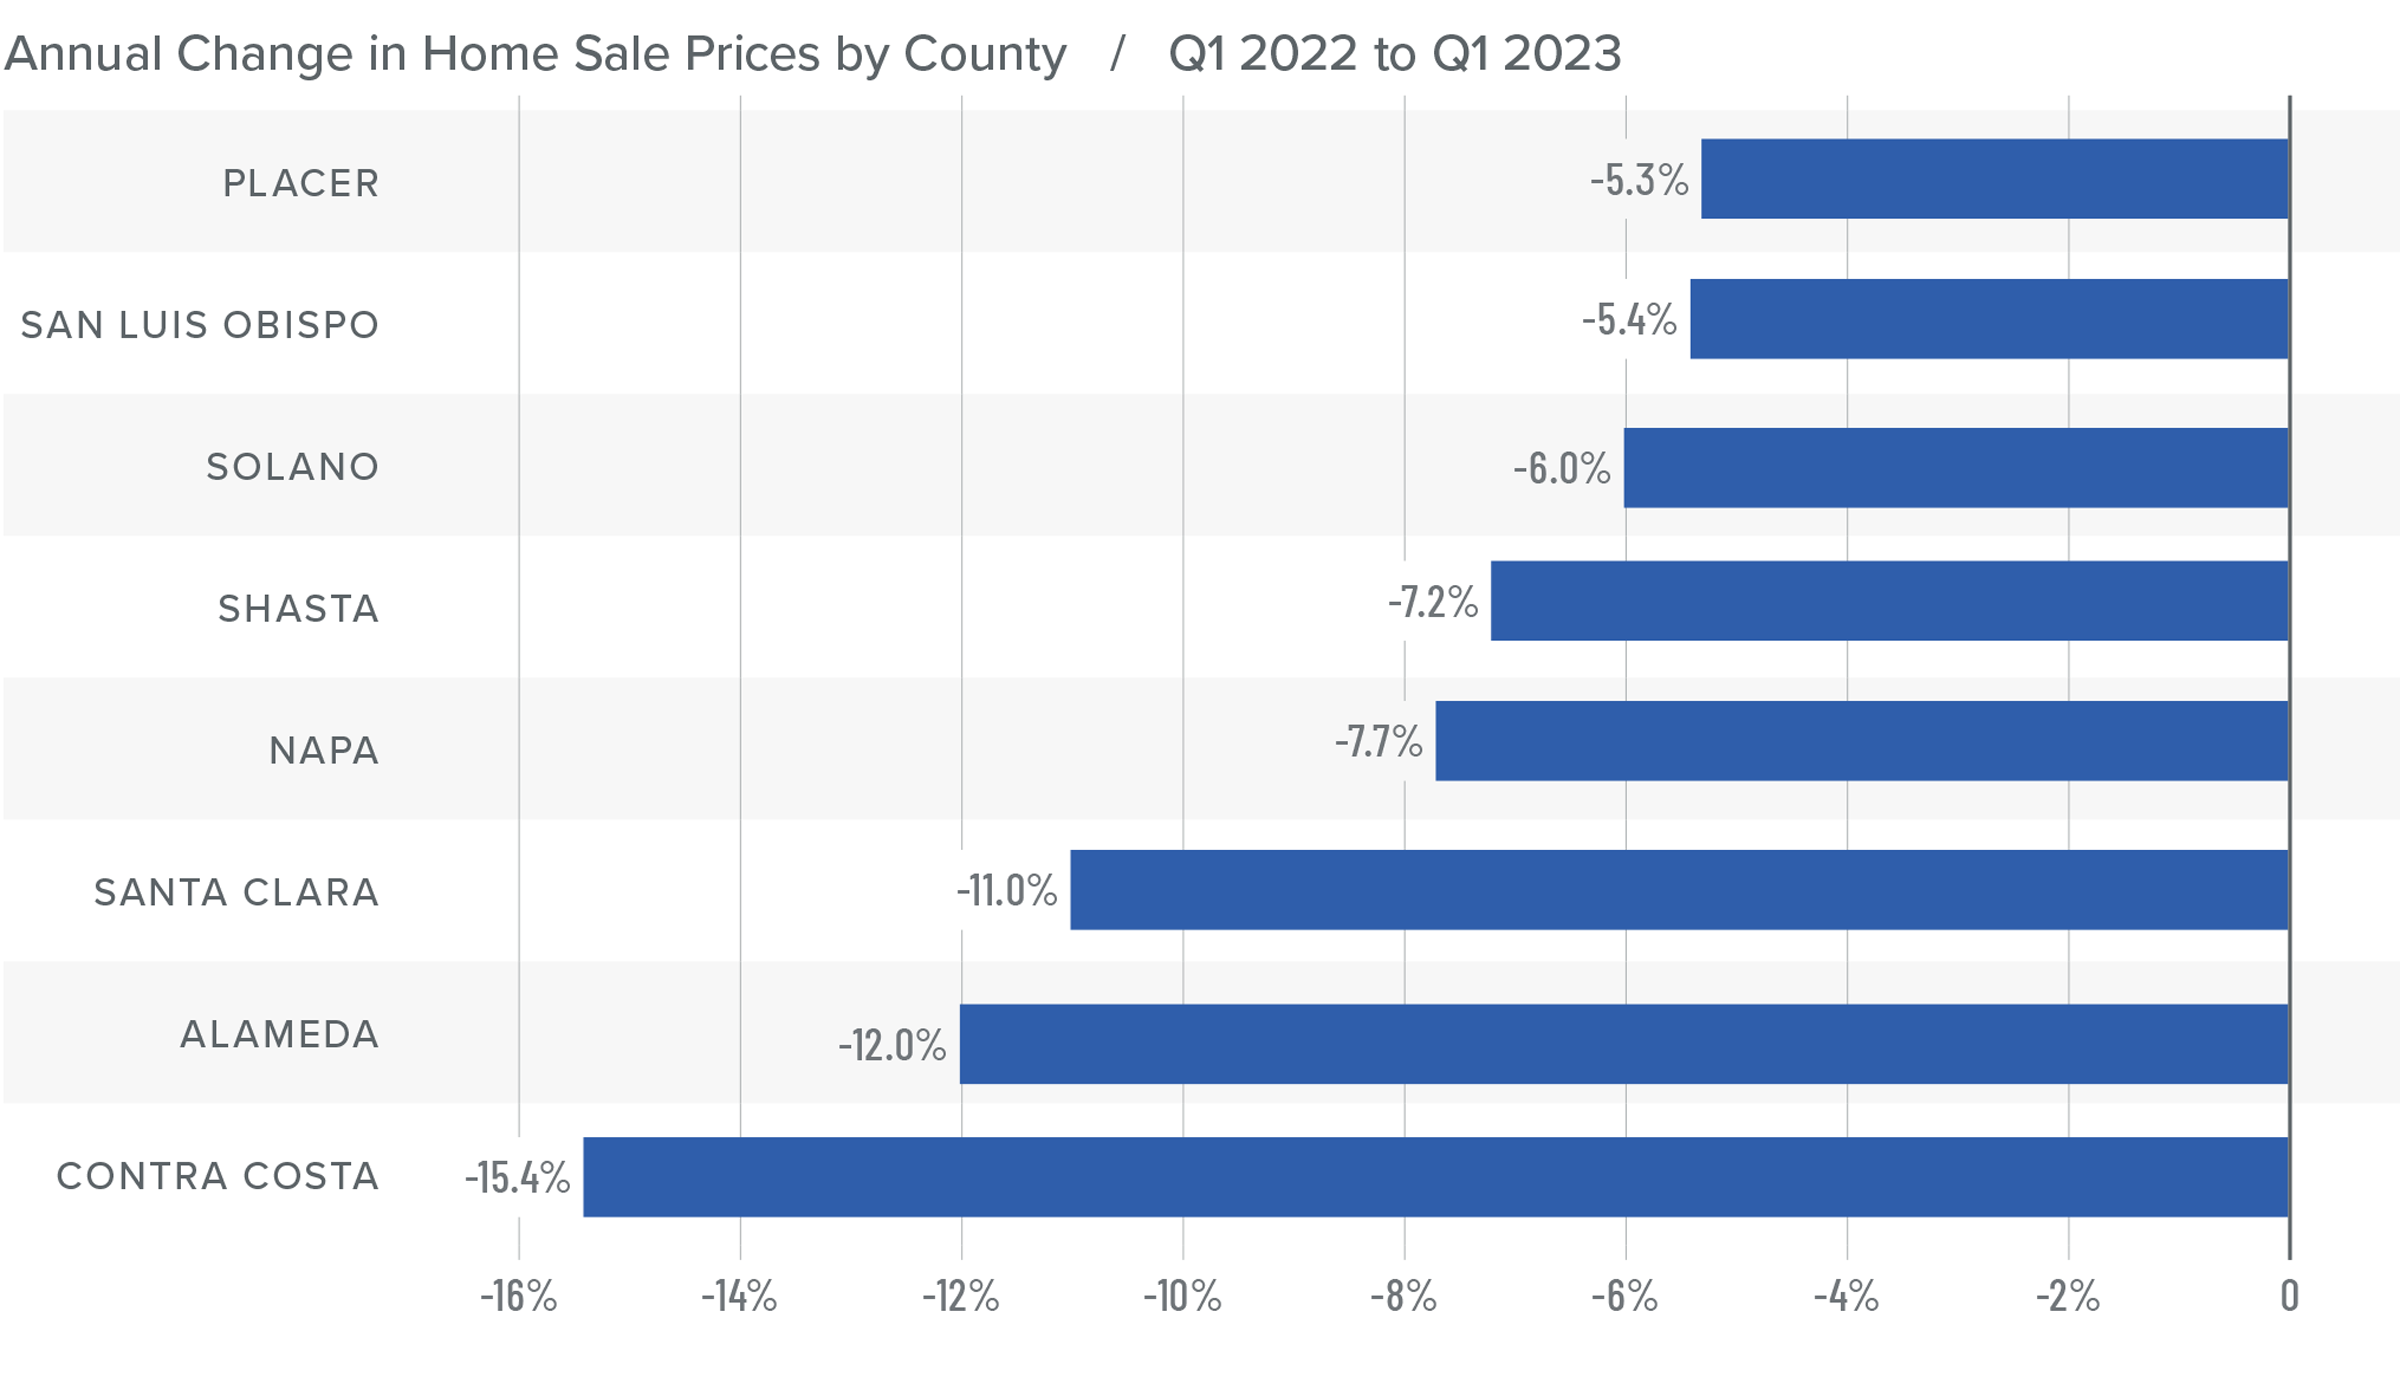
❱ Higher financing costs continue to impact prices, with the average price of a home sold in the region dropping 12.7% from the first quarter of 2022. Sale prices were 5.8% lower than in the final quarter of last year.
❱ Median list prices in the region managed to rise just a little (+1.9%) compared to the previous quarter. Across the counties contained in this report, prices rose in Placer, Napa, San Luis Obispo, and Contra Costa counties but fell in the rest of the markets.
❱ Prices fell across the board compared to the first quarter of 2022, with double-digit drops in Santa Clara, Alameda, and Contra Costa counties. Compared to the fourth quarter of 2022, prices were higher in Placer County, but fell in the rest of the market areas.
❱ The numbers may look dire, but I believe that the worst of the price drops is behind us. While home prices likely have a little further to fall, I still predict that stability will return as we move into this summer.
Mortgage Rates
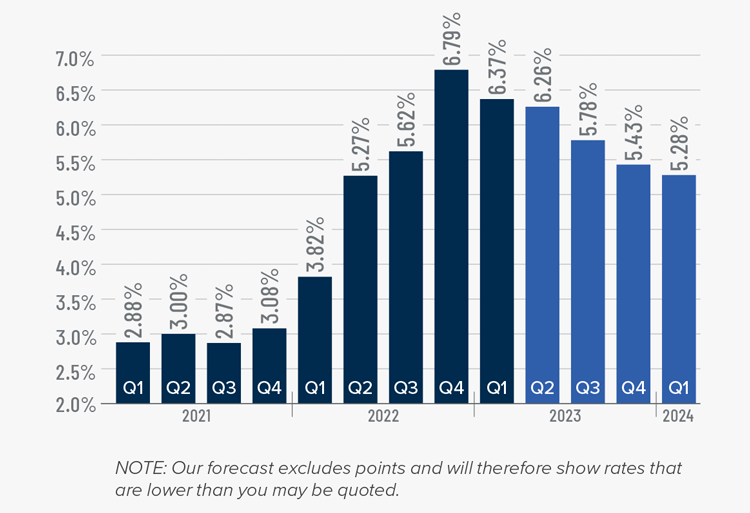
Rates in the first quarter of 2023 were far less volatile than last year, even with the brief but significant impact of early March’s banking crisis. It appears that buyers are jumping in when rates dip, which was the case in mid-January and again in early February.
Even with the March Consumer Price Index report showing inflation slowing, I still expect the Federal Reserve to raise short-term rates one more time following their May meeting before pausing rate increases. This should be the catalyst that allows mortgage rates to start trending lower at a more consistent pace than we have seen so far this year. My current forecast is that rates will continue to move lower with occasional spikes, and that they will hold below 6% in the second half of this year.
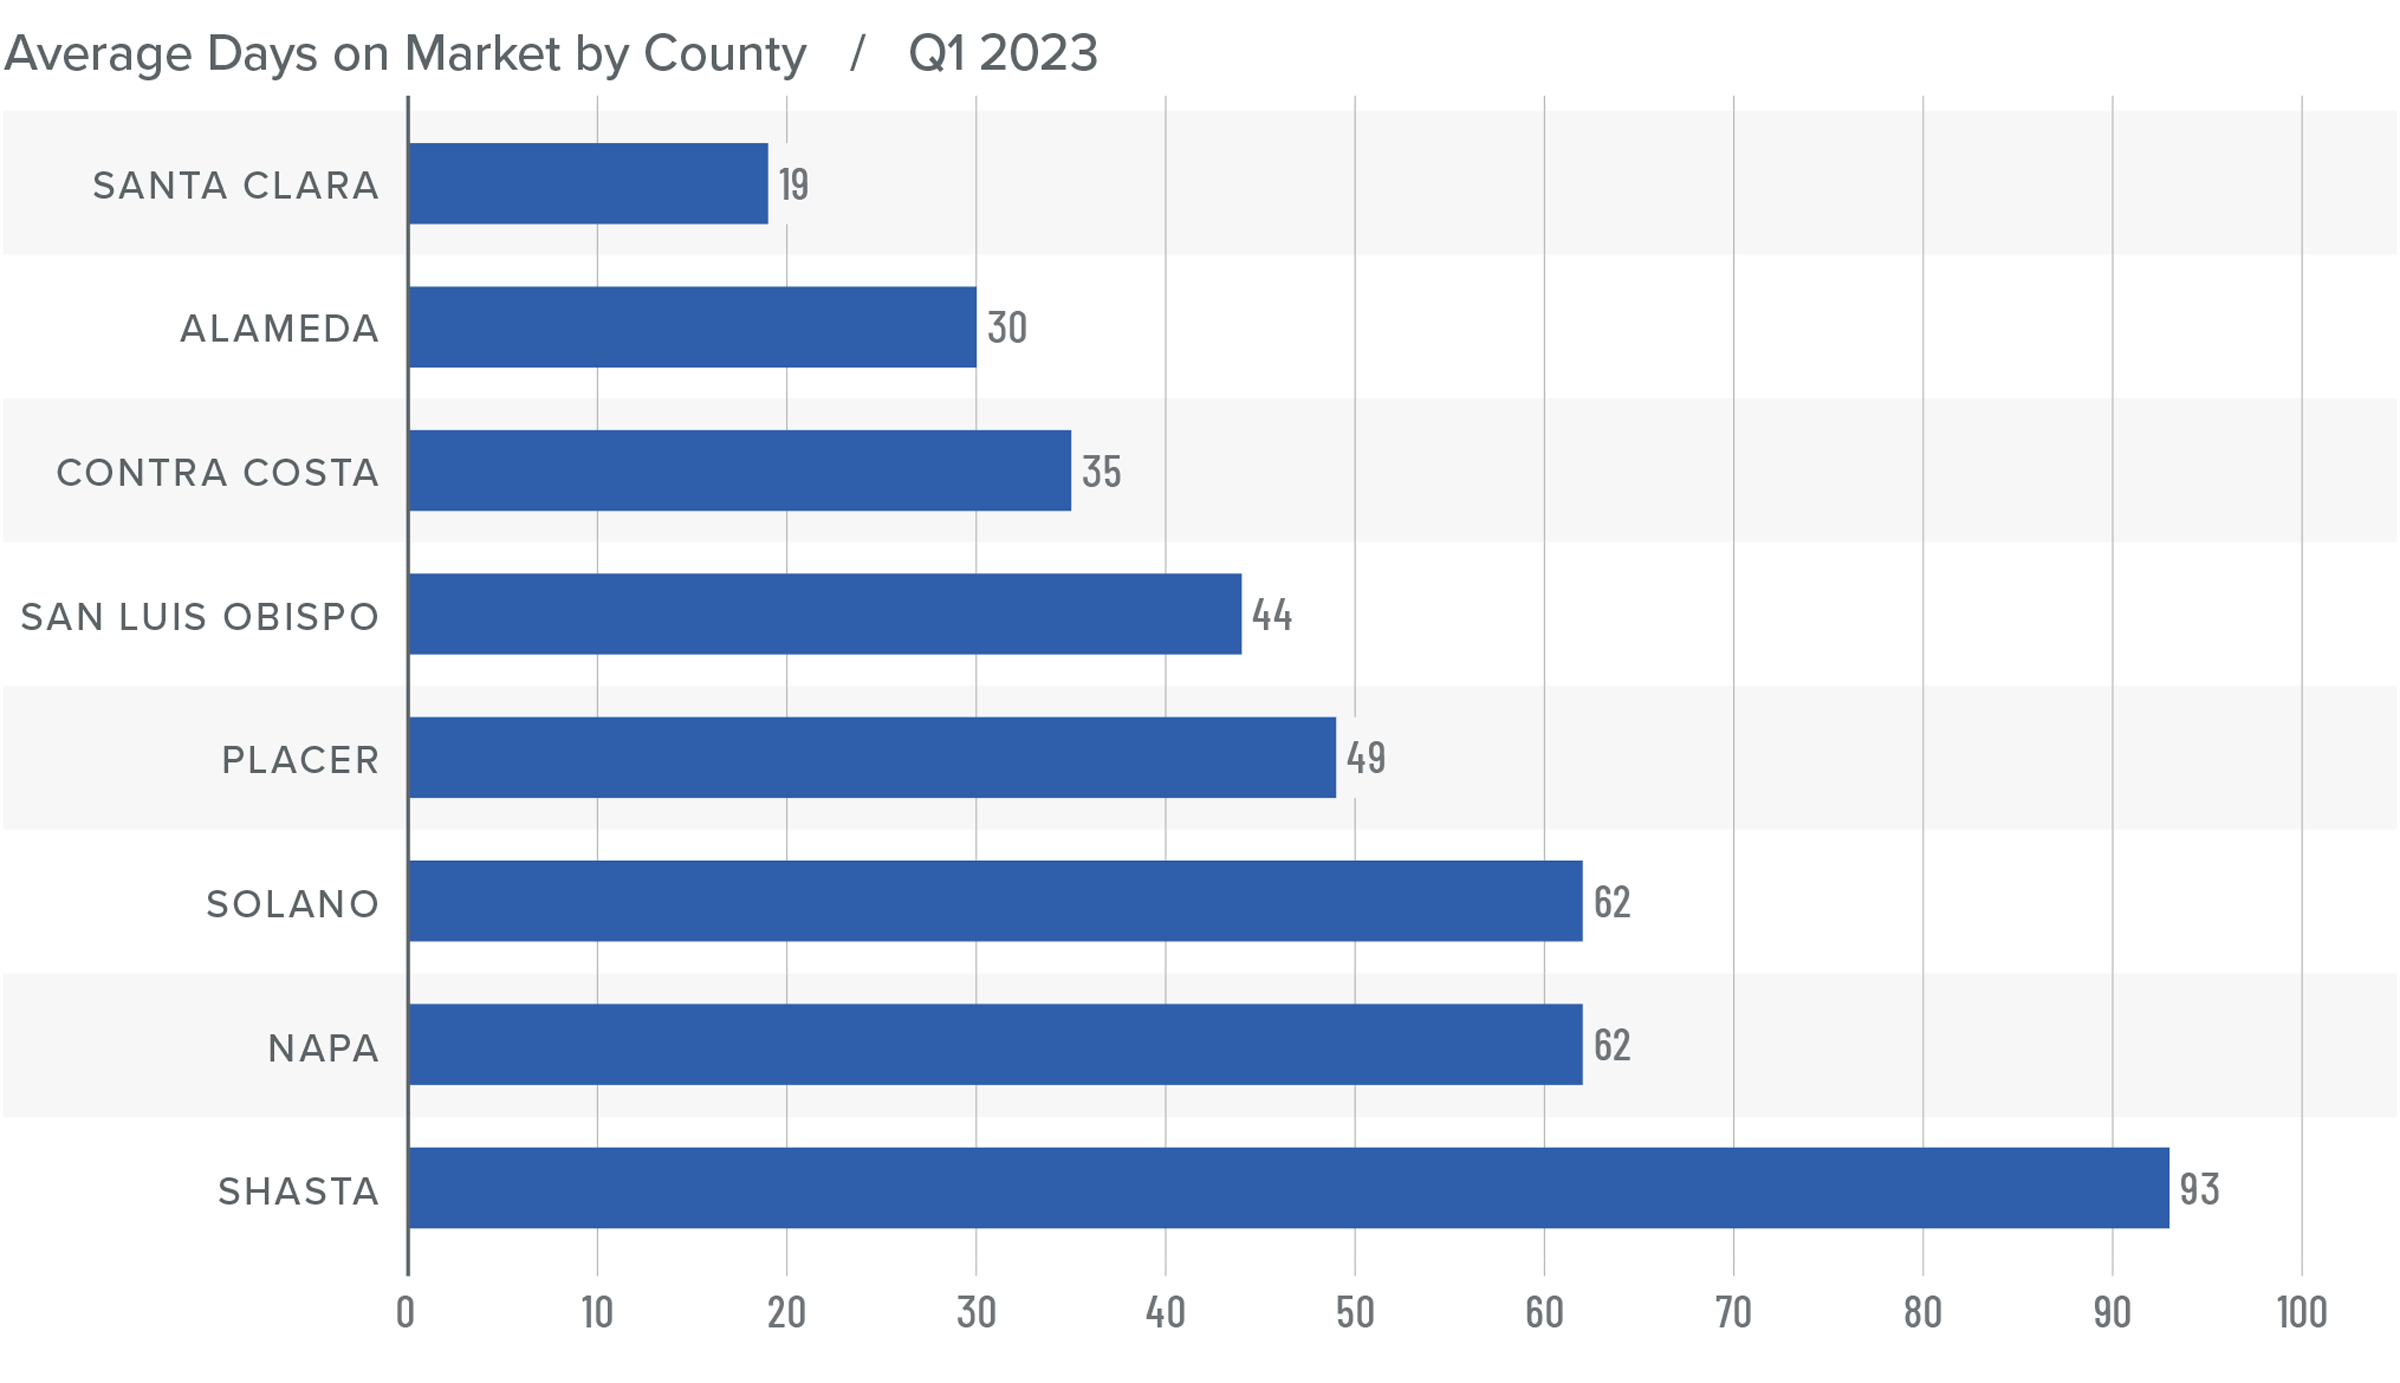
Northern California Days on Market
❱ The average time it took to sell a home in the Northern California counties in this report rose 17 days compared to the first quarter of 2022.
❱ Compared to the first quarter of 2022, the length of time it took to sell a home rose across the region. Compared to the fourth quarter of 2022, market time rose across all counties except Alameda County, where it remained static, and Santa Clara County, where it fell by three days.
❱ It took an average of 49 days to sell a home in the first quarter of 2023, which was 6 more days than in the fourth quarter of last year.
❱ Even faced with fewer homes on the market, buyers are being wary. I expect they will continue to feel this way until either they believe that a floor in prices has been found, or mortgage rates drop to a point where it becomes compelling to make a buying decision again.
Conclusions
This speedometer reflects the state of the region’s real estate market using housing inventory, price gains, home sales, interest rates, and larger economic factors.
Growth in the job market continues to slow, which is likely a contributing factor to the slowing real estate market, especially in areas that may be shedding a significant number of tech jobs. That said, buyers are still out there but they are looking for deals and are clearly prepared to wait it out. Moving forward, I believe that the worst of the price drops may be over in some of the Northern California markets covered by this report, but the region as a whole has yet to find a firm foundation in respect to home values upon which it can build.
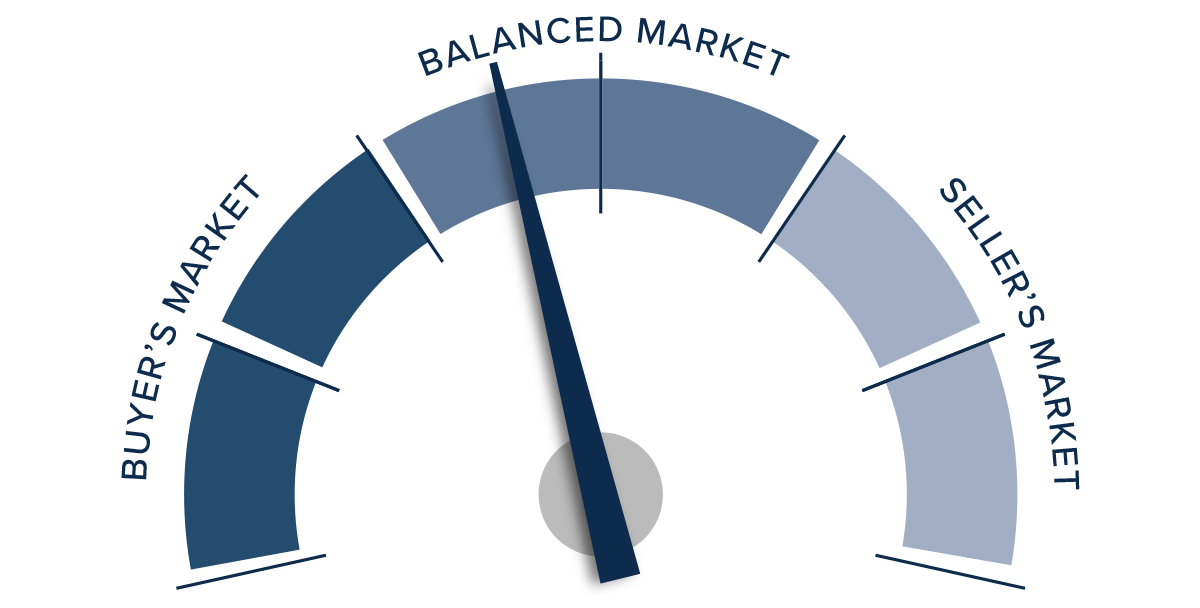
That said, I expect the market to find its footing later this spring, at which point home prices will stabilize and then start to increase, though at a significantly slower pace than during the pandemic period. Given all that has been discussed here, I am moving the needle further in favor of buyers and into what can best be described as a neutral position.
About Matthew Gardner

As Chief Economist for Windermere Real Estate, Matthew Gardner is responsible for analyzing and interpreting economic data and its impact on the real estate market on both a local and national level. Matthew has over 30 years of professional experience both in the U.S. and U.K.
In addition to his day-to-day responsibilities, Matthew sits on the Washington State Governors Council of Economic Advisors; chairs the Board of Trustees at the Washington Center for Real Estate Research at the University of Washington; and is an Advisory Board Member at the Runstad Center for Real Estate Studies at the University of Washington where he also lectures in real estate economics.
")


