It’s natural for sellers to want to get every step of the selling process right, but a successful home sale depends on an accurate listing price. Your agent will work closely with you to set the price, but in the meantime, you can use the following information to better understand what goes into this process.
Nothing can replace the professional knowledge and local expertise of a real estate agent, but automated valuation models (AVMs) can be a helpful first step in determining what your home is worth. Like comps, AVMs assess your home by comparing its information with the listings in your area. Windermere’s Home Worth Calculator evaluates your property and the surrounding market to give you an idea of how much it’s worth. Try it here:
What factors influence home prices?
Understanding what factors influence home prices will give you a deeper knowledge of the market, give clarity to the selling process, and help you work with your agent to accurately price your home.
Comparable Home Sales
Comparable home sales—or “comps”—have a major impact on the price of your home. Comps refer to the comparable homes in your area, both pending and sold, within the last six months. Your Windermere agent can provide you with a Comparative Market Analysis (CMA) to better determine the price of your home. CMAs factor in aspects such as square footage, age, and lot size compared to other homes in your area, to determine how your home should be priced among the competition.
Your Home’s Location
Naturally, your home’s location plays a significant role in its asking price. Depending on the market conditions in your area, whether you reside in a metropolitan, suburban, or rural location, and the home’s proximity to amenities, schools, and entertainment all contribute to the price.
If you have recently invested in upgrades or other remodeling projects for your home, they could increase your asking price. However, the price increase potential depends on the kind of renovation, its ROI, and how valuable it is to buyers in your area. If the home needs repair, it will likely generate less interest from buyers than better maintained homes at your price point. Any outstanding repairs or projects looming overhead will make the home less attractive to buyers and could lead to a low appraisal.
Seasonality
Any factors that impact market supply and demand are worth taking into consideration when preparing to price your home, and seasonality is one that cannot be overlooked. Typically, market activity slows in the winter and picks up during the spring and summer months. However, market seasonality varies region to region. Talk to your Windermere agent about the seasonality trends in your area and how they factor into your asking price.
Market Conditions
Naturally, all sellers want to price their home competitively, but what a competitive price looks like depends on the market conditions, such as whether it’s a buyer’s or seller’s market. Some sellers think that pricing their home over market value means they’ll sell for more money, but the opposite can often be true. Overpricing your home presents various dangers such as sitting on the market too long, which can result in selling for well below what it’s worth.
Periodic Price Adjustments
Pricing a home isn’t a set-it-and-forget-it proposal. As with any strategy, you need to be prepared to adapt to fast-changing market conditions, new competition, a lack of offers, and other outside factors.
These are the basic tenets for understanding what goes into the price of a home. When you’re ready, a Windermere agent will interpret and expand on this information, perform a CMA for your home, and guide you throughout your selling journey.
When you own your living space, it’s natural to feel attached to every square inch. But for renters, creating that sense of ownership is a unique challenge. Whatever limitations you face as a renter in how you’re able to make alterations, it’s no less important to your home life for your space to convey a sense of ownership and self. To make a rental unit feel a bit more like home, we collected a few ways to imbue your abode with your own spirit, without risking your security deposit.
Designing Your Rental to Feel Like Home
Storage
Sufficient storage space is a common shortcoming of rentals, leaving renters in a position where they either need to invest in a public storage space or get creative at home. But even getting creative at home can be tough, since most rental properties have limitations on what renovations and customizations renters are able to make, especially if the property is governed by a Homeowners Association (HOA).
Shop around for freestanding bookshelves, baskets, or use under-the-bed storage bins to free up additional space and declutter the areas of your home where items are stacking up. Search for furniture that doubles as storage, like an open-top ottoman or a side table with a drawer or shelf.
Blinds and Curtains
How you decorate your windows can greatly personalize your rental. Consider swapping out your blinds for curtains to add a splash of color and a more regal aesthetic to your living space. But don’t be too quick to throw away your blinds—you may not get your entire security deposit back! Before making these kinds of changes, or adding hardware like curtain rods, be sure to ask your landlord for permission.
When decorating, it’s the smaller things like pillows, throws, candles, and books that will really tie your home together and make it feel unique to you. If you’re able to change your light fixtures, it can make a world of difference. Find the right lighting by thinking about what temperature of light appeals to you, and whether you want accent, task, or ambient lighting.
Gallery Wall
Hanging up your art collection with hooks and nails can damage the walls, so be sure to use a stud finder to make the process of creating a gallery wall easier. And besides, when you’re preparing to move out, a few hanging holes from nails and screws is nothing that a little spackling paste, a putty knife, some sandpaper, and a new coat of paint can’t fix.
Again, ask your landlord before you add any holes in the home. When you’re touring, ask the landlord to keep the existing holes in the walls so you can use them, or ask if you can get the paint color information so you can patch and make touch ups yourself. Many landlords keep matching wall and trim paint on hand for such instances.
If your flooring is worn, cracked, or damaged in any way, there’s likely little you can do to replace it other than documenting the damage and running it up the flagpole. Fortunately, you have carte blanche to decorate with carpeting as you please. Carpets also serve as a protective layer to avoid further damage to your floors during your tenancy.
Bolder rug materials like shag, tufted cotton, and wool will automatically make your space cozier. If your choice in carpeting is more driven by style, consider vibrant colors, bold patterns, or geometric area rugs to spice things up.
An integral part of the formula to successfully buying a home is securing the correct amount of financing. Once you’ve found the home you’d like to pursue, one of your primary tasks is exploring different loan products to see which best fits your situation. Eventually, you’ll come to a fork in the road where you’ll need to decide between a fixed-rate mortgage and an adjustable-rate mortgage (ARM). The following information will help you gain a better understanding of ARMs to help you decide whether they’re right for you.
What Is an Adjustable-Rate Mortgage (ARM)?
After your down payment, your mortgage will finance the remainder of your home purchase. Whereas fixed-rate mortgages allow you to lock in a specific interest rate and payment for the life of your loan, adjustable-rate mortgages’ interest rates will fluctuate over time, thus changing your loan payment. It’s typical for ARMs to begin with a low introductory interest rate, but once that first stage of the loan has passed, they will begin to shift up and down. ARMs generally have a cap that specifies the maximum rate that can occur for that loan.
Let’s say you secure an adjustable-rate mortgage with 30-year terms, the first five of which are at a fixed rate. When the variable interest portion of the loan kicks in, your mortgage’s fluctuations will be measured against an index. If the index is higher than when you secured the loan, your rate and loan payment will go up—and vice versa. How often your ARM rates change depends on your agreement with your lender. Talk to your mortgage broker to learn more about the characteristics of adjustable-rate mortgages.
Different Types of Adjustable-Rate Mortgages (ARMs)
Payment-Option ARM: You’ll have flexibility to choose your monthly payments with a payment-option ARM, including interest-only payments and minimum payments that don’t cover interest. These loan products can get home buyers into hot water quickly when rates increase.
Interest-Only ARM: With an interest-only ARM, you pay just the interest on the loan for a specified introductory period, then the principal payments kick in on top. The longer the introductory period, the higher your payments will be when the delayed principal payments enter the equation.
Hybrid ARM: As outlined above, a hybrid ARM begins with a fixed-rate introductory period followed by an adjustable-rate period. Typically, a hybrid ARM’s fixed-rate period lasts anywhere between three to 10 years, and its rates adjust at an agreed-upon frequency during the adjustable-rate period, such as once every six months or once a year.
Pros and Cons of an Adjustable-Rate Mortgage (ARM)
Pros
Cons
The low introductory rate allows you to save money and plan for when the adjustable-rate period kicks in.
If you plan to live in the home for a long time, a fixed-rate mortgage may be a better option.
If you plan on selling in a few years, you can use the proceeds to pay back your mortgage before the fixed-rate period ends.
Without knowing what will happen to interest rates, your monthly payments could become unaffordable.
If the index decreases over time, you could end up with a lower interest rate and monthly payments.
Financial planning is more difficult with an ARM, since there’s no telling what your monthly payments will be one year to the next.
Home Monthly Payment Calculator
To get an idea of how your mortgage payment will fit into your budget, use our free Home Monthly Payment Calculator by clicking the button below. With current rates based on national averages and customizable mortgage terms, you can experiment with different values to get an estimate of your monthly payment for any listing price.
For more information on financing your next home purchase, connect with an experienced, local Windermere agent.
This video is the latest in our Monday with Matthew series with Windermere Chief Economist Matthew Gardner. Each month, he analyzes the most up-to-date U.S. housing data to keep you well-informed about what’s going on in the real estate market.
Hello there, I’m Windermere’s Chief Economist Matthew Gardner and welcome to this month’s episode of Monday with Matthew. A little while ago, a housing analyst was being interviewed about the current state of the residential market and they suggested that the country is in a “housing recession.” Well, needless to say, this got a lot of attention from the media and the public at large—for obvious reasons.
Any time the word “recession” is mentioned we almost subliminally cast our minds back to 2007. And when the word “recession” is combined with the word “housing,” then panic starts to set in with flashbacks of headlines about burgeoning housing supply, plummeting home prices, and surging foreclosures.
As this is a topic being discussed by many across the country right now, I wanted to share with you my opinion as to whether the phrase “housing recession” is an appropriate one when describing today’s market.
So, what is a recession? To answer this, I will turn to my trusted Oxford English Dictionary, and this is how they describe that word.
Definition of a Recession
Image Source: Matthew Gardner
Recession:
a difficult time for the economy of a country, when there is less trade and industrial activity than usual, and more people are unemployed
the movement backward of something from a previous position
Well, how do we use these definitions when it comes to the ownership housing market?
I guess that “less trade” could mean lower sales and we have certainly seen sales pull back. “Movement backward” could be how someone might describe the fact that sale prices have been pulling back in many markets across the country.
But although some may say that we really are in a housing recession given the definition of the word, is it really accurate? Are we are inextricably headed down a road that leads to the bursting of some sort of bubble as we all remember from 2007? I don’t believe we are. To explain my thinking let’s start out by looking at housing supply.
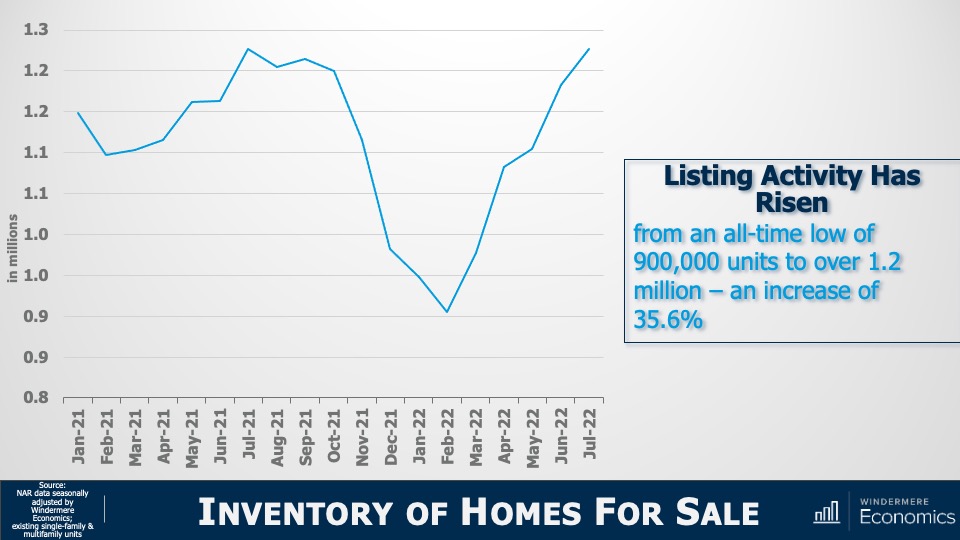
Inventory of Homes for Sale
Image Source: Matthew Gardner
Yes, listing activity is up—can’t argue with that—with the number of resale homes for sale jumping by more than a third from the start of this year. But there’s more to it than that. You see, we have to look a little further back to better understand what’s really going on.
And to do this, let’s check out the number of homes for sale during the first seven months of this year and compare those numbers to the same periods in 2018 through 2021.
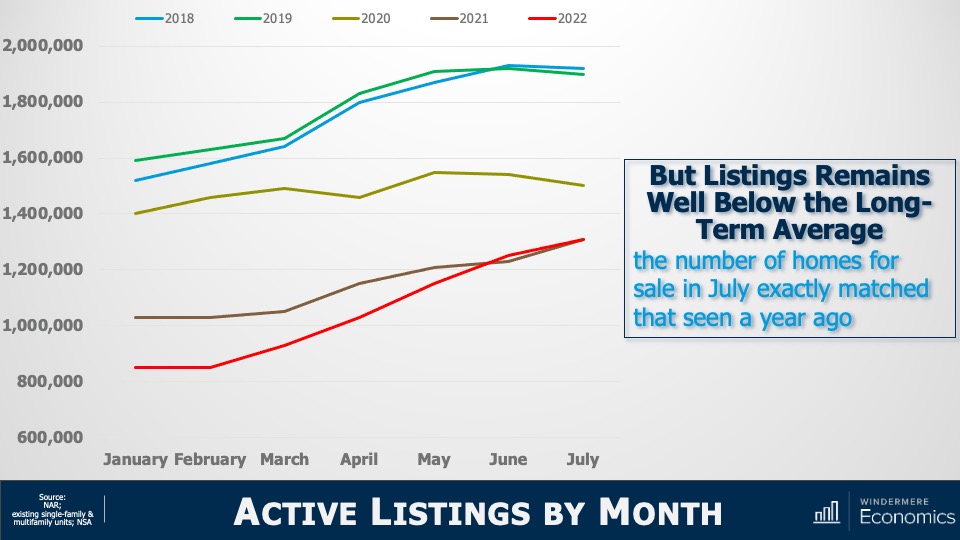
Active Listings By Month
Image Source: Matthew Gardner
I don’t know about you, but this doesn’t look like a chart showing a massively oversupplied market! The number of homes for sale in July of this year was almost exactly the same as we saw last July and is still well below the levels seen in 2018, 2019, or 2020.
Sure, listings are up. But are we at levels that will cause prices to tumble? Remember that it was a massive increase in the number of homes for sale that led to the housing bubble bursting back in 2007. Listings peaked at almost 3.9 million units in 2006; but today there are 2.6 million fewer units on the market than we saw back then. Now that we’ve seen that supply isn’t at concerning levels, let’s look at demand.
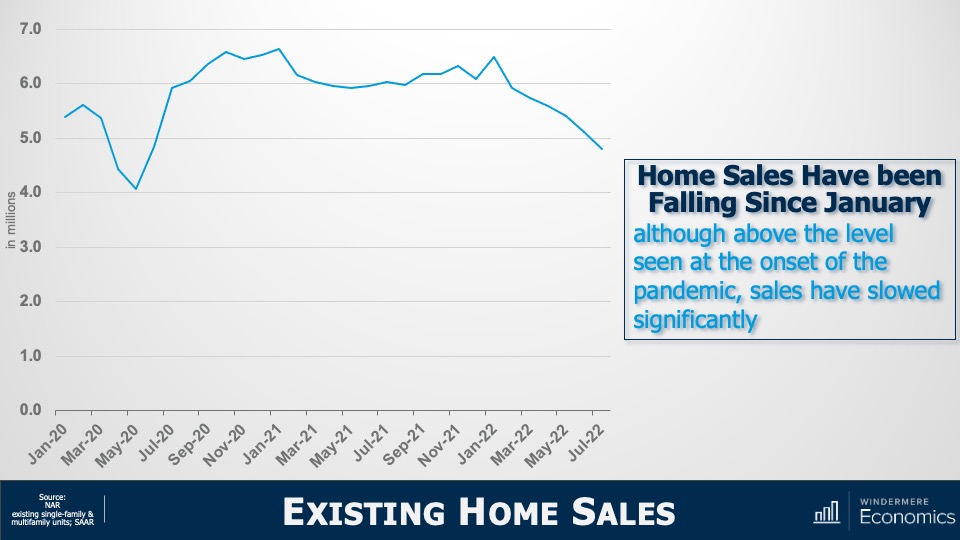
Existing Home Sales
Image Source: Matthew Gardner
This chart doesn’t look too good. On an annualized basis, sales have been pulling back since the start of the year but that’s not the full story. Let’s look at this in a slightly different way.
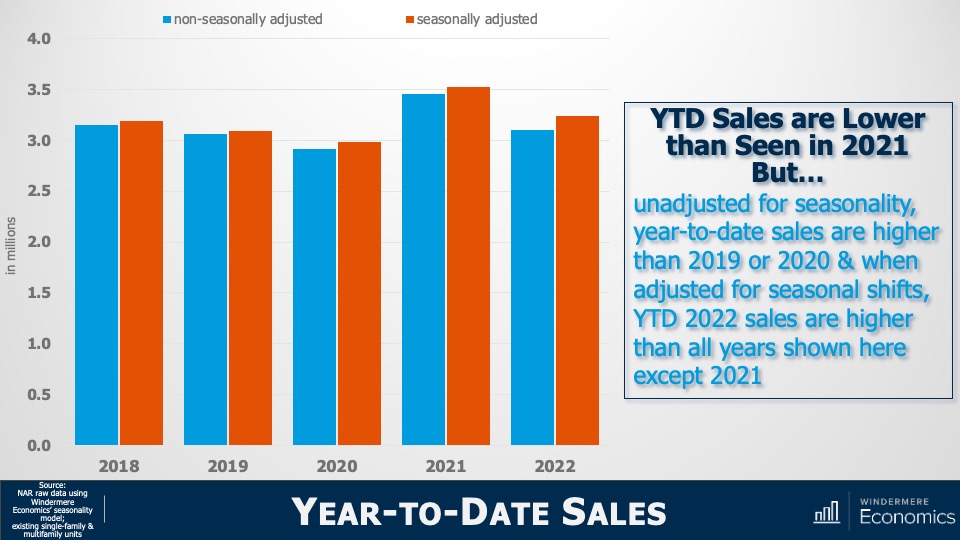
Year-to-Date Sales
Image Source: Matthew Gardner
The bars here show year-to-date sales through July—both adjusted and unadjusted for seasonality—and although unadjusted sales so far this year are lower than we saw during the first seven months of 2021, they are at about the same level as we saw in 2018 and are higher than in 2019 or 2020.
But when we adjust the monthly sales data for seasonality, year-to-date sales in 2022 were higher than all years shown here other than 2021.
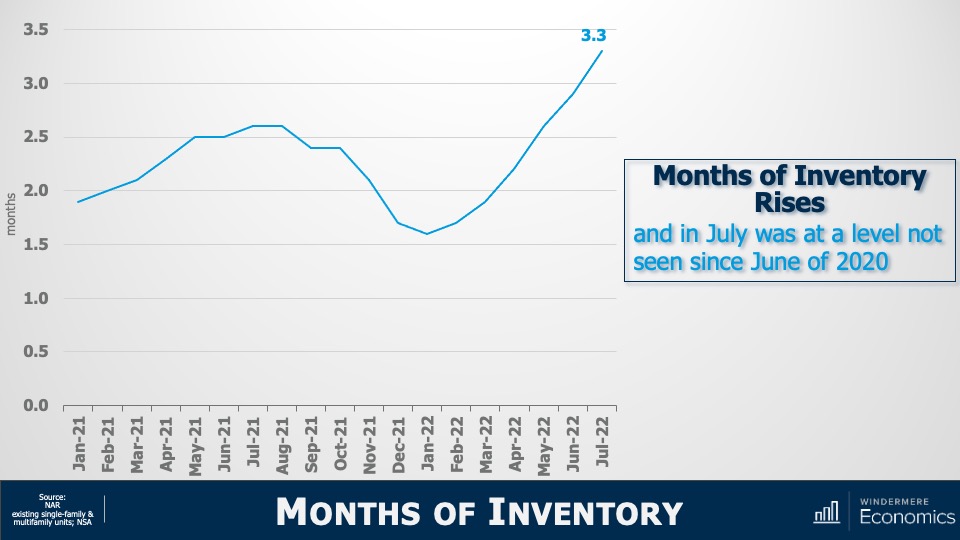
So, although sales have fallen, it appears to me that we are heading back to a more realistic market rather than one that is hemorrhaging. Yet another indicator we need to consider when examining the market for evidence of some sort of recession are months of inventory , which shows how long it would take to sell every home for sale using the current monthly sales pace.
Months of Inventory
Image Source: Matthew Gardner
This graph shows that it would take three months to sell every home on the market given the sales we saw in July. That is quite a jump from the January pace but, again, perspective is everything.
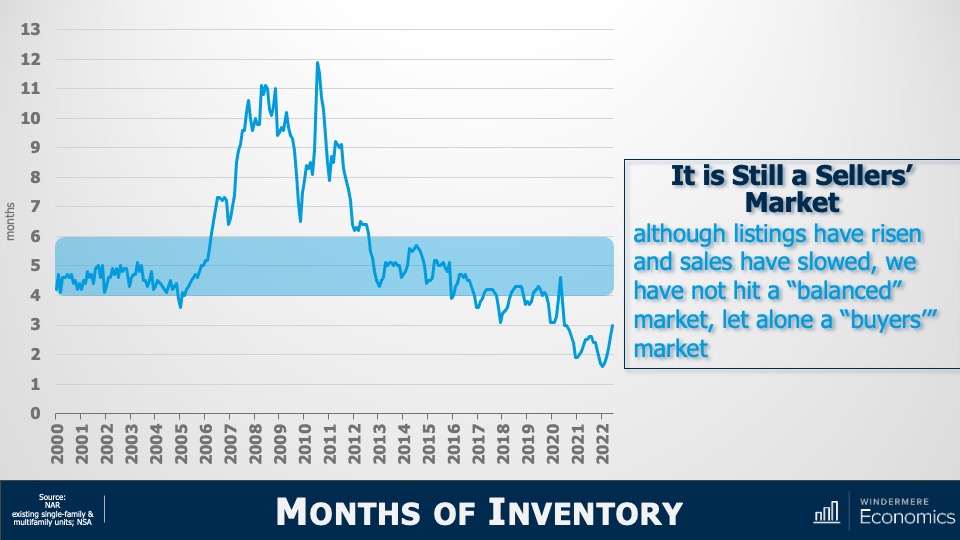
Months of Inventory: Seller’s Market
Image Source: Matthew Gardner
At three months, it is still a seller’s market. It’s generally accepted that the definition of a seller’s market is any number below four months; a balanced market is four to six months of inventory, and a buyer’s market is when the month of inventory is above six.
And a simple bit of math shows us that, for the market to shift from favoring sellers to favoring buyers, the number of homes for sale must break above two million—which we haven’t seen since 2015—and monthly sales would have to drop to below 300,000. We’ve only seen that happen three times in history: November 2008, and again in July and August of 2010.
Yes, listings are up, and sales are down. There’s no denying it. But, again, does the data justify the term recession? My answer would be no. But, if you’re still not convinced, let’s turn our attention to sale prices. I think that might help make things even clearer.
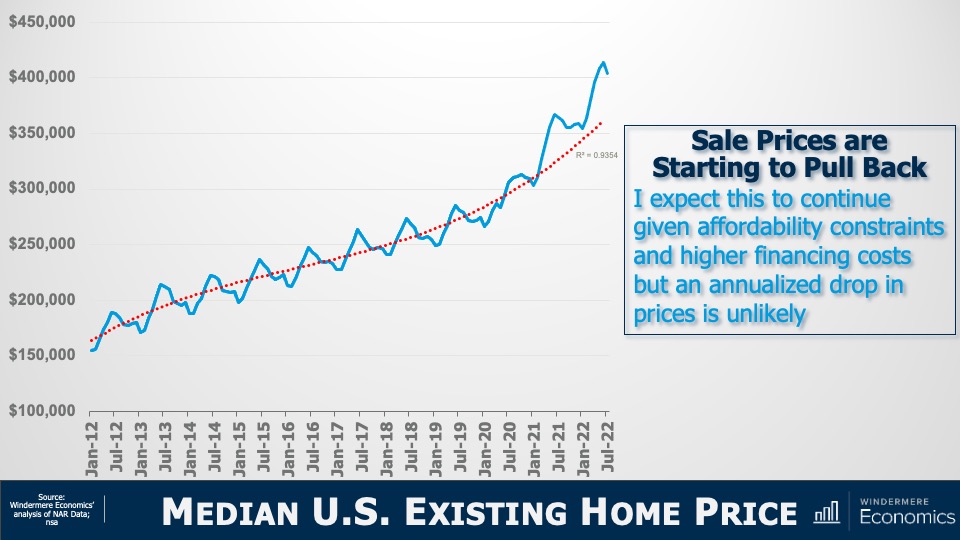
Median U.S. Existing Home Price
Image Source: Matthew Gardner
The solid line represents the median sale prices of homes over time and the dotted line shows the trend. You can clearly see that we started breaking away from the trend line in early 2021 and that’s not at all surprising as it started the month after mortgage rates hit their historic all-time low.
But today’s financing costs are significantly higher, and prices have started to slide. Although I certainly expect that we will see sale prices fall further, it appears to me as if they are simply moving back to the long-term trend, and not collapsing.
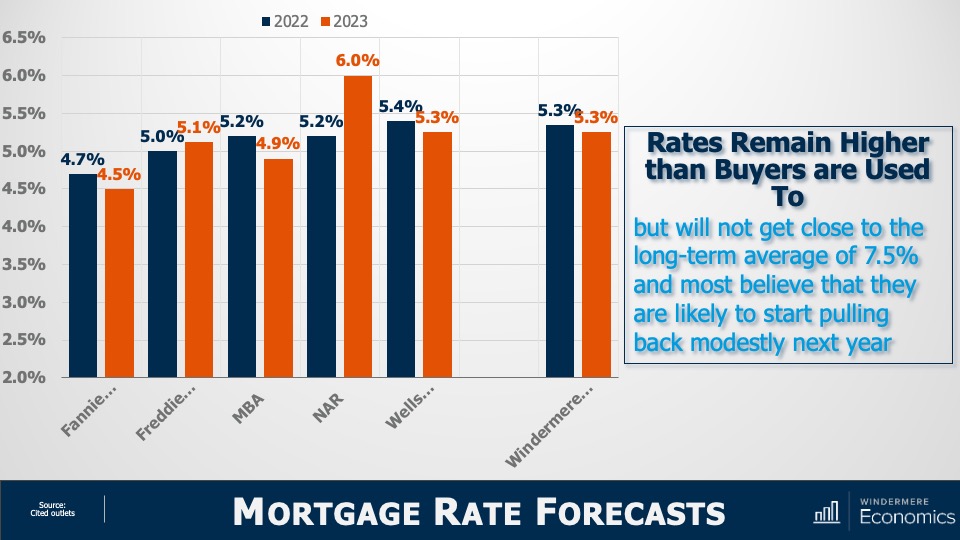
Mortgage Rate Forecasts
Image Source: Matthew Gardner
With mortgage rates doubling from their 2021 lows, downward pressure on sale price was to be expected. But will they—as some think—rise to a level that will cause home prices to plummet? To answer that, here are the forecasts of several associations. You’ll see that all, bar the National Association of Realtors and Freddie Mac, see rates pulling back—albeit modestly—in 2023.
Of course, all these are annual averages and today’s rates are higher with the latest Freddie Mac data showing the average 30-year fixed rate above 6%—a level we haven’t seen since 2008.
However, economists including myself find it unlikely that rates will continue rising significantly from where they are today. The mortgage market is certainly in a bit of disarray right now with the yield curve inverting, but that should correct itself by early next year and that’s why we generally expect rates to start pulling back from their current levels by the start of 2023.
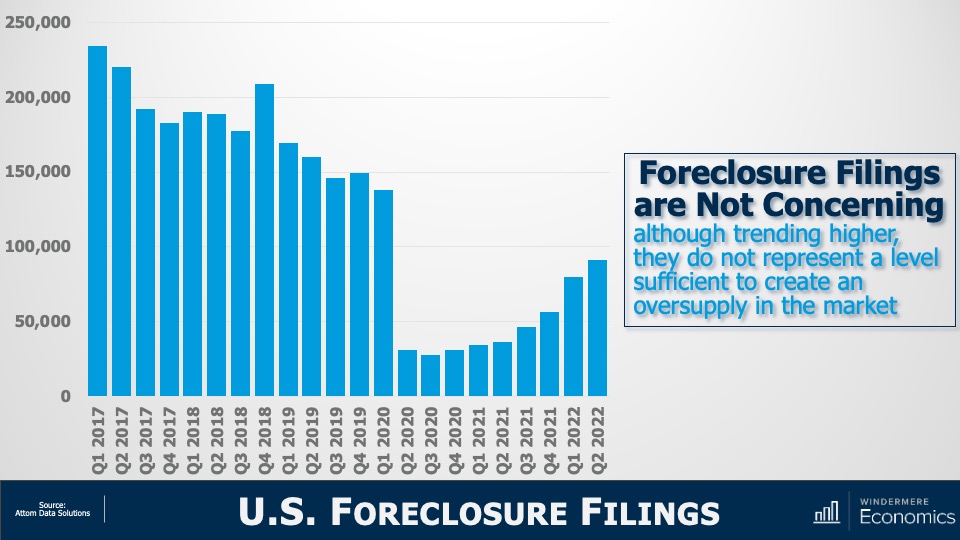
But if rising rates are triggering memories of 2008, you wouldn’t be alone. There are some expecting that the spike in rates will trigger a surge in foreclosures and that will doom the market. But as you see here, although foreclosure filings have certainly risen, they are still remarkably low compared to historic standards.
U.S. Foreclosure Filings
Image Source: Matthew Gardner
In the second quarter, newly delinquent mortgages represented just 1.9% of all mortgages outstanding1 and that’s the lowest share the market has seen since 2006. Although I do expect the number of homes being foreclosed on will rise as we move into 2023, I just don’t see it getting to the levels necessary to materially impact the market. And a big part of the reasoning behind my thinking is this:
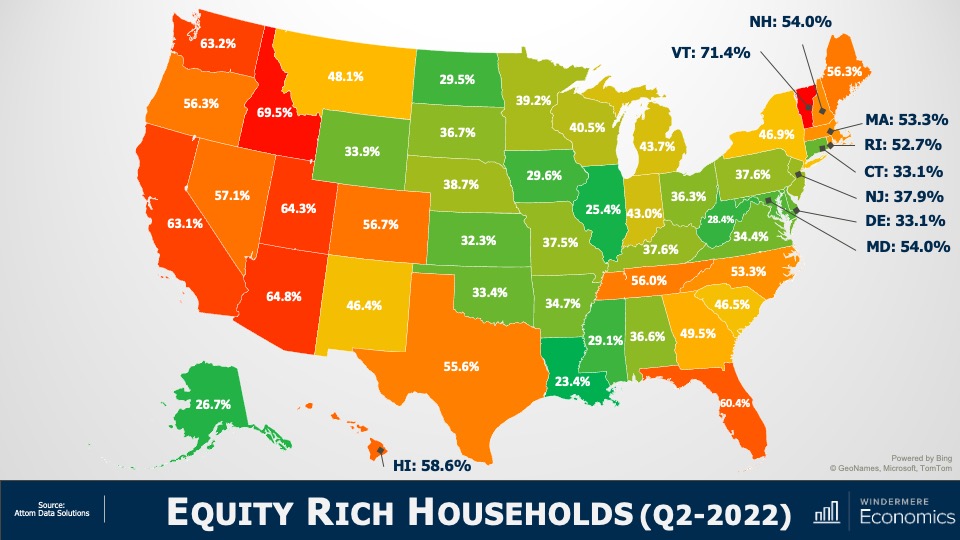
Equity Rich Households (Q2 2022)
Image Source: Matthew Gardner
In the second quarter of 2022, over 48% of homeowners with a mortgage were sitting on more than 50% equity.
Simply put, for enough homeowners to be put in a negative equity situation that would lead them to enter foreclosure and materially damage the market, home prices across the country would have to fall by a percentage greater than we saw during the market crash. And I just don’t see this happening.
The word “recession” has many connotations, and when it’s used to describe the housing market, it can engender a significant level of panic. So, I will ask you all. Given the data I have showed you today, do you think that we are in a housing recession?
Yes, supply levels have risen. But they are still relatively low when compared to historic averages and with builders slowing construction activity to a crawl, it’s unlikely that housing supply will grow much organically. Over the longer term, I believe that the supply of resale homes for sale will remain below historic averages. I say this for one simple reason: mortgage rates.
In 2020, a record number of households refinanced their homes to take advantage of the mortgage rates that had been plummeting. And in 2021, over six million home buyers got mortgages with rates averaging below 3%.
I would suggest to you that we will not see the number of homes for sale even get back to normalized levels in the mid-term, as many potential sellers will decide not to sell, because if they did, they would lose the never seen before and likely never to be seen again mortgage rate that they currently have.
Of course, there will be sellers who have to move because of factors such as job relocation, death, or divorce, but I would contend that listing activity may well be tight for a long time. And if supply remains below the level of demand, the market is further protected.
And as far as demand goes, let’s not forget that the age makeup of the country suggests that we will see a lot more potential buyers as Millennials and Generation Z mature, with current numbers suggesting significant buyer demand for the next two decades.
As for sale prices, I still believe (as do almost all economists) that the median home price next year will be higher than we will see this year, but a very significant drop in the pace of sales growth is likely as we trend down to historic averages.
Of course, all real estate is local and there are markets across the country that will see prices drop in absolute terms. But even in the most highly susceptible markets, it will be a temporary phenomenon. By 2024, homeowners in these markets will see the value of their homes start to rise again.
I’m going to leave you with my quote to describe today’s market today and it’s that we are in a “housing reversion,” NOT a housing recession.
As always, I’d love to hear your comments on my thoughts so feel free to reach out. In the meantime, stay safe out there and I’ll see you all again next month.
1: New York Fed Quarterly Report on Household Debt and Credit
About Matthew Gardner
As Chief Economist for Windermere Real Estate, Matthew Gardner is responsible for analyzing and interpreting economic data and its impact on the real estate market on both a local and national level. Matthew has over 30 years of professional experience both in the U.S. and U.K.
In addition to his day-to-day responsibilities, Matthew sits on the Washington State Governors Council of Economic Advisors; chairs the Board of Trustees at the Washington Center for Real Estate Research at the University of Washington; and is an Advisory Board Member at the Runstad Center for Real Estate Studies at the University of Washington where he also lectures in real estate economics.
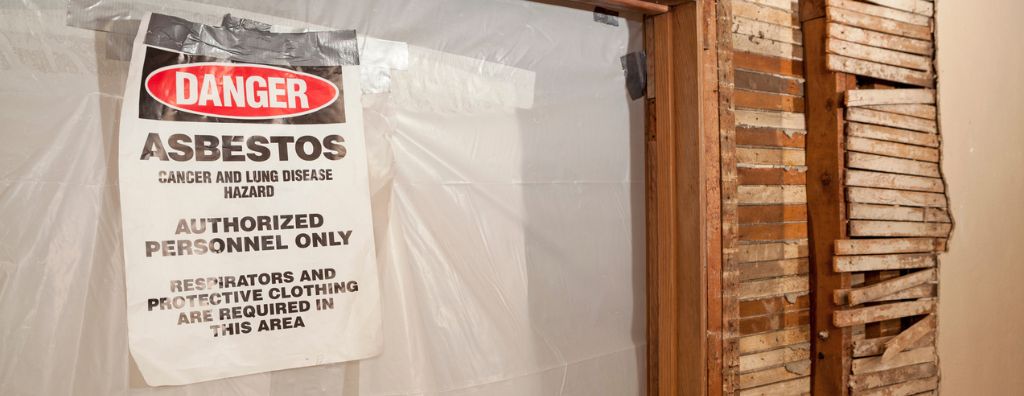
Throughout the mid twentieth century, asbestos was commonly used throughout the homebuilding process. It was typically used as insulation, but would also pop up in vinyl flooring, cement siding, walls, pipes—you name it. After it was discovered that inhaling asbestos fibers has serious health effects, its domestic production slowed, and legislation was put forth to ban it altogether.
However, just like lead paint, homes that were built in the asbestos era still carry a dormant risk. If your home contains asbestos, you should be aware of its dangers, how to handle it, and how to go about removing it safely.
How to Handle Asbestos in Your Home
Having asbestos material in your home is not inherently hazardous if the material is left undisturbed. So, if your asbestos material is intact and in good condition, the best thing to do is to leave it be. However, the moment asbestos material becomes damaged—either from degrading over time or because of a sudden accident—it becomes dangerous. Once asbestos fibers are released, it can spell trouble for you and your household.
Testing for Asbestos
If you find damaged asbestos material, you should cordon off the area to the best of your ability to limit exposure. If restricting the area means you could disturb the asbestos, then it’s best to refrain from interacting with it and let a professional handle it.
DIY asbestos testing is possible, but it can be highly toxic if you don’t take the proper precautions. An asbestos inspector will conduct a thorough examination of your home to determine the extent of its presence and provide their recommended course of action. It is advised to test for asbestos before making an addition or a large-scale remodel to your home.
You can either repair existing asbestos exposure or have it removed. Repairs can be cheaper in the short term but may simply be prolonging the inevitable. Making repairs on your own is generally not recommended, since the slightest mishandling of the exposed asbestos can create a much bigger problem.
When it comes to removing asbestos, you’ll want to enlist the help of a professional. As with any contractor, ask for quotes and make comparisons before deciding who you’ll hire. Before the job is finalized, have your home tested to ensure that all asbestos has been safely removed from the premises.
For more tips on home safety, home maintenance, and avoiding dangers caused by the systems in your home, read our blog post on How to Prevent and Deal with Mold.
Nowadays, home staging is an integral part of the home selling process. The impact of home staging is crystal clear, but how you go about it deserves some consideration. Many homeowners will hire a home staging professional, trusting their expertise to make their home as appealing as possible to buyers. However, if hiring a professional isn’t in your budget, taking a DIY approach to home staging can deliver its own benefits.
7 Tips for Staging Your Home Yourself
1. Declutter
The first rule of home staging: make it tidy! A well-staged home should make potential buyers feel comfortable and at ease. To make that happen, it’s important that the spaces in your home are free of clutter. Consider investing in storage bins or a separate storage space temporarily to pare down the items in your home as much as possible.
2. Deep Clean
To really make your home sparkle, it will need more than a cursory cleaning. On top of your usual cleaning routine, get those hard-to-reach and uncommon spots throughout your home that will make it feel spotless. Putting some elbow grease into your bathroom surfaces, underneath and behind furniture, baseboards, and all switches and handles will make a difference when guests enter your home.
3. Fresh Paint
Not only does adding a coat of fresh paint do wonders for the look of your home, it’s a low-cost, high-ROI investment for a DIY project as important as home staging. Going for neutral colors will help to create balance in your interior while appealing to a wide spectrum of buyers’ tastes. It’s the splashes of color on top of a neutral foundation that will help guide visitors’ eyes from room to room.
You only get once chance to make a first impression on potential buyers visiting your home and upping your curb appeal will give you the best chance of wowing them. Take a trip to your local hardware store and prepare to spend some time working in the front yard. Projects that improve the look and quality of your lawn, flower beds, walkways, outdoor lighting, windows, and trim will impress buyers and can increase the value of your home.
5. De-Personalize
Once a buyer pulls up to your property, you want to give them every opportunity to imagine themselves in the home. That’s why it’s important to de-personalize your interior and let them fill it with their own imagination. Remove all family photos, notes, personal gifts, and the like from your home. Aim for a décor style that’s not too ornate and not too bland—think calm, simple, and clean.
6. Focus on Accents
Once you’ve applied fresh paint, boosted your curb appeal, and de-personalized your home, you’re ready to add décor accents. Again, the most important thing is that buyers feel comfortable in your home, so your accents should reflect that notion. Add area rugs that are inviting but not too loud, keep freshly folded towels in the bathroom, and consider adding house plants throughout your spaces to make them feel natural.
7. Design Hacks
A few key design hacks will help you round out your DIY home staging project. If you’re struggling with making the smaller spaces in your home feel comfortable, try adding a mirror. Mirrors help to reflect light and can help narrow or cramped spaces feel bigger. Arrange your living room furniture in a way that emphasizes the room’s dimensions. Since you’re designing your home with open houses in mind, the TV no longer needs to be the focal point of the living room.
For more information on preparing to sell your home, helpful tips on working with an agent, moving checklists, and more, visit our Seller Essentials Home Selling Guide.
Featured Image Source: Getty Images – Image Credit: PC Photography
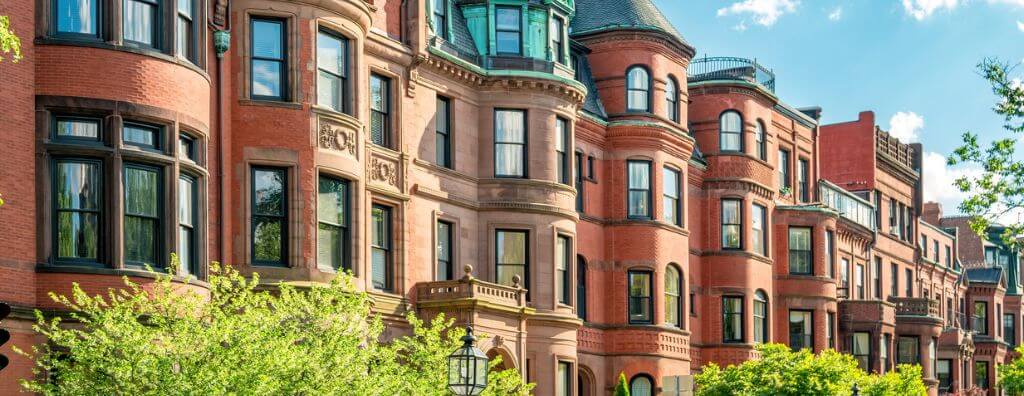
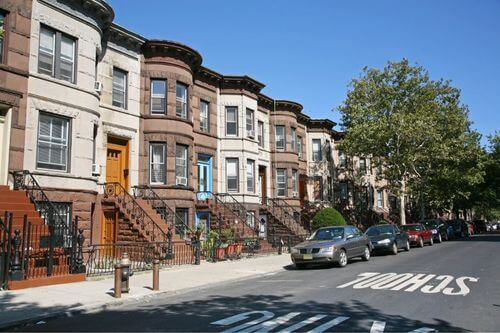
Of all the alternatives to single-family detached homes that remain popular today, row houses may have the longest history. Some of the oldest and largest cities on the East Coast such as New York City, Boston, and Philadelphia still have row houses in great numbers. These iconic structures have served as the backdrop for some of America’s most beloved TV shows, including Full House and Cheers. Given their storied history and prime location, row houses represent the best of the past and the present in home design.
History of Row Houses
Since their beginning in the early 1600s, row houses have presented an economical solution to housing for home builders. They allowed builders to divide a plot of land into different living units that increased the number of tenants on the property. In the 19th and 20th century, the easy-to-build and inexpensive nature of the housing style fit the building demands of the era, and they proliferated throughout what are now some of the country’s most popular metropolitan areas.
Difference Between Townhouses and Row Houses
There are slight differences between townhouses and row houses. Row houses share a common façade along a street, whereas townhouses may be grouped throughout a development. Row houses have a consistent roofline and share a common wall, whereas townhouses may not adhere to the same uniformity of height and width.
Both types of housing may be governed by a Homeowners Association (HOA), which lays out guidelines for property upkeep and maintenance, enforces restrictions on making addition/remodels, and charges monthly fees that go toward the community’s shared spaces, property maintenance, and amenities.
One well known variety of row houses is the “brownstone.” As the name suggests, brownstones’ signature exterior is a mixture of sandstone that produces a dark brown color. Brownstones are commonly found in historic districts throughout New York City, such as Brooklyn, Manhattan, and Harlem.
Row houses, along with duplexes, courtyard apartments, and other similar housing types, were constructed in great numbers prior to World War II but are now far less commonly built. The term “Missing Middle” was first coined by Opticos, a team of urban designers and strategists who realized that this type of housing was largely missing in today’s market. In an episode of Monday with Matthew, Windermere Chief Economist Matthew Gardner explained how these “missing middle” housing types can improve housing affordability:
“And the key function of this type of housing is to meet the rising demand for walkable neighborhoods, respond to changing demographics, and provide housing at different price points. You see, rather than focusing on the number of units in a structure—think high rise apartments or condominiums—this type of housing emphasizes scale and heights that are appropriate for and sympathetic to single-family or transitional neighborhoods.”
For more information on the various architectural housing styles, visit our Architectural Styles page.
Featured Image Source: Getty Images – Image Credit: benedek
Imagine the process of financing a home purchase as a relay race. From start to finish, the baton must be passed several times between interconnected transactions. The down payment plays an important role in the relay race and will help you cross the finish line, but how much money do you put down? And when do you make the down payment? Understanding its characteristics will help you see where it fits in the home buying process.
What is a down payment?
The down payment is a large payment made upfront to help fund a home purchase. Unlike the financing obtained through a mortgage loan, the down payment comes out of the buyer’s pocket, not from a lender.
For example, let’s say the house you want to buy is priced at $500,000. If you put $25,000 down, or five percent of the purchase price, that would leave $475,000 you’d need to pay for with a mortgage. If you put down $100,000, or 20 percent, that would leave a $400,000 mortgage principal. In general, a higher down payment equates to a lower interest rate since that financial structure is viewed as less risky by lenders. It also means your monthly payments will be lower since your loan balance is smaller.
However, making a large down payment isn’t feasible for everyone. In fact, according to the National Association of REALTORS® Profile of Home Buyers and Sellers1, the typical down payment was seven percent for first-time home buyers and 17 percent for repeat buyers in 2021. If you’re not able to put down 20 percent of the home’s purchase price, your lender will typically require that you obtain Private Mortgage Insurance (PMI), which protects them against the possibility of a mortgage default. The benefit of PMI is that it creates a pathway to homeownership by allowing you to move in and start building equity right away.
Different loan products have different down payment requirements. Conventional loans have a minimum down payment requirement of three percent, while government-backed loan products like VA loans or USDA loans may allow you to purchase a home with no money down if you qualify.
Down Payment: Home Monthly Payment Calculator
As you prepare to buy a house, it’s helpful to see what you can afford. Your down payment will have a direct impact on your loan terms and your monthly mortgage payment. Use our Home Monthly Payment Calculator to experiment with different down payments, principal amounts, interest rates, taxes, and more for any listing price.
Though your lender will need to verify that you have the funds available to make your down payment early on in the mortgage approval process, the down payment is officially due at closing. Saving up for such a payment may seem like a daunting task, but with the right planning, you’ll make steady progress. Having a strategy in place for compiling your down payment is a telltale sign that you’re ready to buy a home. Here are some methods of generating savings to consider:
Consider downsizing to reduce your living expenses and increase your savings over time.
Reduce your debt before applying for a mortgage to give yourself a better shot at favorable mortgage terms—i.e., a lower down payment requirement and reduced interest rates.
Explore down payment assistance programs to see if you qualify.
This video is the latest in our Monday with Matthew series with Windermere Chief Economist Matthew Gardner. Each month, he analyzes the most up-to-date U.S. housing data to keep you well-informed about what’s going on in the real estate market.
Hello there, I’m Windermere’s Chief Economist Matthew Gardner and welcome to this month’s episode of Monday with Matthew. Today we are going to take a look at the new home market where headwinds are certainly growing. And the reason this particular subject piqued my interest was that the National Association of Home Builders just released their Housing Market Index for August, and the numbers were certainly eye-opening.
Now, for those of you who may not be particularly familiar with this index, it is based on a survey of home builders which asks them to give their opinions on the single-family home market and asks them to rate current market conditions for the sale of homes today as well as in six months’ time. It also asks their opinion regarding foot traffic of prospective buyers to their new home communities.
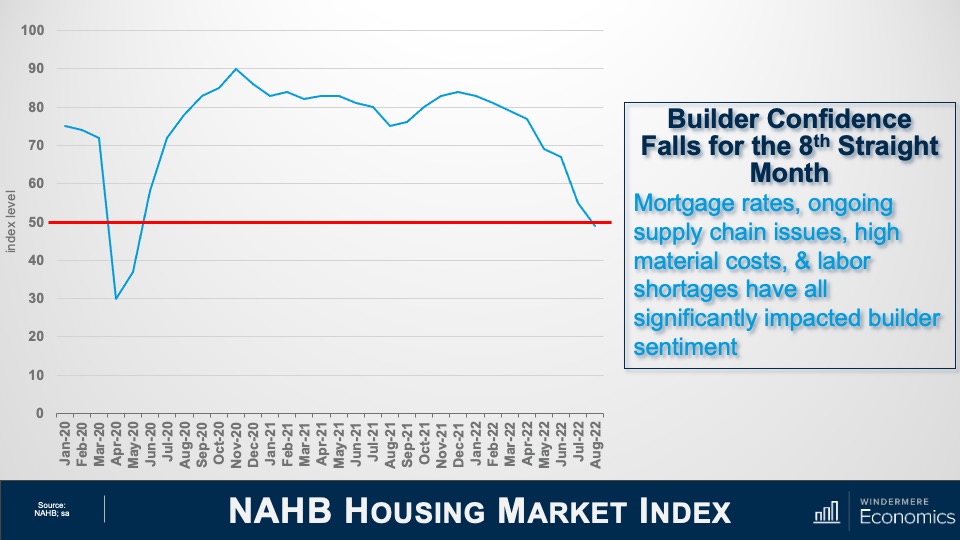
NAHB Housing Market Index
And as you can see, the headline index level fell six points to 49. The drop in August marked the eighth consecutive monthly decline for the Housing Market Index. It was also notable because it was the first time since May of 2020 that the index has dropped below the key 50 breakeven level. This is significant, as it tells us that today more home builders currently rate sales conditions as poor than good.
Now, while the August number was certainly lower than some economists had forecast, I was actually not too surprised as builders have been reporting a spike in cancelled contracts recently. In fact, a report I just read that was put out by John Burns Consulting suggested that the cancellations have more than doubled since April with 17.6% of buyers pulling out of their purchases in July. That compares to 8% in April and 7 ½% a year ago.
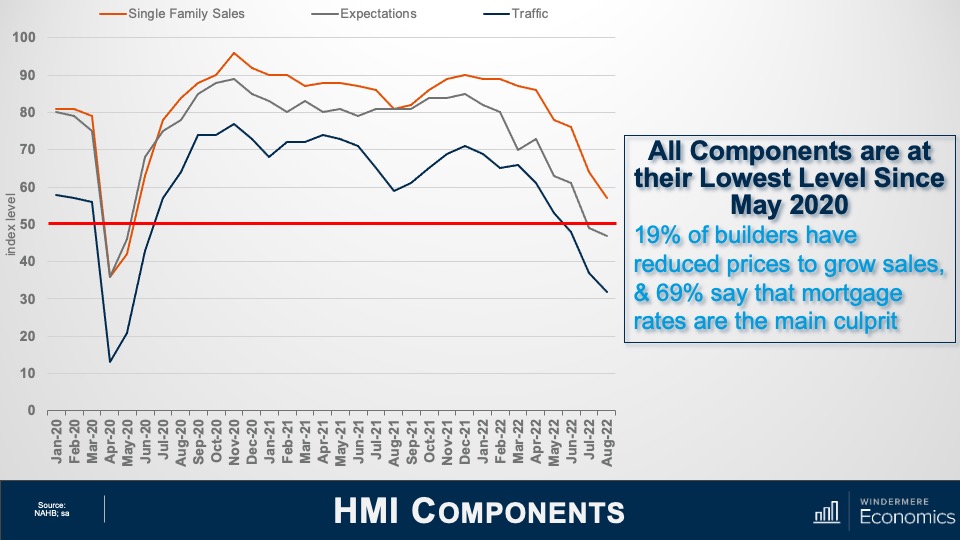
Housing Market Index Components
This chart shows a breakdown of three components of the Housing Market Index which are all at their lowest levels since May of 2020, which was just before housing activity rebounded following the lockdown due to COVID-19.
The present sales index fell seven points to 57 but is still above the breakeven point
The future sales series fell two points to 47
Prospective buyer traffic fell five points to 32 which, if we exclude the pandemic, represents the lowest index level since April of 2014
I find this index has a very strong correlation with new home sales, but I also use it as a pretty reliable leading indicator when it comes to single-family housing starts. I’ll get to that shortly. The survey also stated that one in five builders had reduced prices in August. That might help to explain the 10-point spread between builders’ perception of current versus future sales. But there are limits on home builders’ ability to keep cutting prices in order to support sales. This has become a significant issue because many of them are currently holding a large stock of inventory.
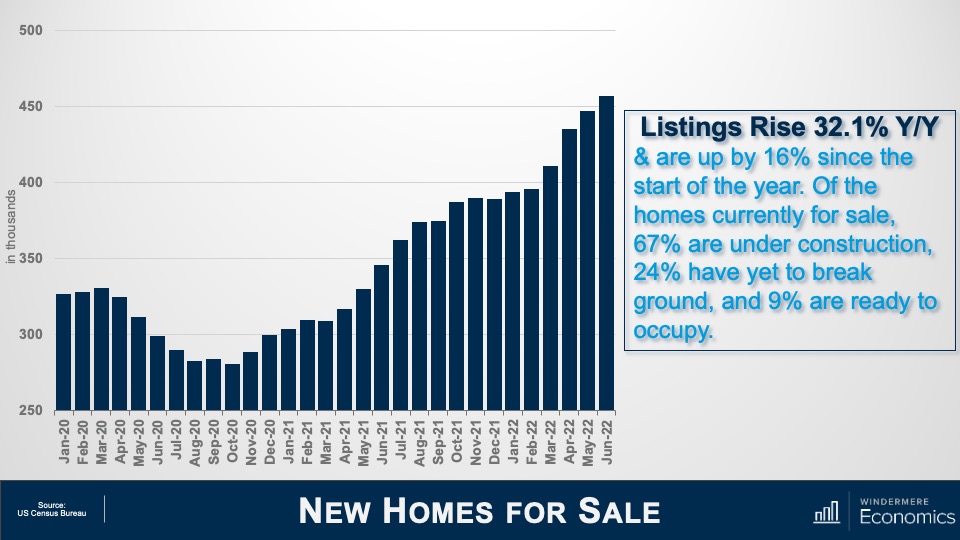
New Homes for Sale
Here is what current inventory levels look like. Although you might think that it’s not that bad given that only 9% of available homes are finished are ready to move into, I would tell you that builders incur costs every day that a home is not sold, even if that home has yet to be built. And with inventory at a level not seen since 2008, I’m sure there are a lot of builders not sleeping too well right now.
I would add that by the time the above video is released, the July new home sales report will have been published. I can almost guarantee that the number of homes for sale will have grown further.
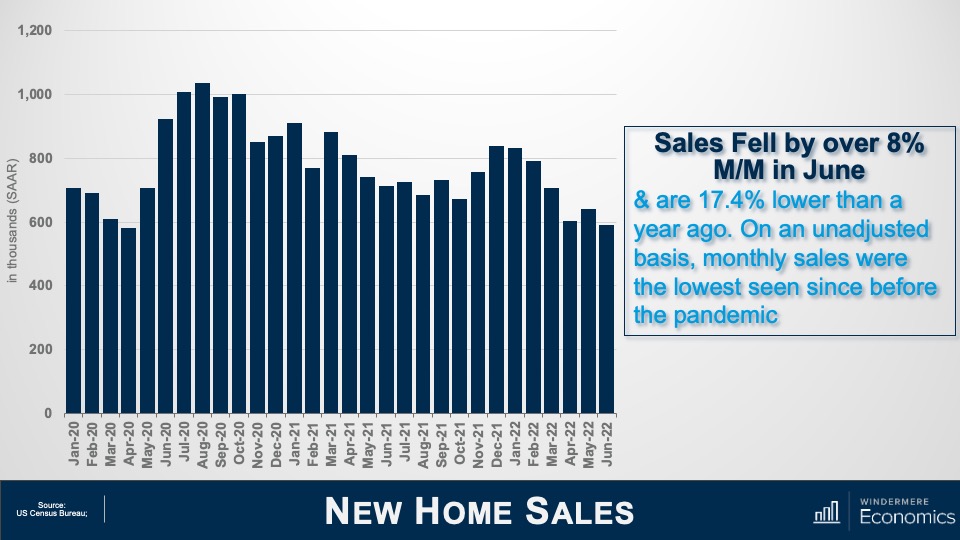
New Home Sales
Higher inventory levels are due to slower sales activity, which is continuing to decline. Sales are 17% lower than a year ago. With more homes for sale and lower transactions, it would now take more than nine months to absorb all available homes using the current sales pace. I would also tell you that the last time months of supply broke above nine was all the way back in 2010.
It’s my forecast that sales in July will have dropped from the annualized rate of 590,000 shown in the chart above to somewhere between 570,000 and 580,000.
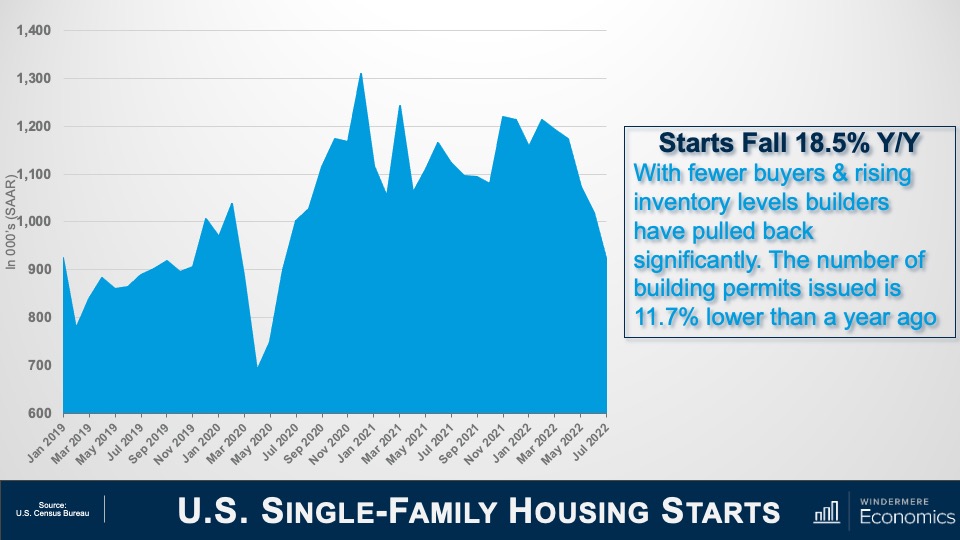
U.S. Single-Family Housing Starts
With high supply levels and lower sales, it’s not at all surprising to see builders hitting the brakes, with new home starts falling by 10.1% between June and July of this year. Starts are down by 18 ½% from a year ago. Starts have dropped on a sequential basis for five consecutive months now, and I am afraid that they will drop further before finding a bottom.
So, what’s the bottom line here? Well, there are several issues I see, the first of which is affordability. Home prices have been spiraling upward since the start of the pandemic not only because mortgage rates dropped, but construction costs started jumping and builders had to charge more for a home.
Builders saw prices rise by almost 18% last year. This had already taken a significant toll on affordability even before the mortgage rates spike we saw earlier this year. The upshot, as I see it, is that tighter monetary policy from the Fed, in concert with construction costs that remain well above normal levels, has hit builders and hit them hard. Of course, they are doing their best to address the situation by slowing construction activity significantly, but I think that they are going to have a pretty rough time for the next several months.
Ultimately, I see little option for home builders other than lowering prices further, especially now that they are competing with rising inventories in the resale market. I also believe that there are buyers out there waiting patiently on the sidelines for prices to drop in the coming months as they know that builders at some point have to solve the current supply demand imbalance and lowering prices is the easiest way of doing this. Last month the average price drop was 5%, but this is very likely to increase as we move toward the fall.
Will builders get through the situation they find themselves in? I believe that they will. And there are some glimmers of light out there with inflation appearing to be peaking, interest rates are, if not dropping, then certainly stabilizing, and this will help.
Builders also understand that the country has a significant housing shortage. In fact, a recent report published by “Up For Growth” suggested that we have a housing shortage today of around 3.8 million homes. Although this includes rental and ownership housing, some basic math tells me that there is a need today for around 2.5 million new owner-occupied homes. So, light is definitely at the end of the tunnel, but there is a way to go before they get out of it.
And there you have it. I hope that you’ve found my thoughts on this topic of interest. As always, if you have any questions or comments about the current new home environment, please do reach out to me. In the meantime, stay safe out there and I look forward to visiting with you all again next month.
Bye now.
About Matthew Gardner
As Chief Economist for Windermere Real Estate, Matthew Gardner is responsible for analyzing and interpreting economic data and its impact on the real estate market on both a local and national level. Matthew has over 30 years of professional experience both in the U.S. and U.K.
In addition to his day-to-day responsibilities, Matthew sits on the Washington State Governors Council of Economic Advisors; chairs the Board of Trustees at the Washington Center for Real Estate Research at the University of Washington; and is an Advisory Board Member at the Runstad Center for Real Estate Studies at the University of Washington where he also lectures in real estate economics.
Although there are certain fundamental principles to contemporary design, it is constantly evolving. While other interior design styles are often rooted in a specific period, contemporary design is set in the present. What’s popular now is what’s popular in contemporary design. Its ability to remain timeless is what gives contemporary design its greatest quality—it never goes out of style. Learn a bit more about contemporary design to find ways to incorporate it into your home.
What is contemporary interior design?
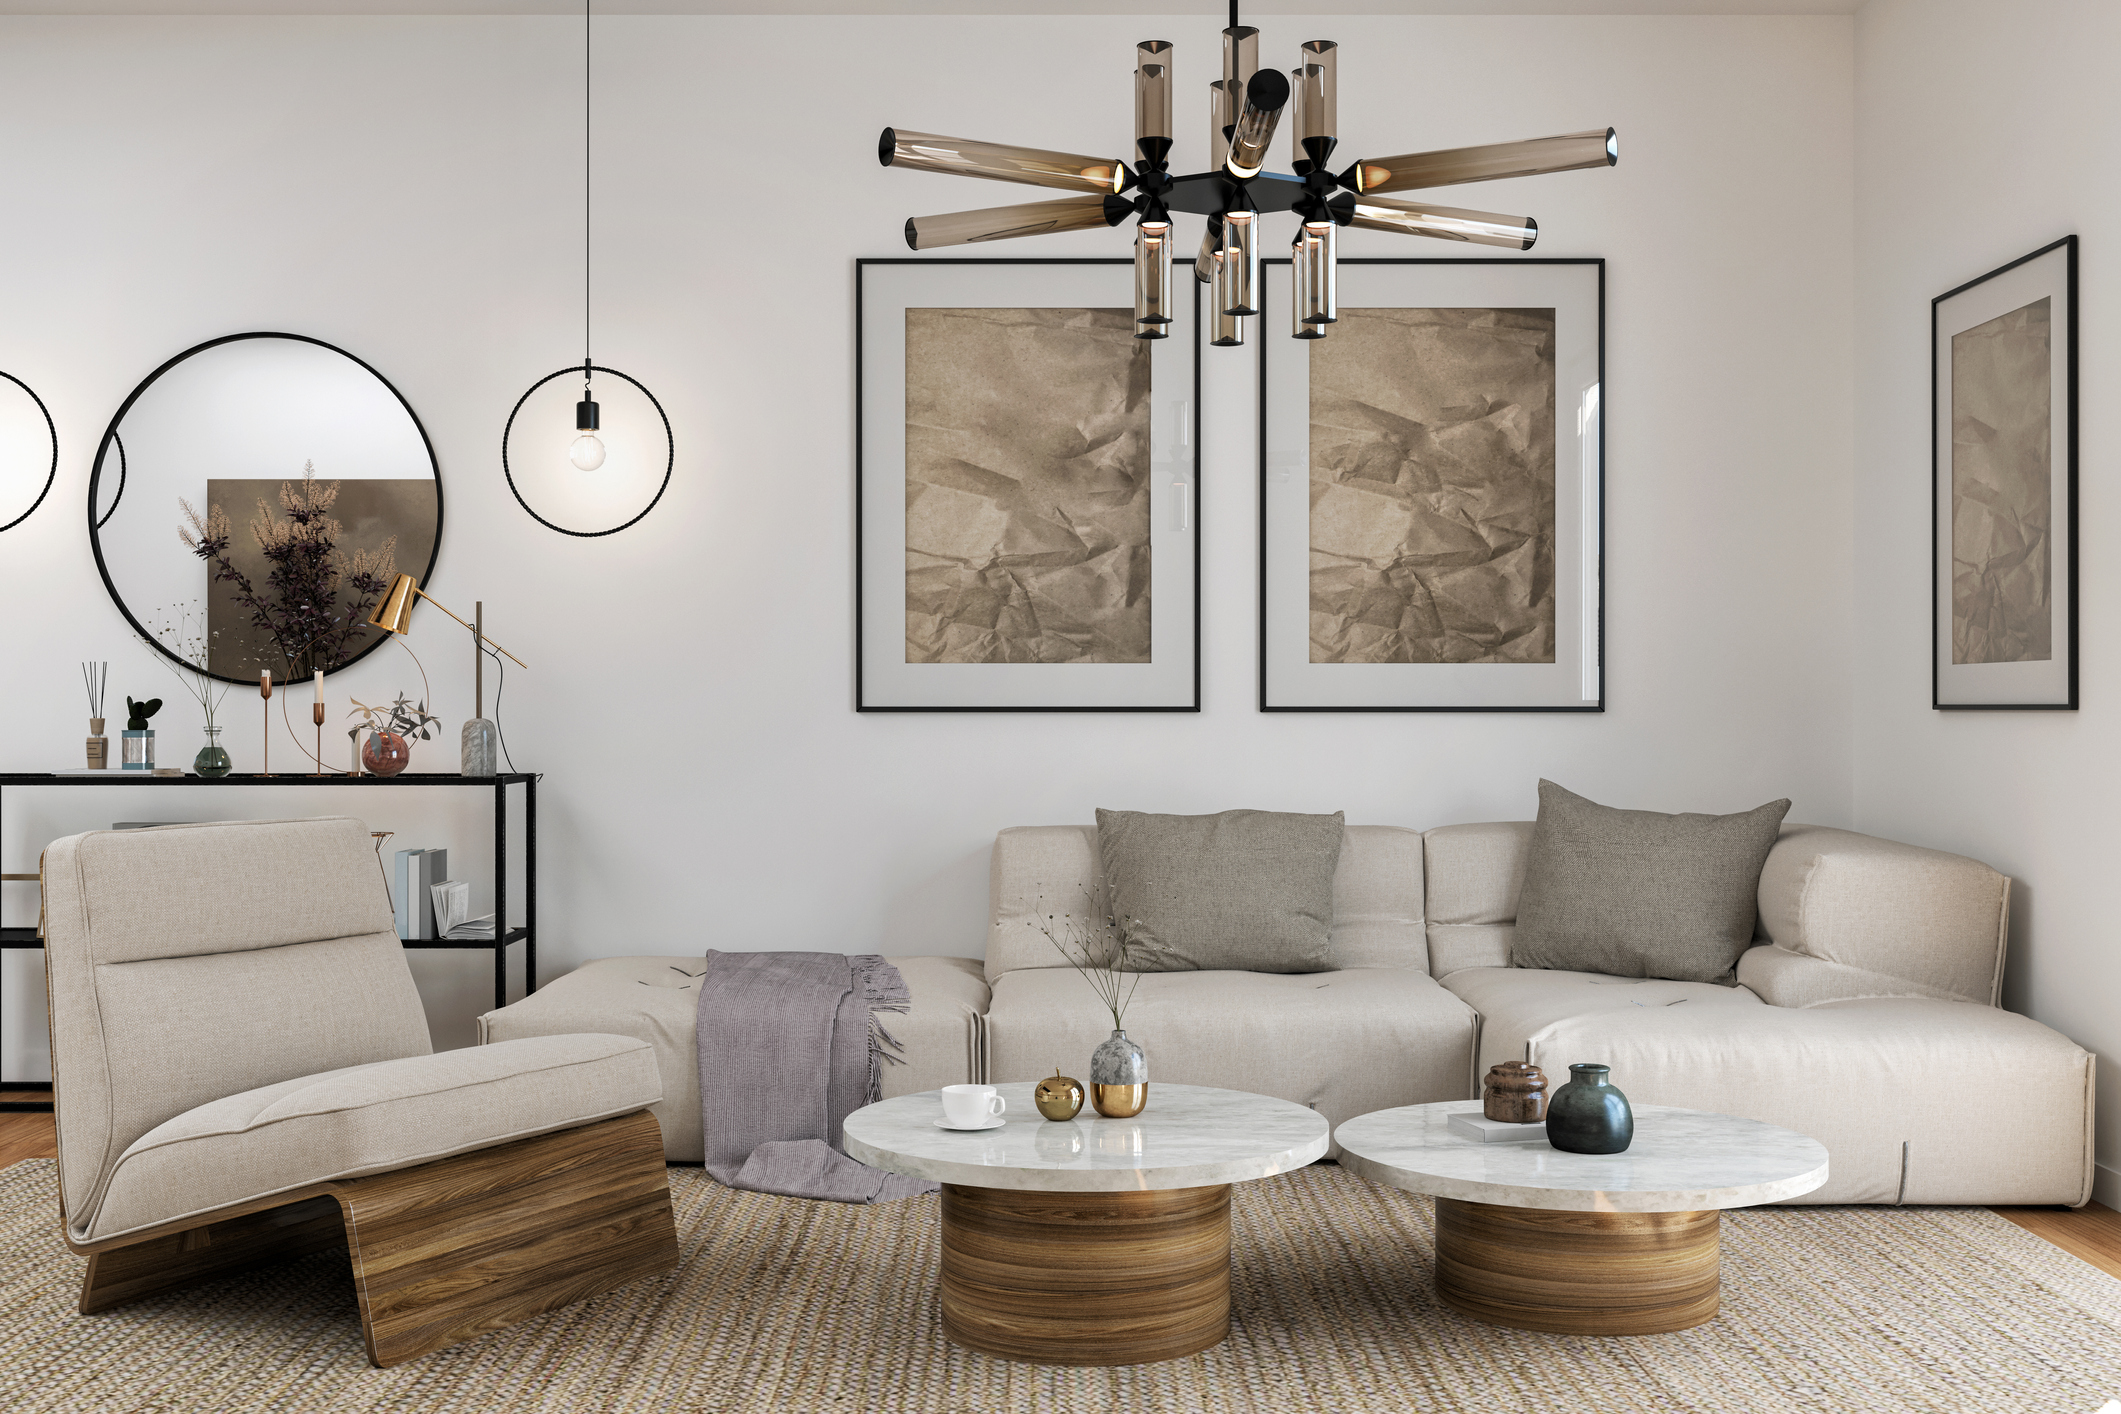
Contemporary style is characterized by clean lines, state-of-the-art materials, and a preference for openness over ornamentation. These tenets go hand in hand with the philosophies of modernism and minimalism, but contemporary design simply dips its toes in these other design styles without relying on them too heavily.
The aesthetic of modern construction lends itself well to contemporary design. Industrial spaces and open rooms with high ceilings and large windows help to deliver a magazine-quality contemporary look. But even if your home isn’t tailor-made for contemporary design, you can still curate it.
Image Source: Getty Images – Image Credit: vicnt
Contemporary Design in Your Home
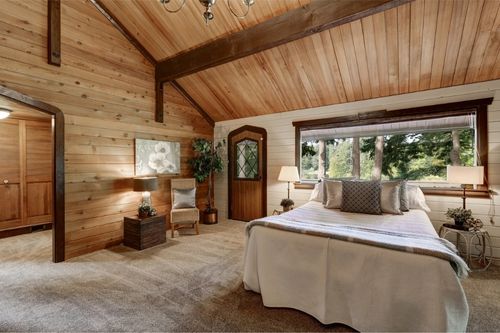
The simplest way to incorporate contemporary design philosophy into your home is to let the natural architectural elements show. Let your exposed wooden beams and brick walls shine, decluttering the spaces around them to make them the focal point. This can make your spaces feel empty at first but remember; contemporary design is all about opening things up to effectively apply decorative details.
Choose modern furniture with clean lines and solid-colored fabrics. In the kitchen and bathroom, chrome and metallic surfaces will reinforce a contemporary aesthetic. When decorating, start with a neutral foundation (white, grey, and black) and add bold accent colors on top. The timeless appeal of a hardwood floor makes it a fitting choice for achieving contemporary style, while textured textiles in natural fabrics will help to liven up your spaces.
Stone, metal, and glass mix well in contemporary design, often combined in the selection of living room sets, decorative centerpieces, and kitchen/bathroom design. Large pieces of art, accent walls, and bold decorations help to broaden the color palette of contemporary spaces. You are free to choose bold, impactful hues from across the color spectrum in your decoration.
The Differences Between Contemporary and Modern Design
Whereas contemporary design is centered on what is popular during the present, modern design is rooted in a specific time period. Modern design dates back to at least the early twentieth century, which evolved into mid-century modern during the 1950s.
Modern design typically has earthier colors and a general preference for wood, whereas saturated colors and metals/glass are more at home in contemporary design. Choosing modern design means you’re choosing to make decorative variations on a theme, whereas the theme of contemporary design is always changing, so you never know where it might lead.
Visit our Design Styles page to learn more about common interior design styles and how you can incorporate them into your home:

 Facebook
 X
X
 Pinterest
 Copy Link


")


