
 Facebook
 X
X
 Pinterest
 Copy Link

The following analysis of select counties of the Eastern Washington real estate market is provided by Windermere Real Estate Chief Economist Matthew Gardner. We hope that this information may assist you with making better-informed real estate decisions. For further information about the housing market in your area, please don’t hesitate to contact your Windermere Real Estate agent.
Regional Economic Overview
Total employment in Eastern Washington rose 14,046 jobs year over year, with all markets seeing substantial gains. On a percentage basis, the fastest growing market was Benton County, where employment rose by 4%. The slowest growing market was Whitman, where the number of jobs rose 1.8%. In total, the region’s employment base rose 2.9% over the first quarter of 2022. Unadjusted for seasonality, the regional unemployment rate was 7.1%, which is up from 5.8% a year ago. When seasonally adjusted, however, the jobless rate was a more respectable 6%, which is up from 4.8% a year ago. Although the unemployment rate has risen, it is due to a growing labor force rather than a significant increase in the number of unemployed people. I still expect to see jobs added as we move through the year. However, the pace of growth is likely to slow if the U.S. economy starts to contract later this year, which is possible but not guaranteed.
Eastern Washington Home Sales
❱ In the first quarter of 2023, 1,717 homes sold, which was 28.7% lower than in the same period in 2022 and 22.1% lower than in the final quarter of 2022.
❱ Much of the decline in sales can be attributed to a significant slowdown in the number of homes for sale. Listing activity fell 36.5% compared to the final quarter of last year. A question remains as to whether the market will see its traditional spring bump, or if homeowners will stay put until interest rates get closer to the rate on their current mortgage.
❱ Year over year, sales fell across the region. All counties saw sales fall compared to the fourth quarter of last year as well.
❱ The good news is that pending sales rose 18.2% compared to the previous quarter, giving the market some hope that sales activity will rise in the second quarter of the year.

Eastern Washington Home Prices
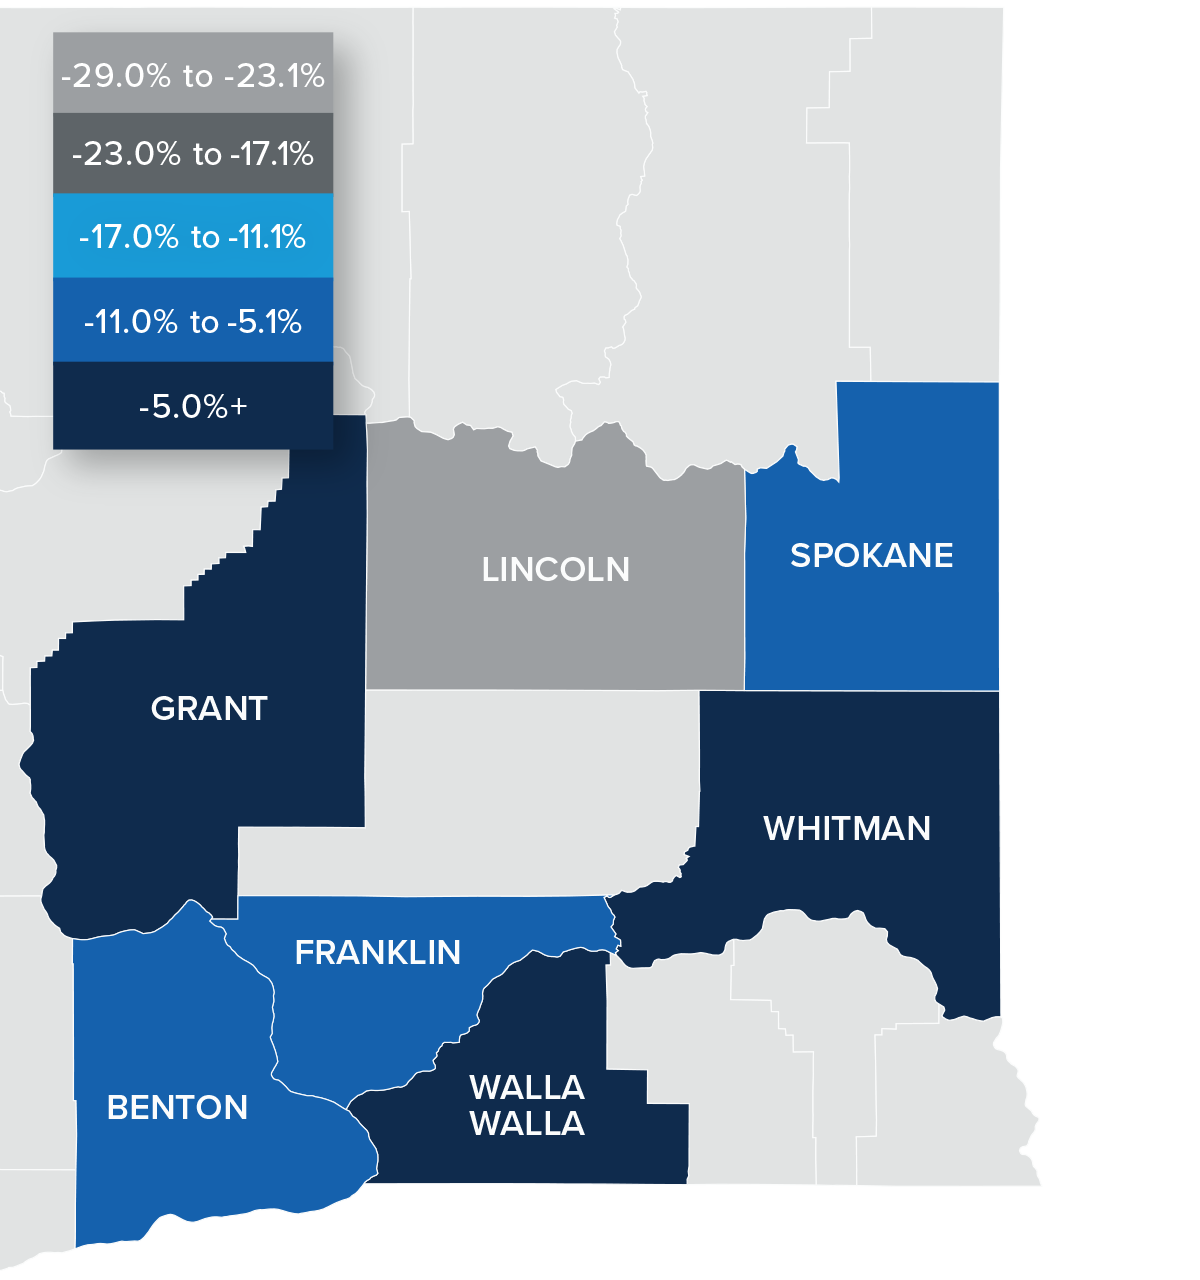
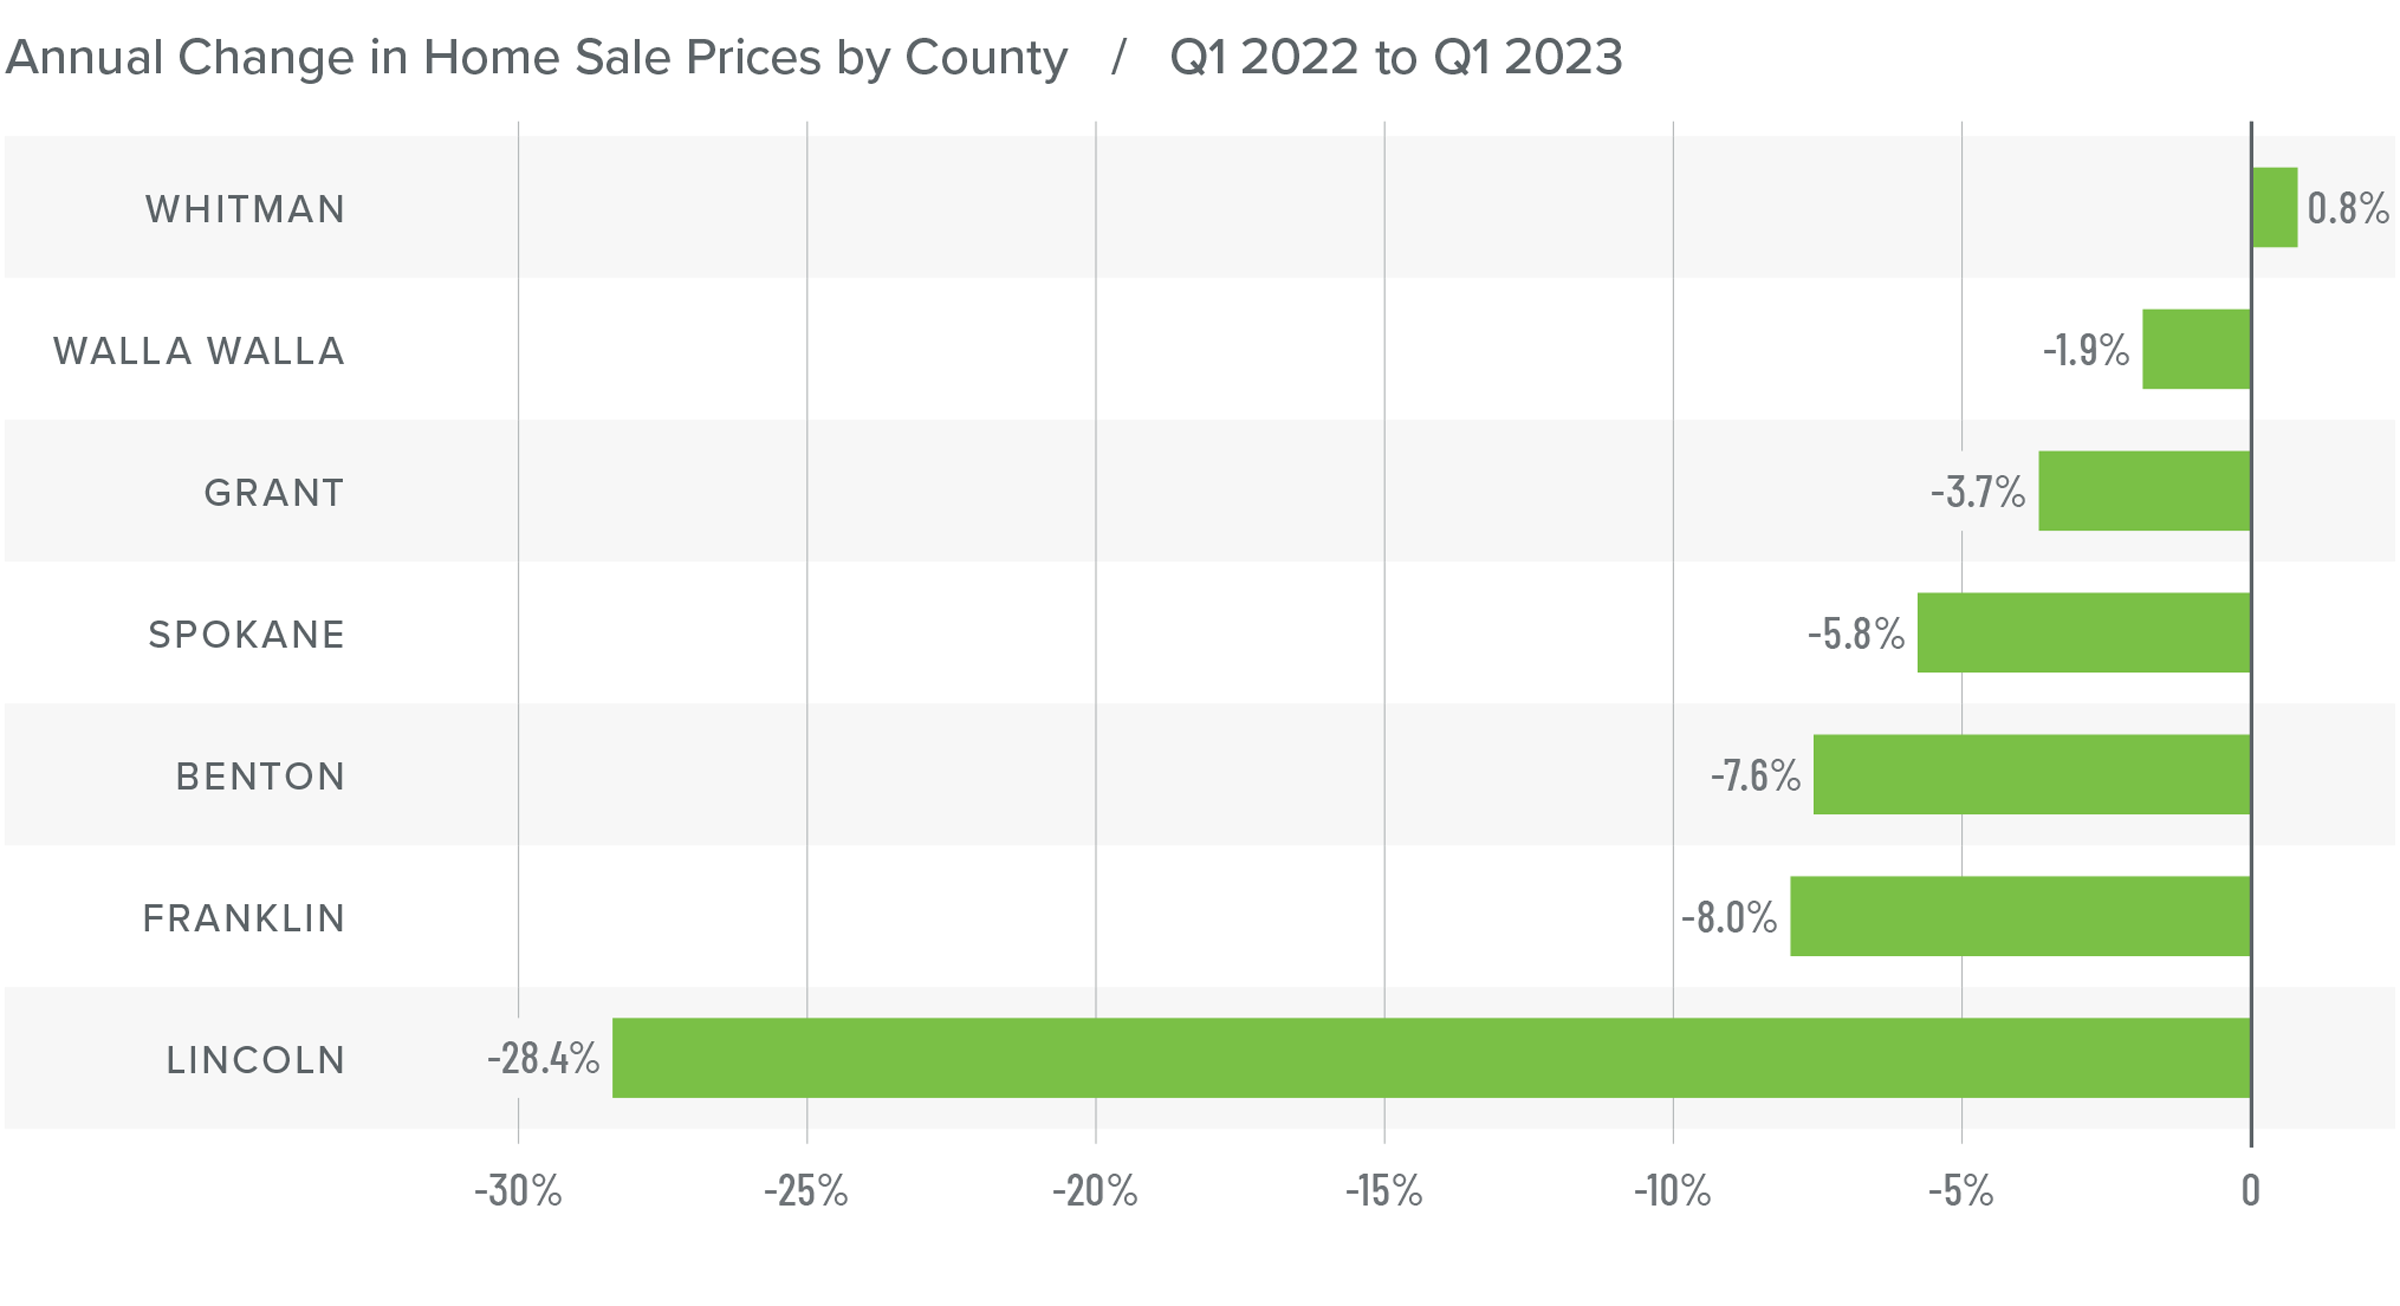
❱ Year over year, the average home price in Eastern Washington fell 5.7% to $410,234. Average prices were down 7% compared to the final quarter of 2022.
❱ Prices also fell across the board compared to the final quarter of 2022. The market appears to be in the middle of a correction, with data showing that the median listing price was 2.8% lower than in the fourth quarter.
❱ Every county except Whitman saw average sale prices fall compared to the first quarter of 2022, with a significant drop in Lincoln County.
❱ Mortgage rates remain elevated, which is putting additional downward pressure on prices. While the market shift is painful to watch, it is necessary. I expect that the region will find a floor in the not-too-distant future, and that prices will start rising again later this summer.
Mortgage Rates
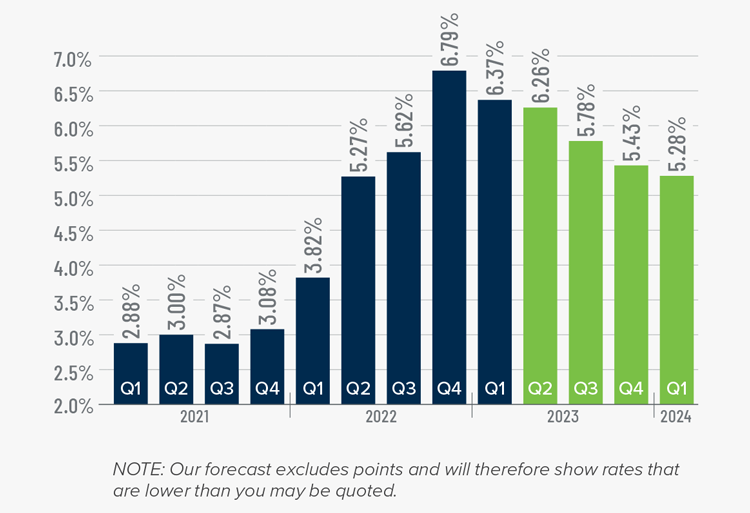
Rates in the first quarter of 2023 were far less volatile than last year, even with the brief but significant impact of early March’s banking crisis. It appears that buyers are jumping in when rates dip, which was the case in mid-January and again in early February.
Even with the March Consumer Price Index report showing inflation slowing, I still expect the Federal Reserve to raise short-term rates one more time following their May meeting before pausing rate increases. This should be the catalyst that allows mortgage rates to start trending lower at a more consistent pace than we have seen so far this year. My current forecast is that rates will continue to move lower with occasional spikes, and that they will hold below 6% in the second half of this year.
Eastern Washington Days on Market
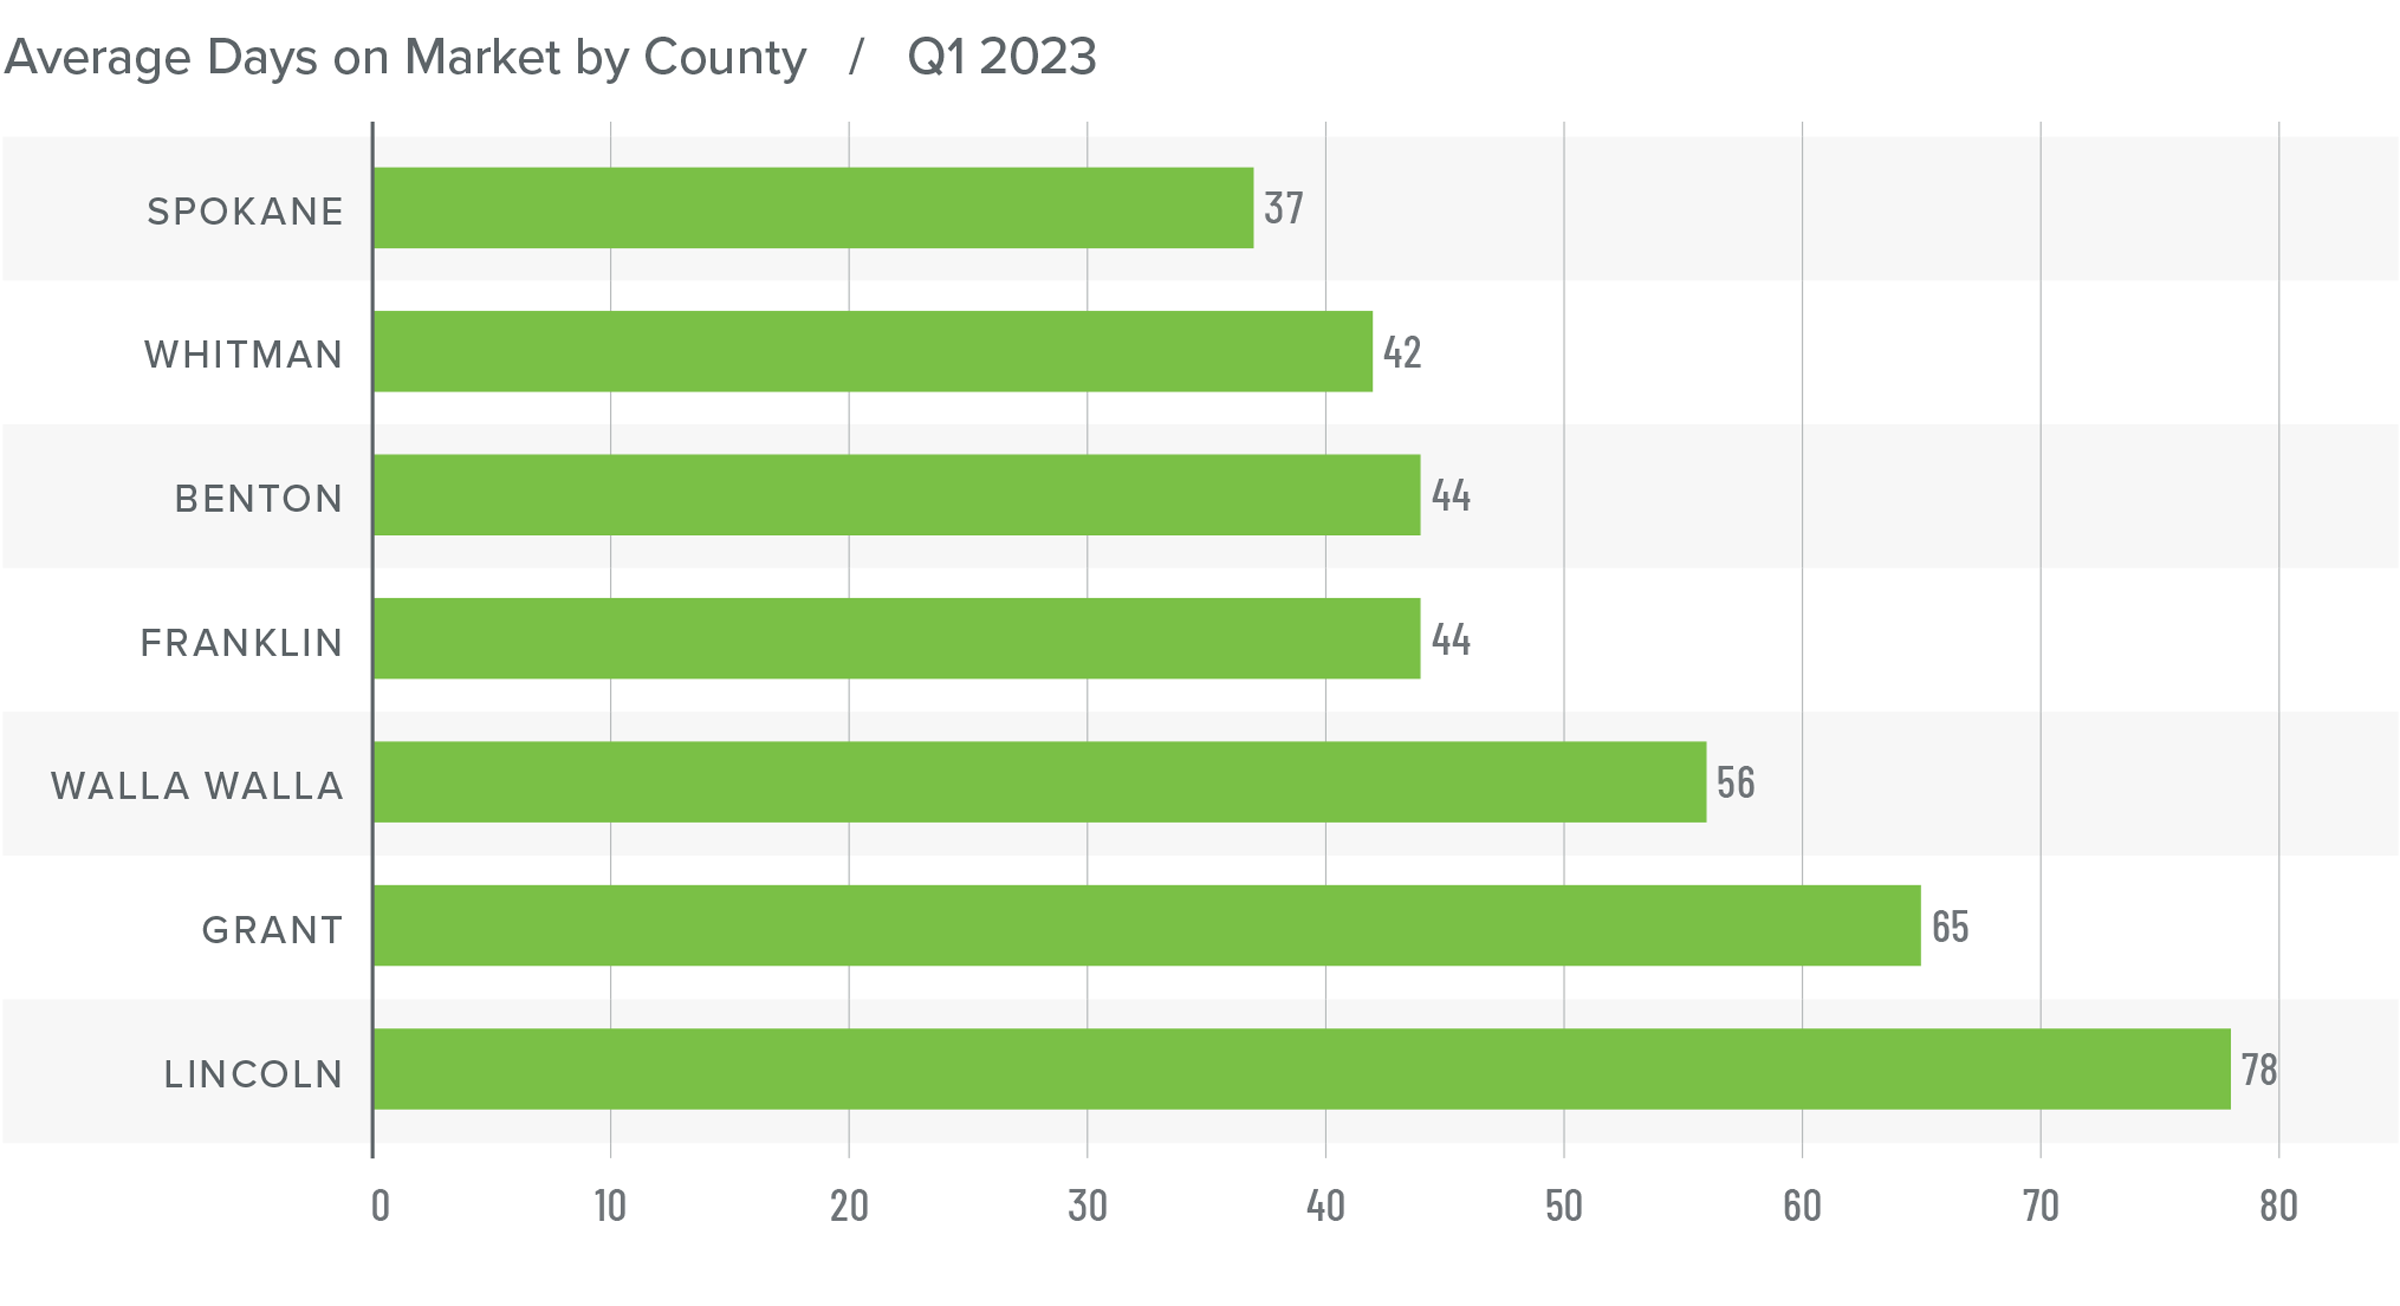
❱ The average time it took to sell a home in Eastern Washington in the first quarter of 2023 was 52 days, which was 27 more days than during the same period in 2022.
❱ Average days on market also rose in every county compared to the fourth quarter of 2022, with the regional average rising 17 days.
❱ All counties saw the average number of days it took for a house to go under contract rise compared to the same period a year ago.
❱ Stubbornly higher mortgage rates, lower affordability, and some amount of economic uncertainty has caused days on market to rise. Increasing numbers of pending sales in the quarter suggest that there are buyers out there. I hope we will see greater activity in the region as we move through the spring months.
Conclusions
This speedometer reflects the state of the region’s real estate market using housing inventory, price gains, home sales, interest rates, and larger economic factors.
Higher financing costs continue to act as a significant headwind in the market. Although listing and sale prices have been falling, I see this as a needed correction, and one that will be over before the summer sets in. I am hopeful that mortgage rates will stabilize and head lower as we enter the summer, which should bring more buyers into the market.

As it stands today, home buyers have the upper hand, but this could only be for a short time—the market can move swiftly when it wants to. For now, buyers should enjoy this likely brief period of dominance.
About Matthew Gardner

As Chief Economist for Windermere Real Estate, Matthew Gardner is responsible for analyzing and interpreting economic data and its impact on the real estate market on both a local and national level. Matthew has over 30 years of professional experience both in the U.S. and U.K.
In addition to his day-to-day responsibilities, Matthew sits on the Washington State Governors Council of Economic Advisors; chairs the Board of Trustees at the Washington Center for Real Estate Research at the University of Washington; and is an Advisory Board Member at the Runstad Center for Real Estate Studies at the University of Washington where he also lectures in real estate economics.
")


