
 Facebook
 X
X
 Pinterest
 Copy Link

The following analysis of select counties of the Eastern Washington real estate market is provided by Windermere Real Estate. We hope that this information may assist you with making better-informed real estate decisions. For further information about the housing market in your area, please don’t hesitate to contact your Windermere Real Estate agent.
Regional Economic Overview
Year over year, Eastern Washington gained 4,515 jobs, representing a significant slowdown from the pace of growth during the post-pandemic recovery. On a percentage basis, the region’s job market grew by only .9%. The fastest growing county was Spokane, where employment rose 2.2%. This was followed by Walla Walla (+1.4%) and Benton (+1.1%) counties. Employment growth was negative in the rest of the markets contained in this report.
Unadjusted for seasonality, the regional unemployment rate was 4.2%, which is down from 5.2% during the same period in 2022. When seasonally adjusted, the jobless rate was 4.4%, which was down from 5.5% at the same time in 2022.
Eastern Washington Home Sales
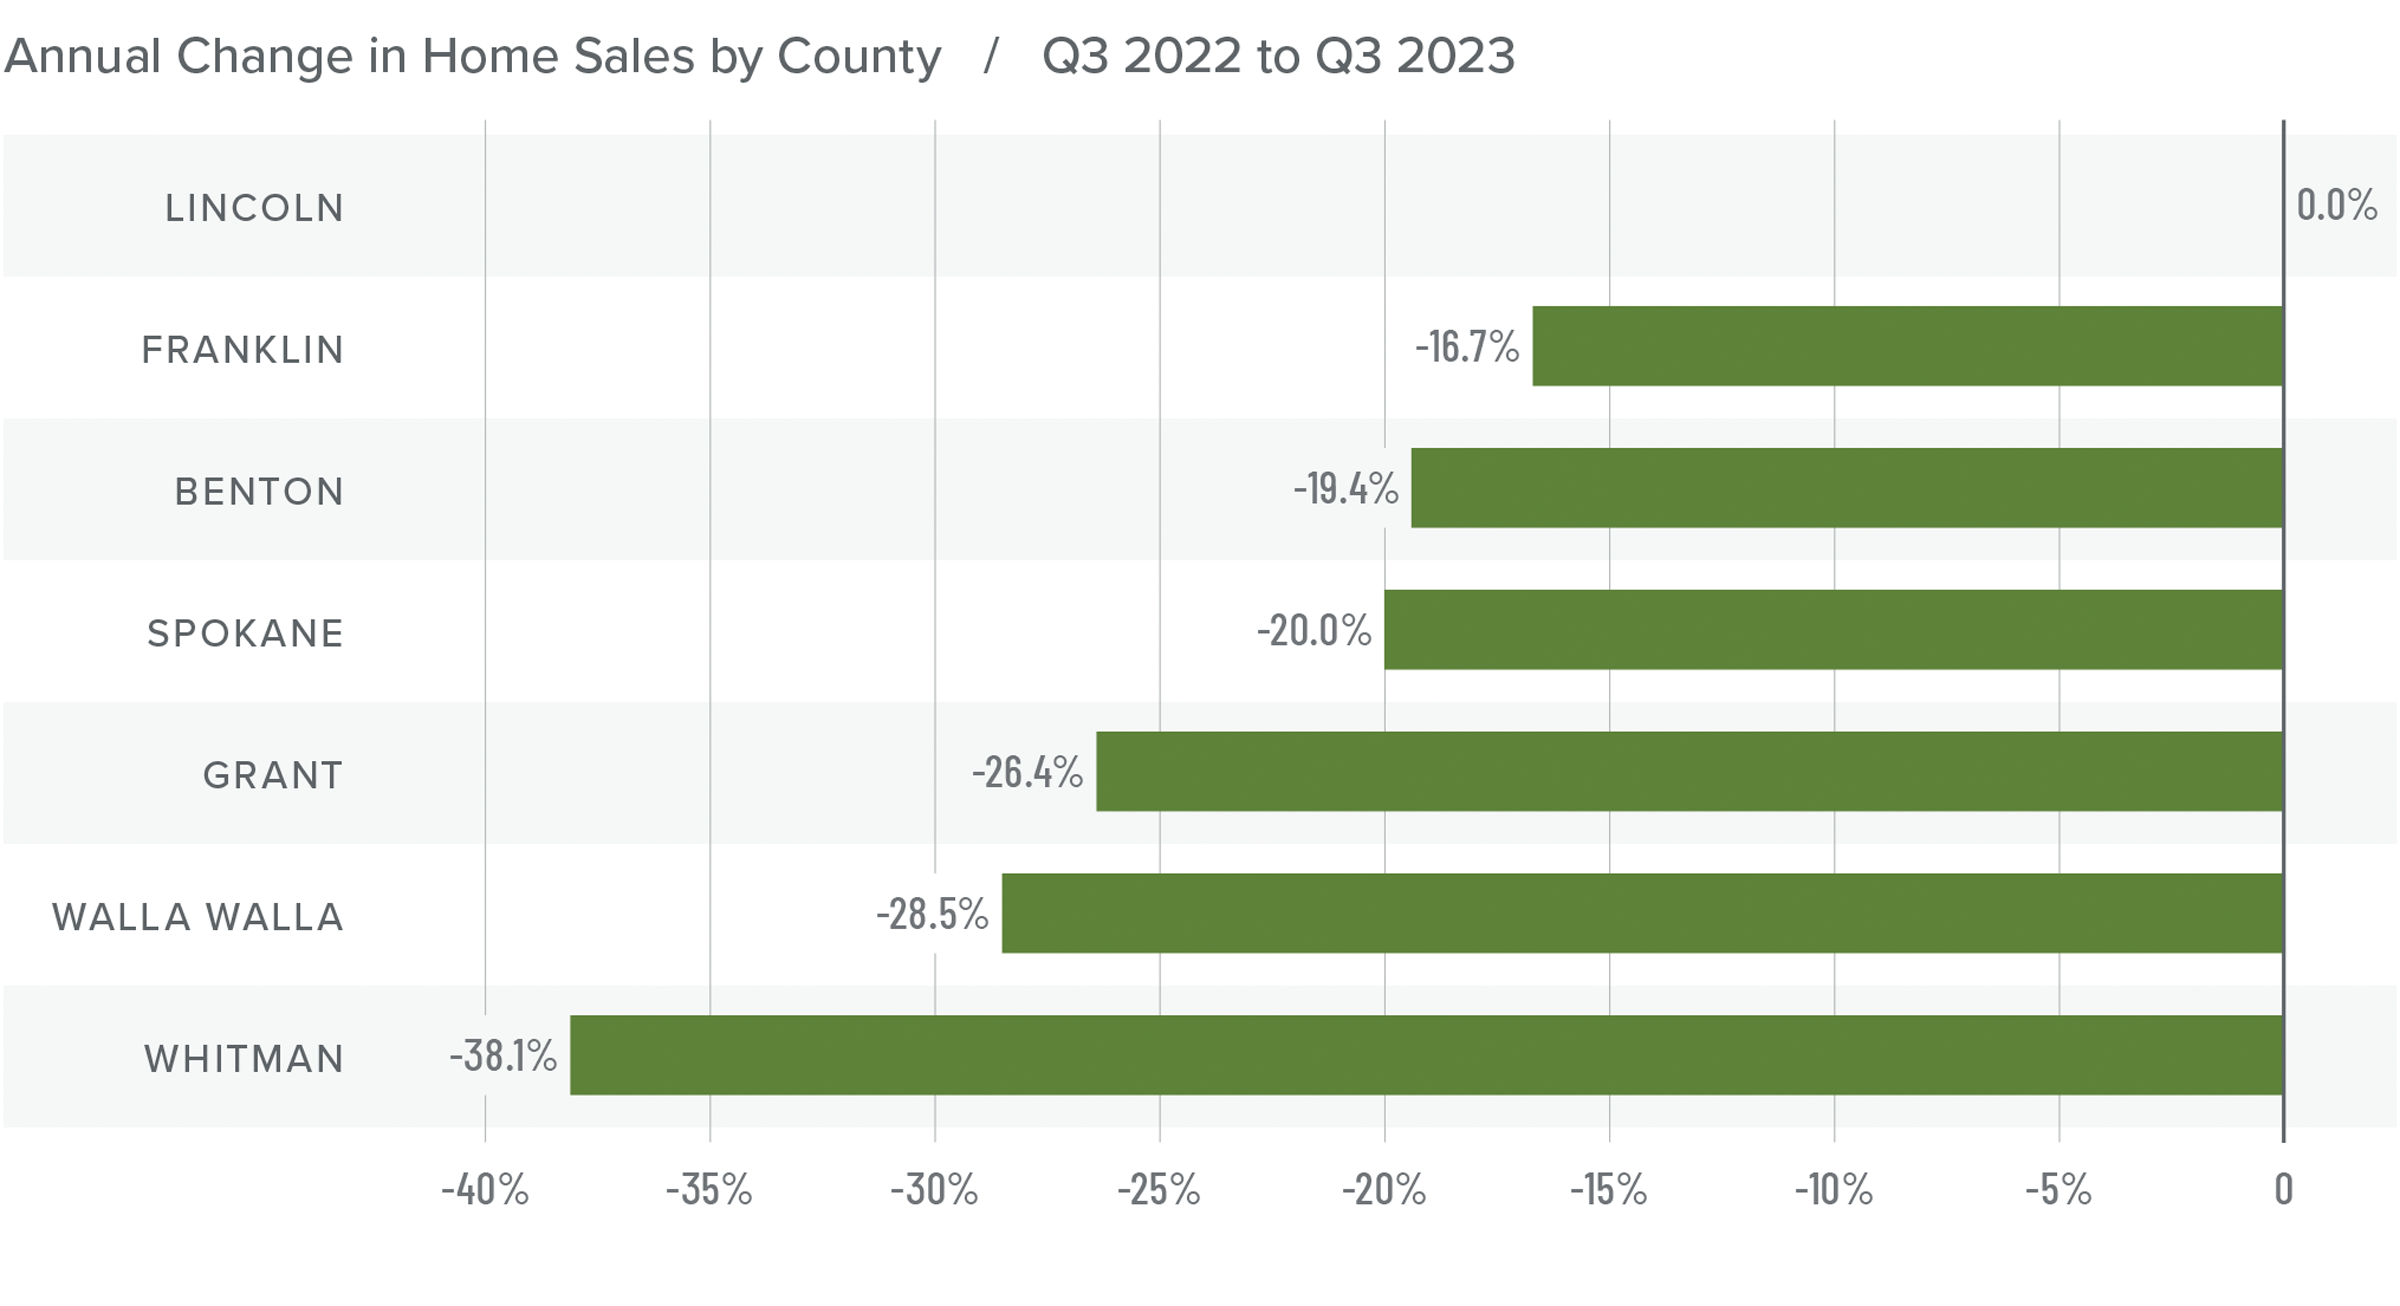
❱ In the third quarter of 2023, 2,647 homes sold. This was 21.2% lower than in the third quarter of 2022 but was up 1.8% compared to the second quarter of this year.
❱ The modest increase in sales may be attributable to the 35% increase in the number of homes for sale. Even more impressive was that sales grew in the face of significantly higher mortgage rates.
❱ Year over year, sales fell across the region except in Lincoln County, where they were flat. However, compared to the second quarter of this year, sales were higher in Spokane, Benton, and Franklin counties.
❱ Pending sales fell 6.8%, which suggests that sales were likely pulled forward due to rising interest rates and that closings in the final quarter of 2023 may also be down.
Eastern Washington Home Prices
❱ Year over year, the average home price in Eastern Washington rose .8% to $466,007. Prices rose 3.4% compared to the second quarter of 2023.
❱ Of note was that median list prices rose 4.4% between the second and third quarters of this year. Sellers still appear to be confident in the value of their homes despite mortgage rates that are at their highest levels in over two decades.
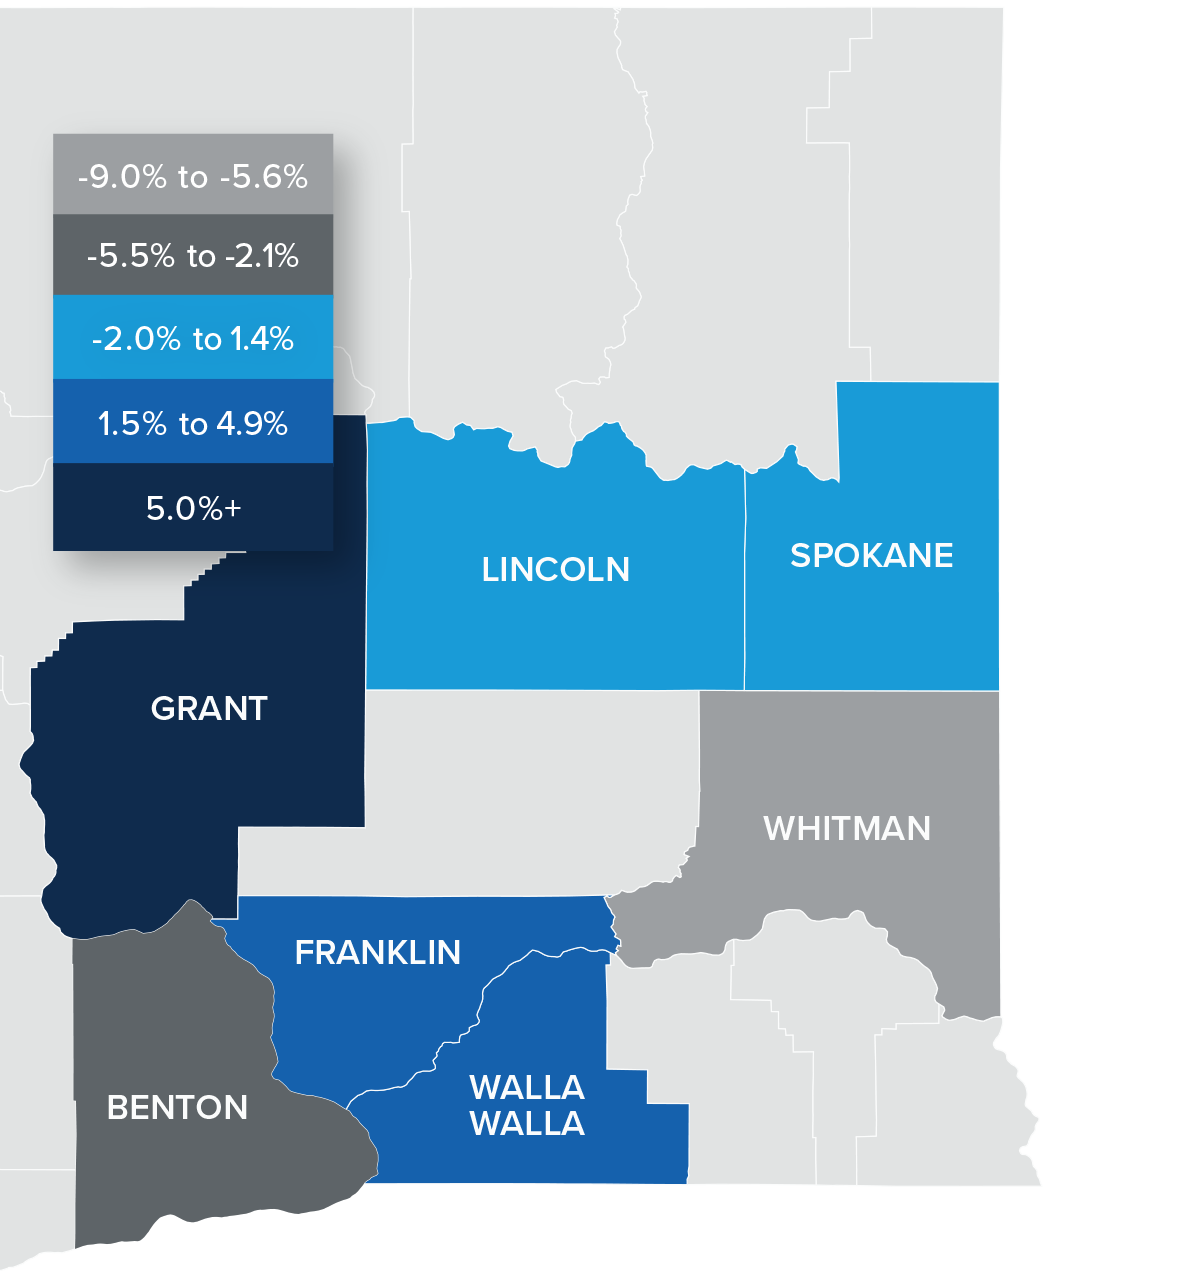
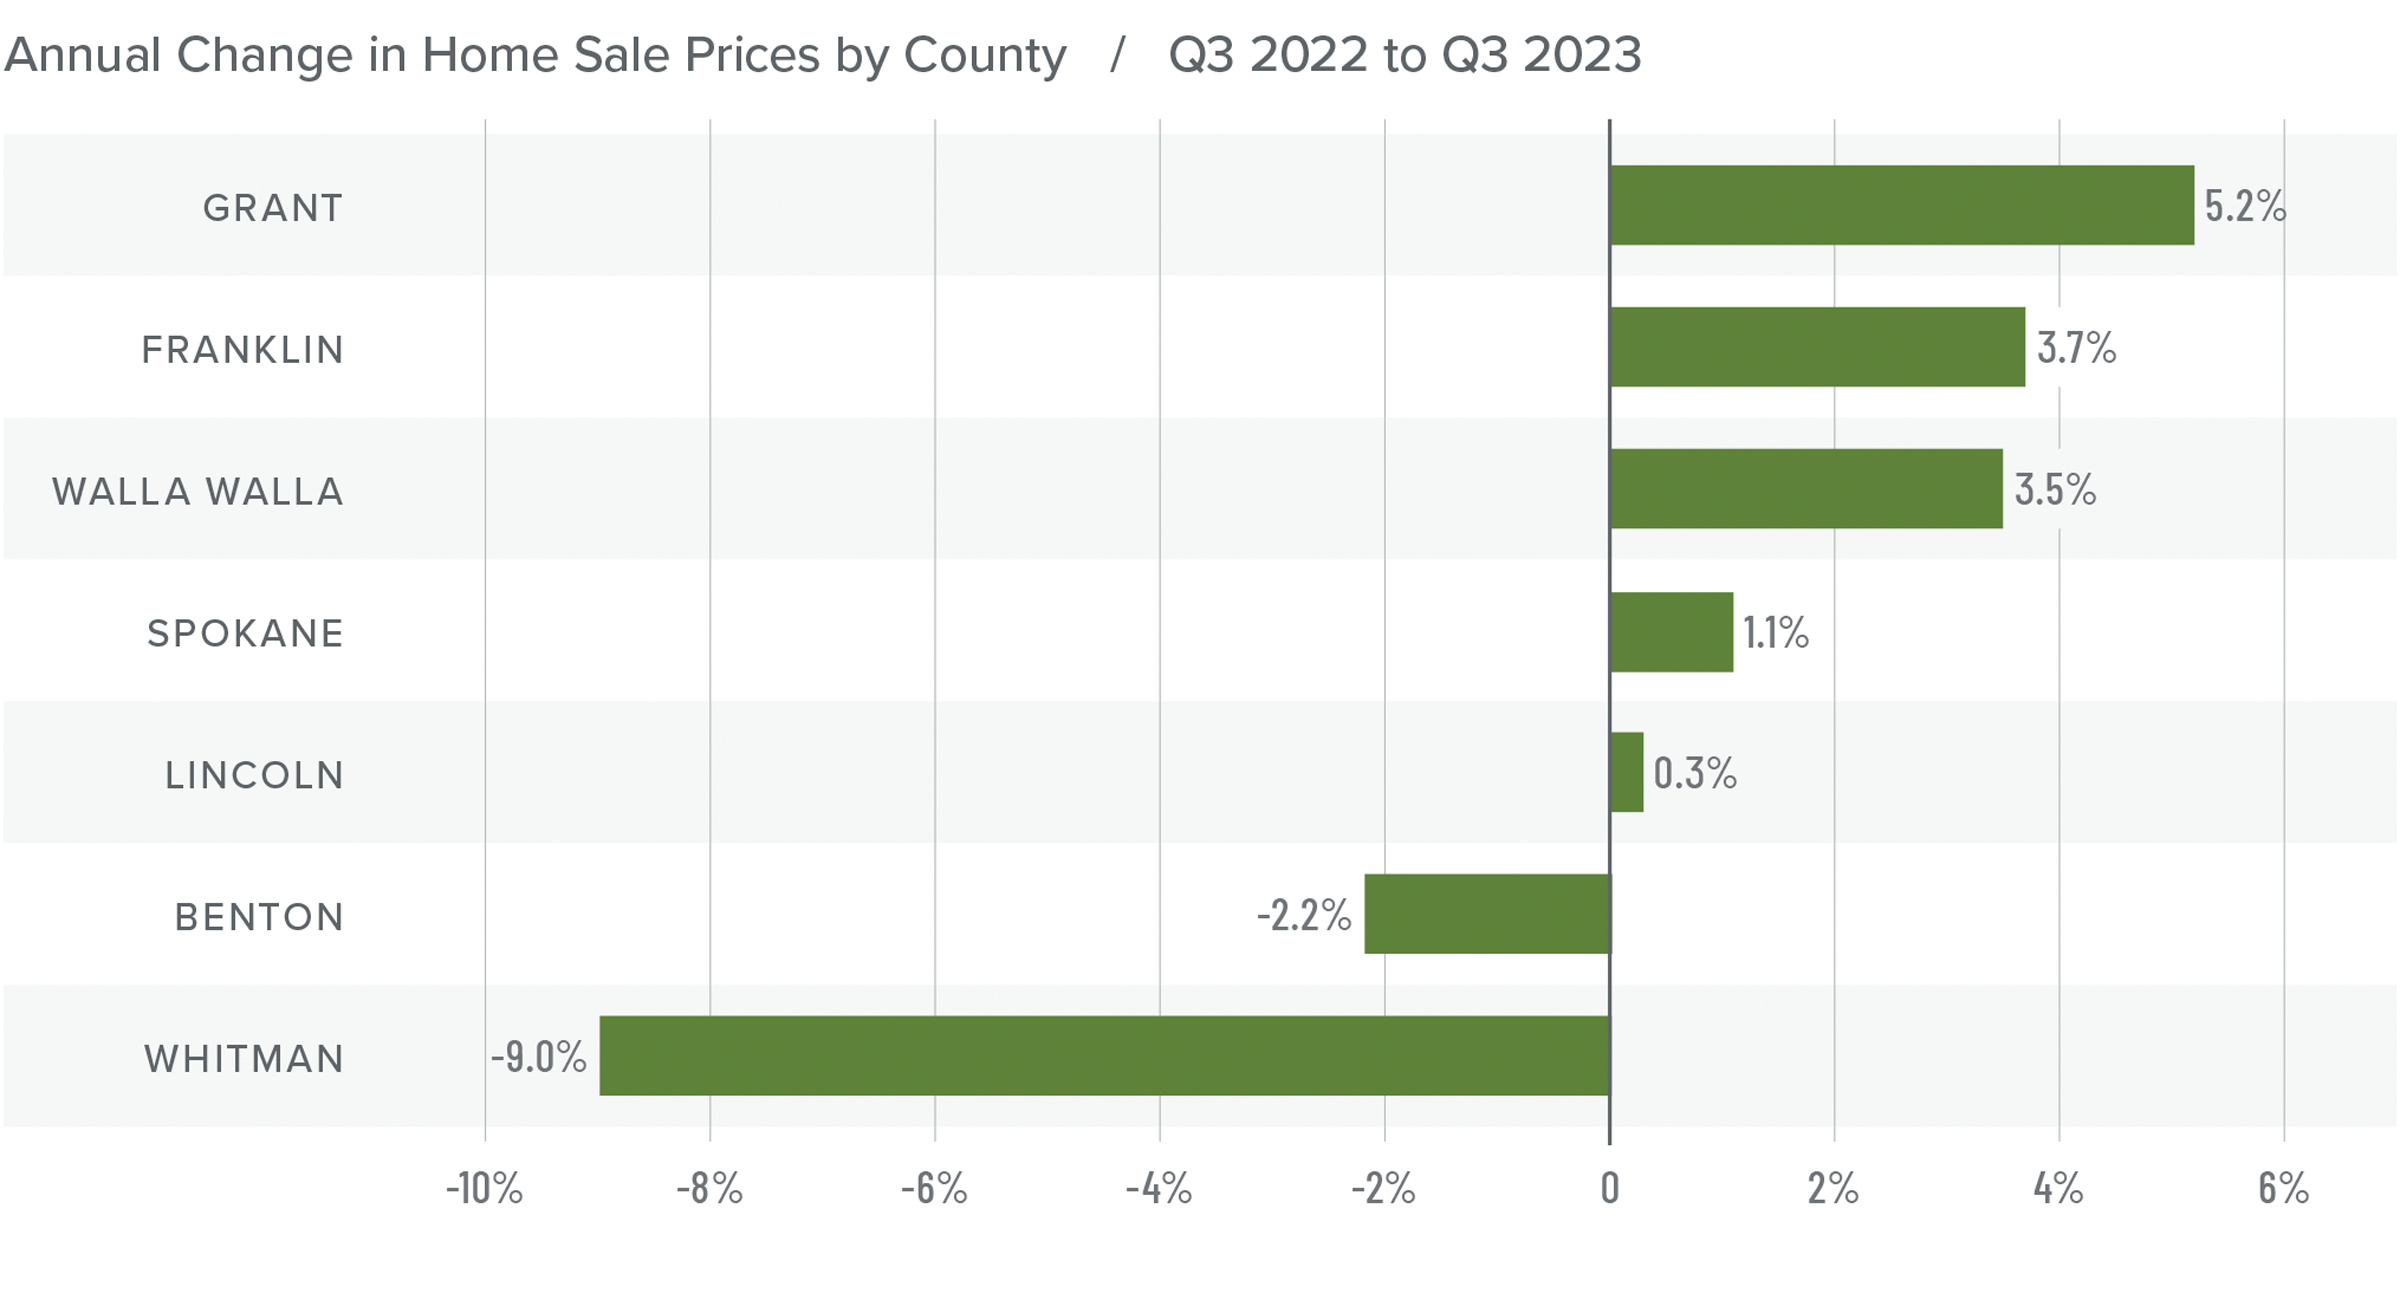
❱ Prices rose in five of the counties contained in this report but fell in two when compared to the same period in 2022. The same was true for quarterly growth, with average prices rising in every county other than Whitman and Walla Walla.
❱ Though home price growth was positive, it has certainly slowed. Some of this may be attributable to increased supply levels, but I believe that mortgage rates are acting as the most significant headwind. I expect price growth to slow further as we enter the final quarter of the year, and there’s a possibility it will turn negative across the region.
Mortgage Rates
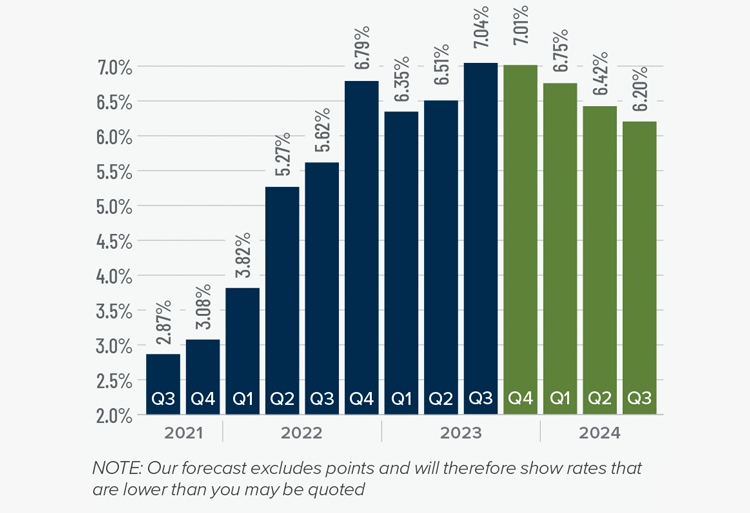
Mortgage rates continued trending higher in the third quarter of 2023 and are now at levels we have not seen since the fall of 2000. Mortgage rates are tied to the interest rate (yield) on 10-year treasuries, and they move in the opposite direction of the economy. Unfortunately for mortgage rates, the economy remains relatively buoyant, and though inflation is down significantly from its high, it is still elevated. These major factors and many minor ones are pushing Treasury yields higher, which is pushing mortgage rates up. Given the current position of the Federal Reserve, which intends to keep rates “higher for longer,” it is unlikely that home buyers will get much reprieve when it comes to borrowing costs any time soon.
With such a persistently positive economy, I have had to revise my forecast yet again. I now believe rates will hold at current levels before starting to trend down in the spring of next year.
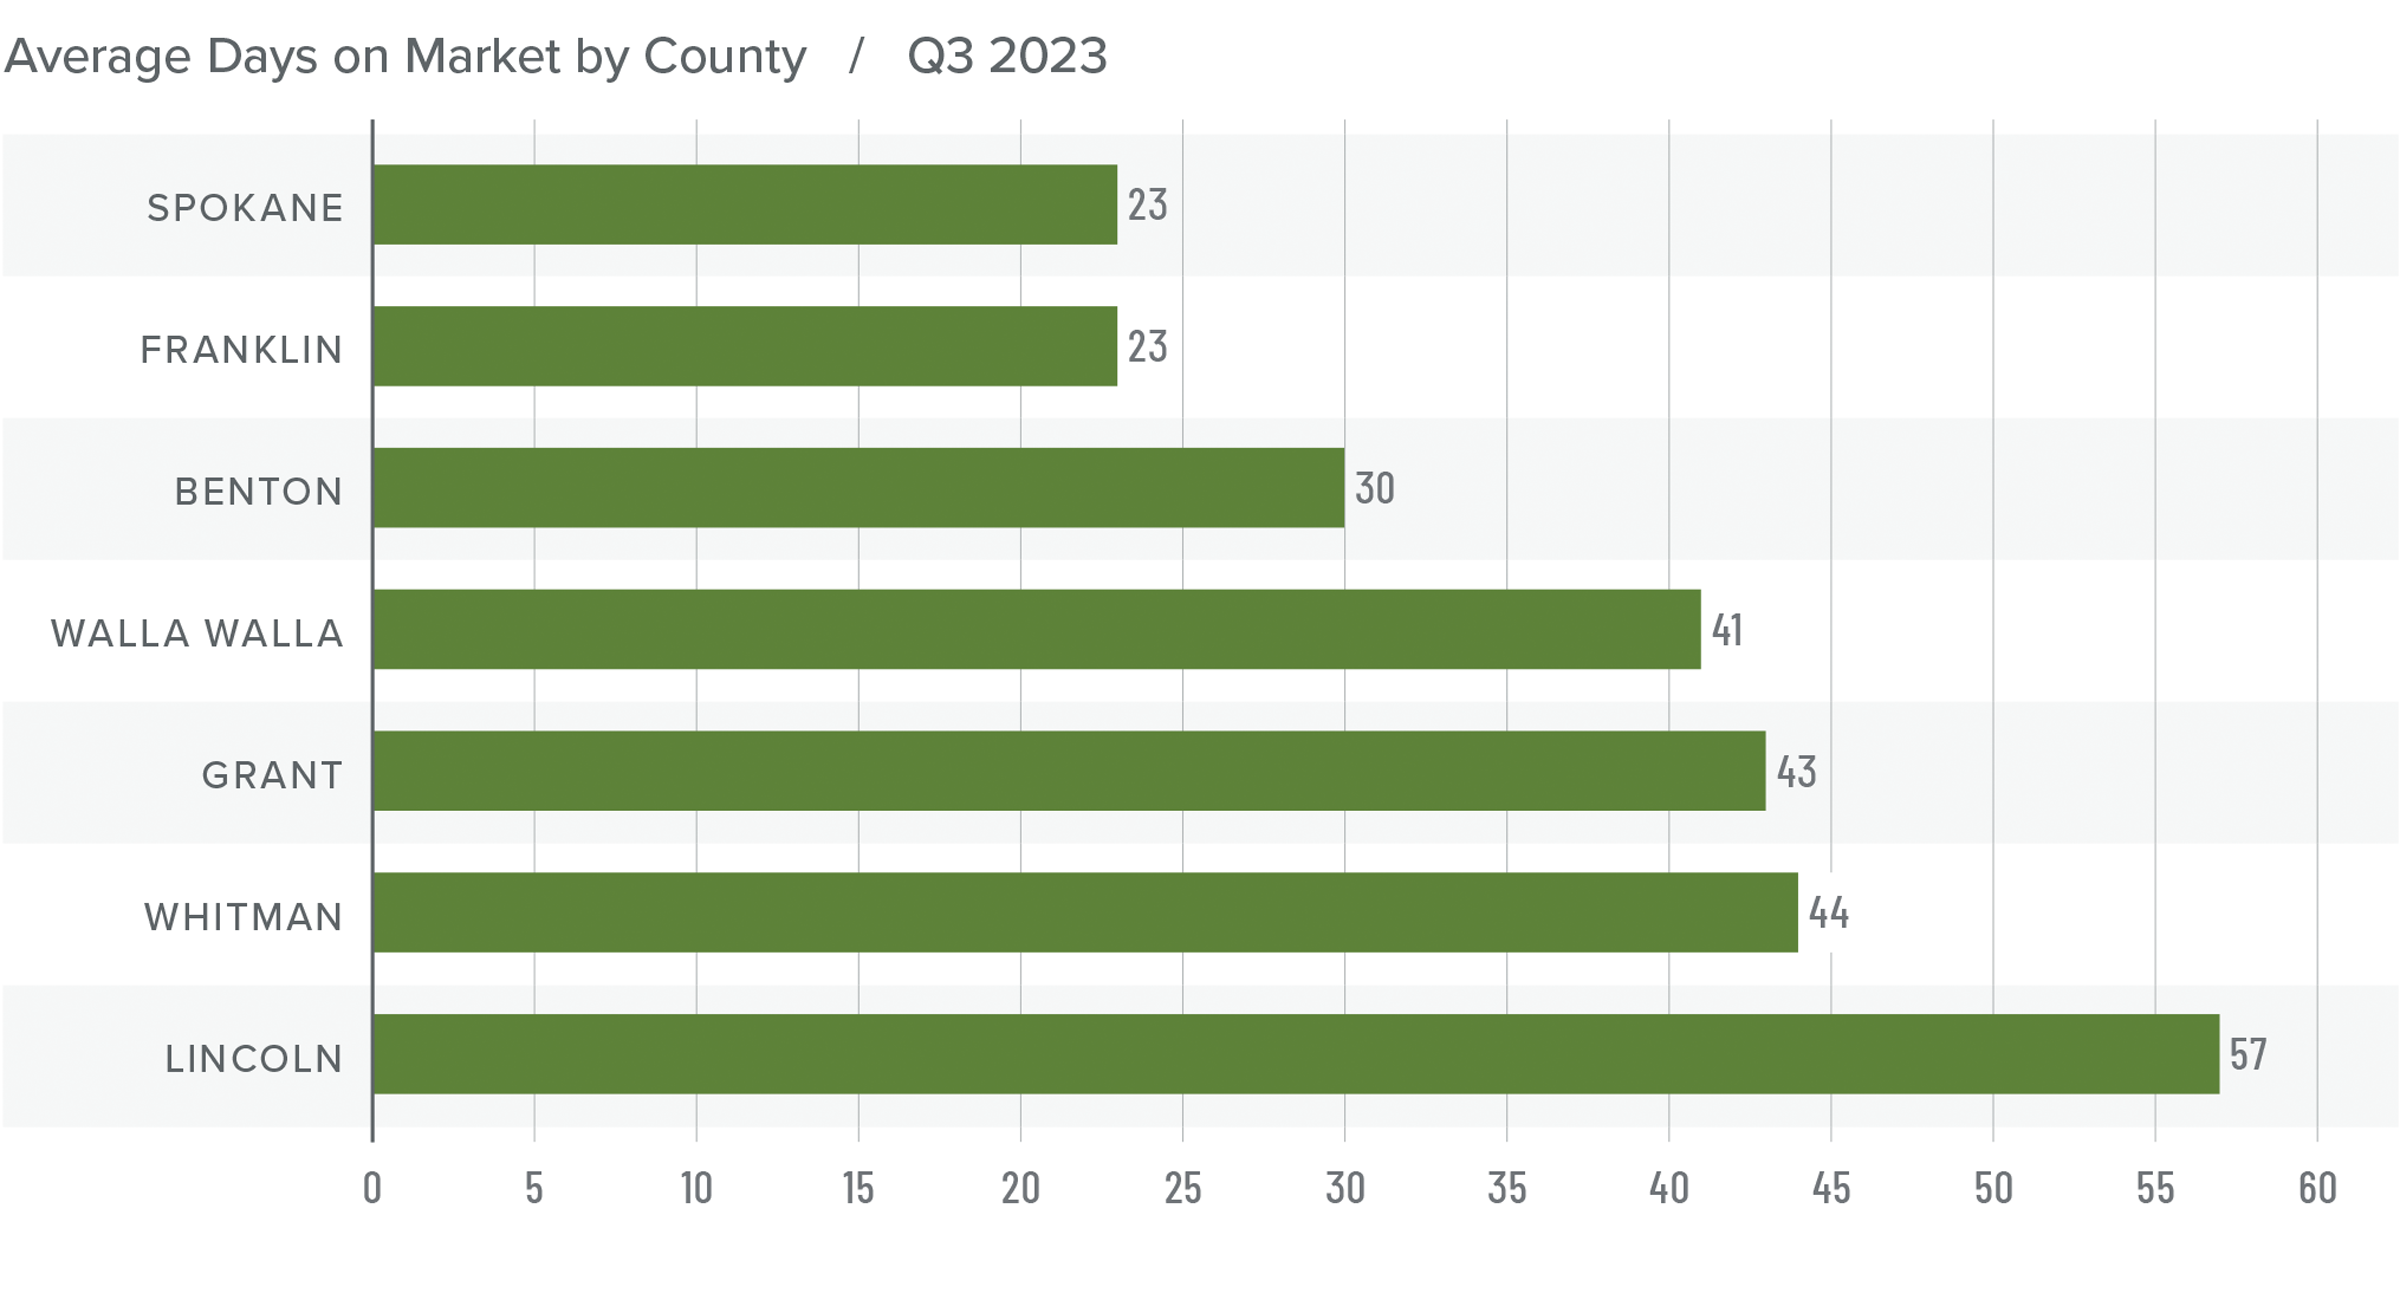
Eastern Washington Days on Market
❱ The average time it took to sell a home in Eastern Washington in the third quarter of 2023 was 37 days, which is 13 more days than during the same period of 2022.
❱ Compared to the second quarter of this year, average days on market fell in Grant, Lincoln, Franklin, and Whitman counties but rose in the rest of the markets. In aggregate, market time was down by one day.
❱ All counties saw market time rise compared to the same period in 2022.
❱ Buyers were still actively looking during the quarter, but they were a little choosier than they have been due to there being more homes for sale.
Conclusions
This speedometer reflects the state of the region’s real estate market using housing inventory, price gains, home sales, interest rates, and larger economic factors.
The market appears to be in a period of transition. Although sales were still happening, the pace of growth during the third quarter was modest. Moreover, listing inventory has risen significantly, which favors home buyers who are faced with decades-high mortgage rates.
Home sale prices were higher and asking prices were up significantly, which is a little counterintuitive given where mortgage rates are sitting. Sellers appear to still be confident.
The market is clearly in a state of flux and will likely continue to be in the coming
months. Buyers are hoping that mortgage rates have peaked, and may even come down by the new year, which is leading to a lot of fence-sitters.
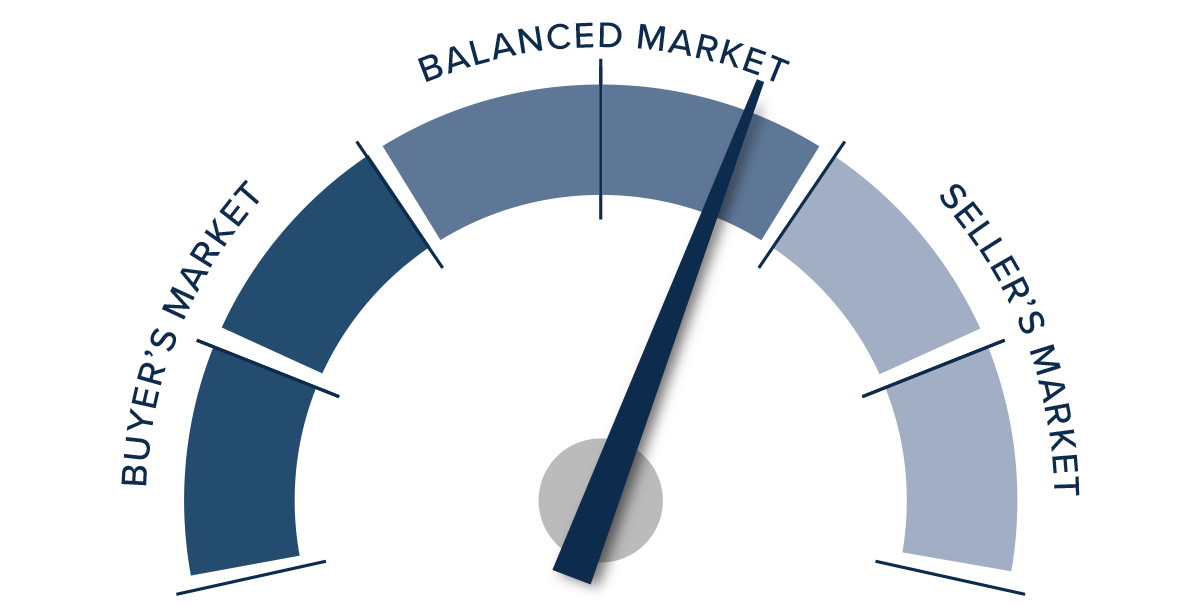
As such, the needle moves back
a little from sellers, but it remains in the
balanced quadrant, as neither side has an
overriding advantage.
")


