
 Facebook
 X
X
 Pinterest
 Copy Link

The following analysis of select counties of the Southern California real estate market is provided by Windermere Real Estate Chief Economist Matthew Gardner. We hope that this information may assist you with making better-informed real estate decisions. For further information about the housing market in your area, please don’t hesitate to contact your Windermere Real Estate agent.
Regional Economic Overview
The Southern California market areas contained in this report added 222,700 jobs over the past 12 months, representing a decent growth rate of 2.4%. Although layoffs in the tech sector and the writers’ strike have been dominating headlines, payrolls in Southern California continue to expand. The Los Angeles market has added over 60,000 jobs through the first five months of this year. This was followed by Orange County, which added 19,000 jobs. San Diego County added 16,600 jobs, and employment grew by 6,700 jobs in Riverside County. The region has seen the pace of employment growth slow, but this appears to be more an issue of labor supply rather than a lack of demand. The region’s unemployment rate in May was 4.3%, up from 3.7% in the same quarter of 2022. The lowest jobless rates were in Orange County (3.2%) and San Diego County (3.5%). The highest rate was in Los Angeles County, where 4.8% of the workforce was without a job.
Southern California Home Sales
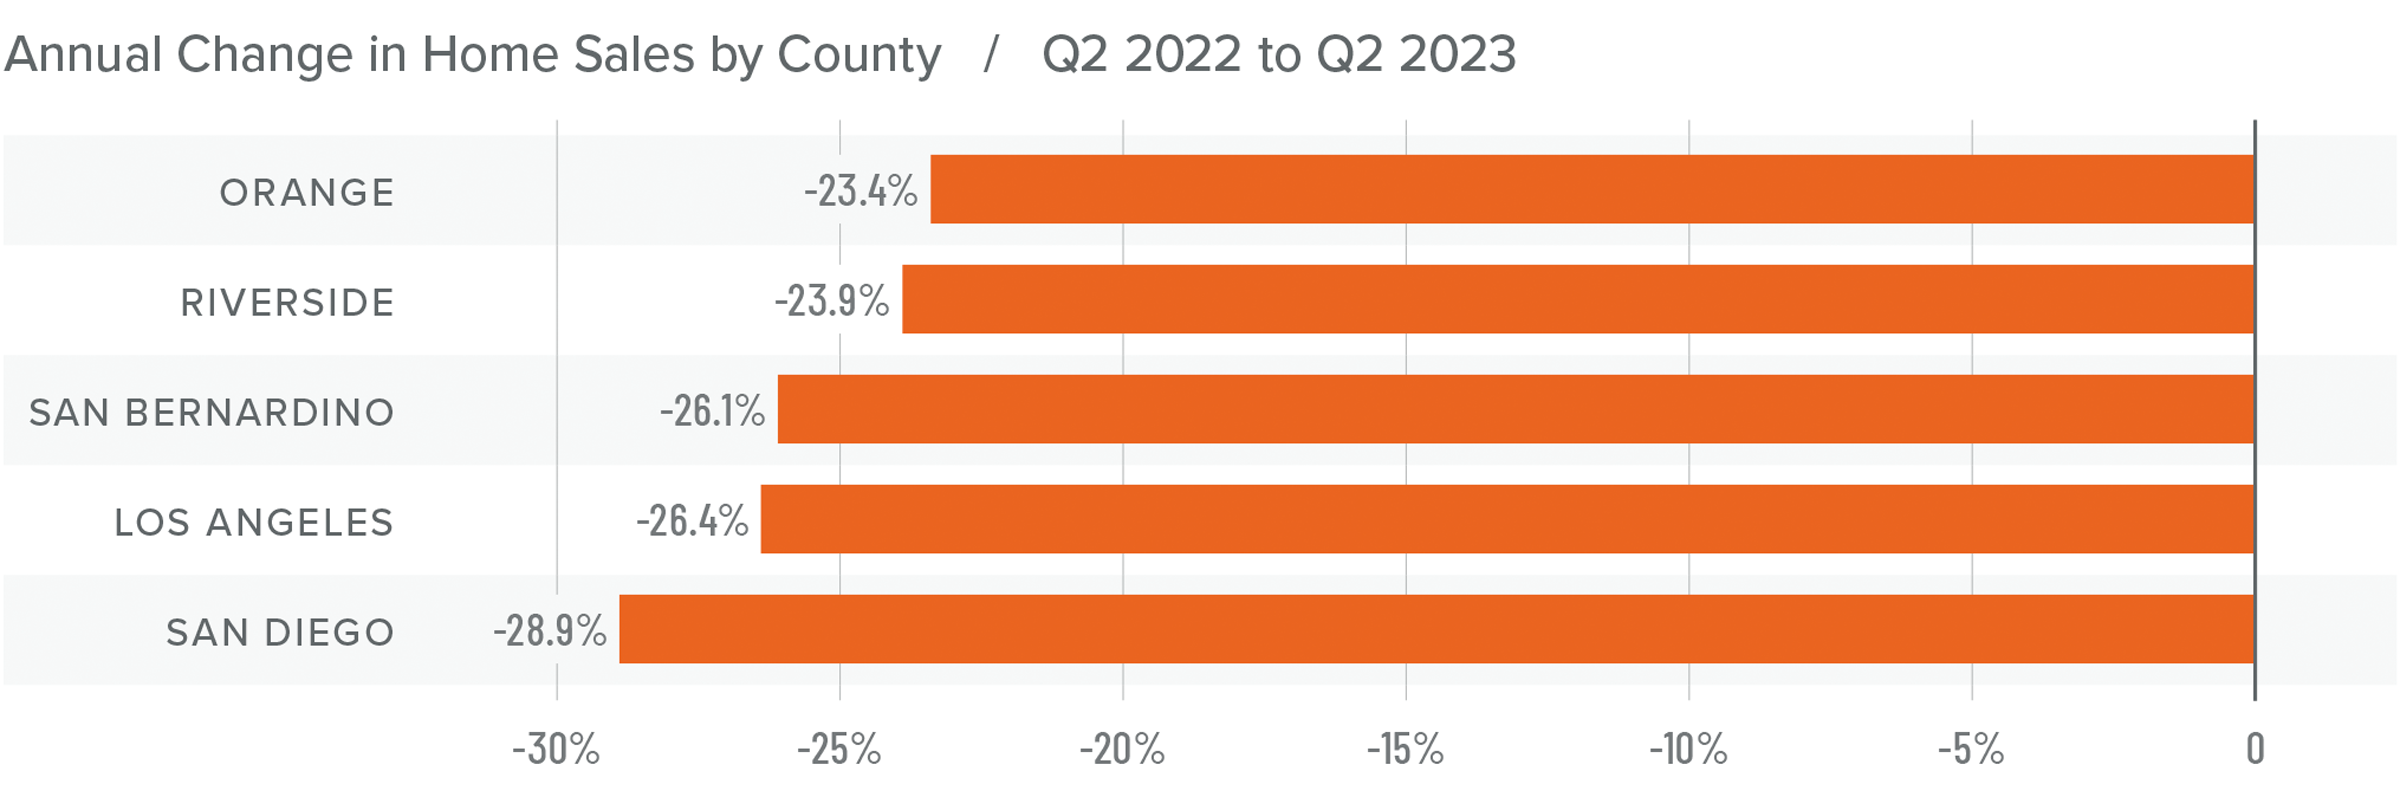
❱ In the second quarter of 2023, 35,381 homes sold, which was 25.9% lower than in the second quarter of 2022 but up an impressive 27.7% compared to the first quarter of 2023.
❱ Pending home sales, an indicator of future closings, were 13.9% higher than in the first quarter, suggesting that sales activity has room to rise further as we move into the second half of the year.
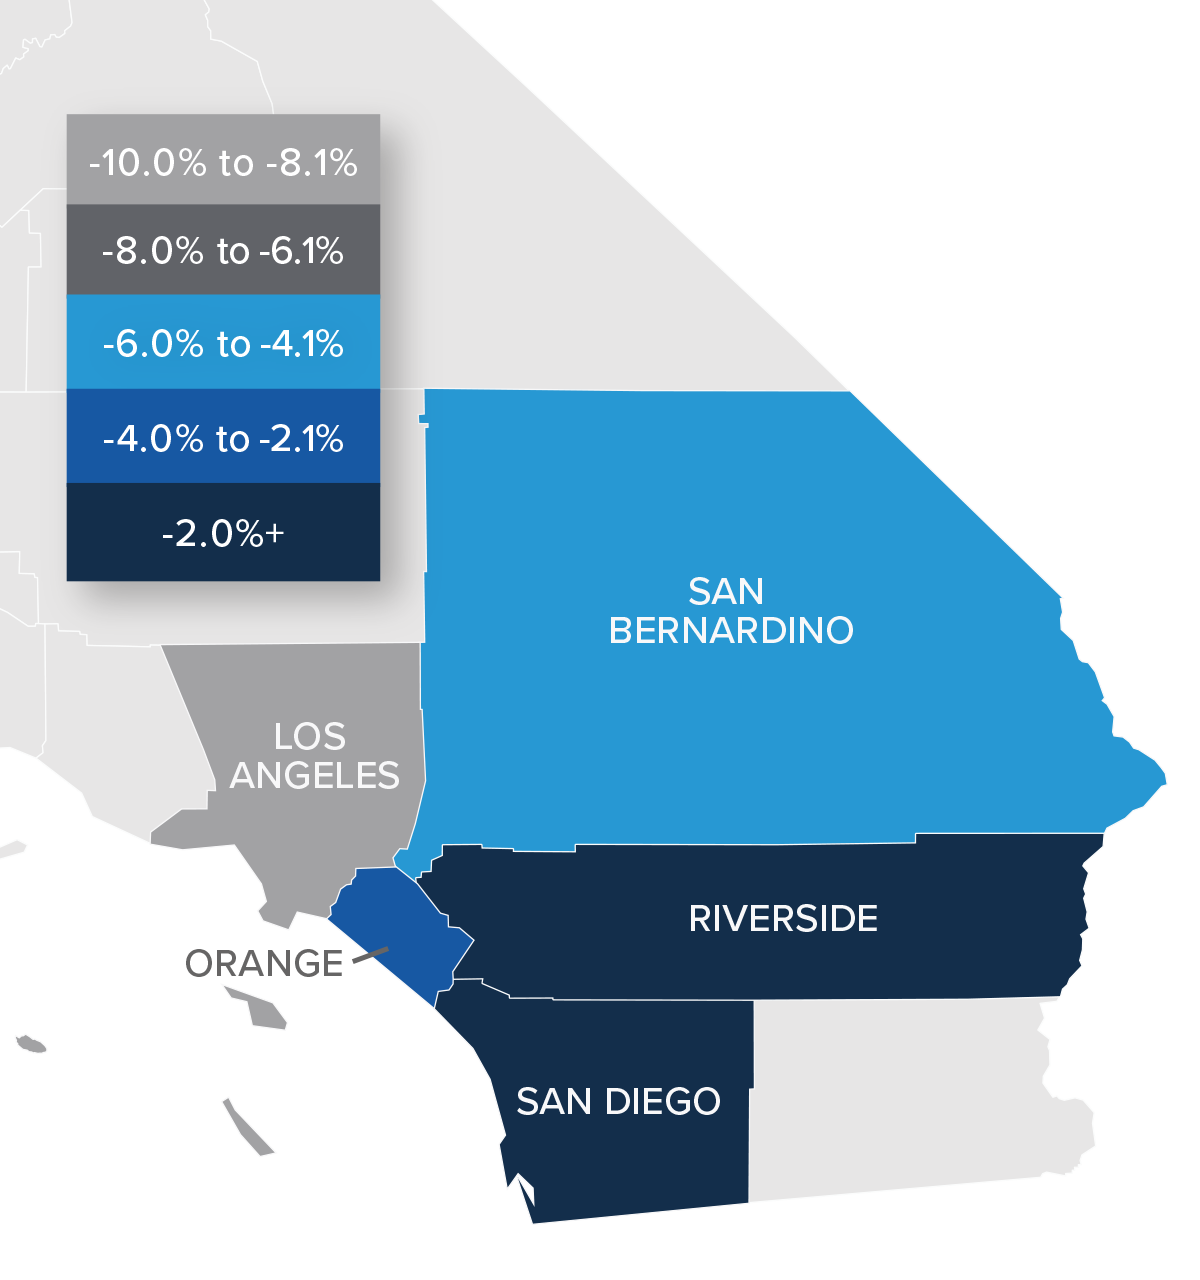
❱ Compared to the same quarter in 2022, sales fell across the board. However, the market heated up in the second quarter compared to the first quarter of 2023: sales were up 36% in Orange County, 29.6% in Los Angeles County, 28.4% in San Bernardino County, 24.3% in Riverside County, and 20.5% in San Diego County.
❱ The growth in sales was even more impressive given significantly rising financing costs in the second quarter.
Southern California Home Prices
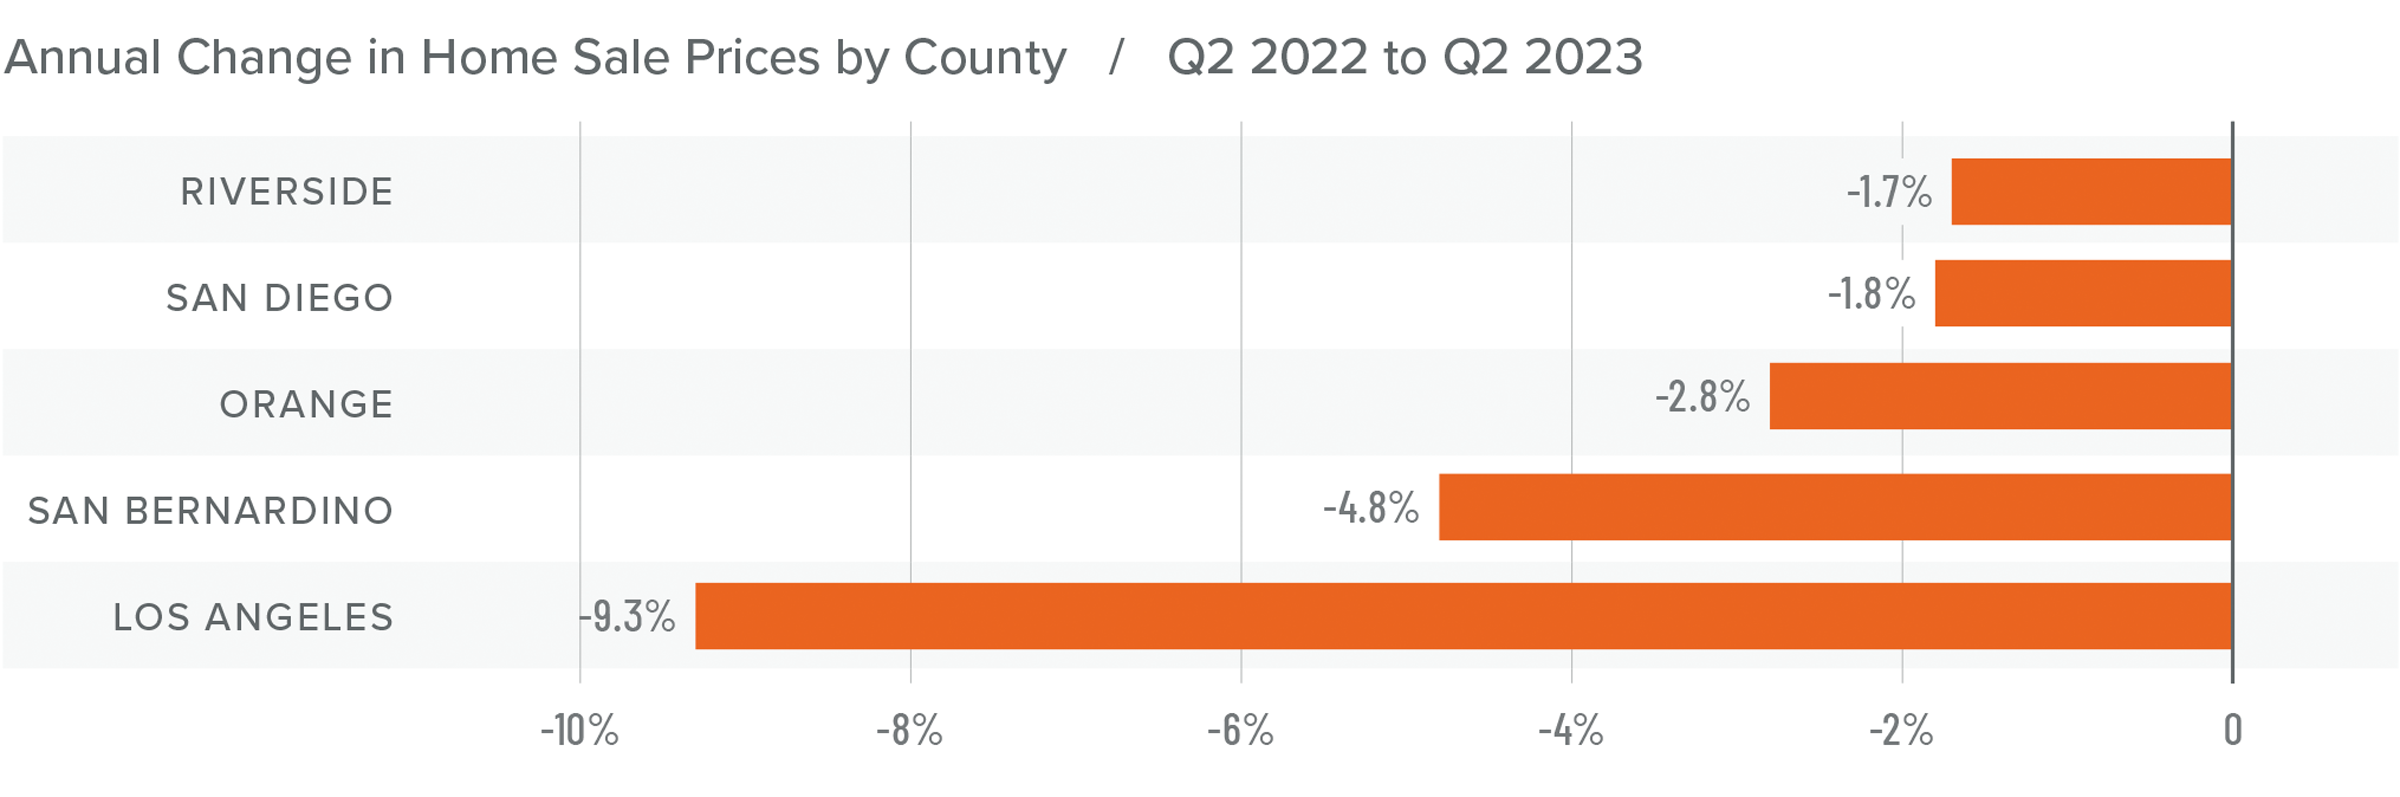
❱ Compared to the second quarter of 2022, home sale prices were 5.5% lower. However, they were 2.1% higher than in the first quarter of 2023.
❱ Affordability continues to be a significant constraint in the region. With median list prices rising 21% in San Diego County and 20% in Los Angeles County compared to the first quarter, it appears that sellers’ confidence levels continue to rise, which will further impact housing affordability.
❱ Year over year, prices pulled back across the region, with a significant drop in Los Angeles County. Compared to the first quarter of 2023, Los Angeles prices fell 4.1%. Closed sale prices rose in the rest of the market areas.
❱ The region has demonstrated significantly more resilience to higher financing costs than expected. As we move through the balance of 2023, I expect prices to rise further, but at a very modest pace.
Mortgage Rates
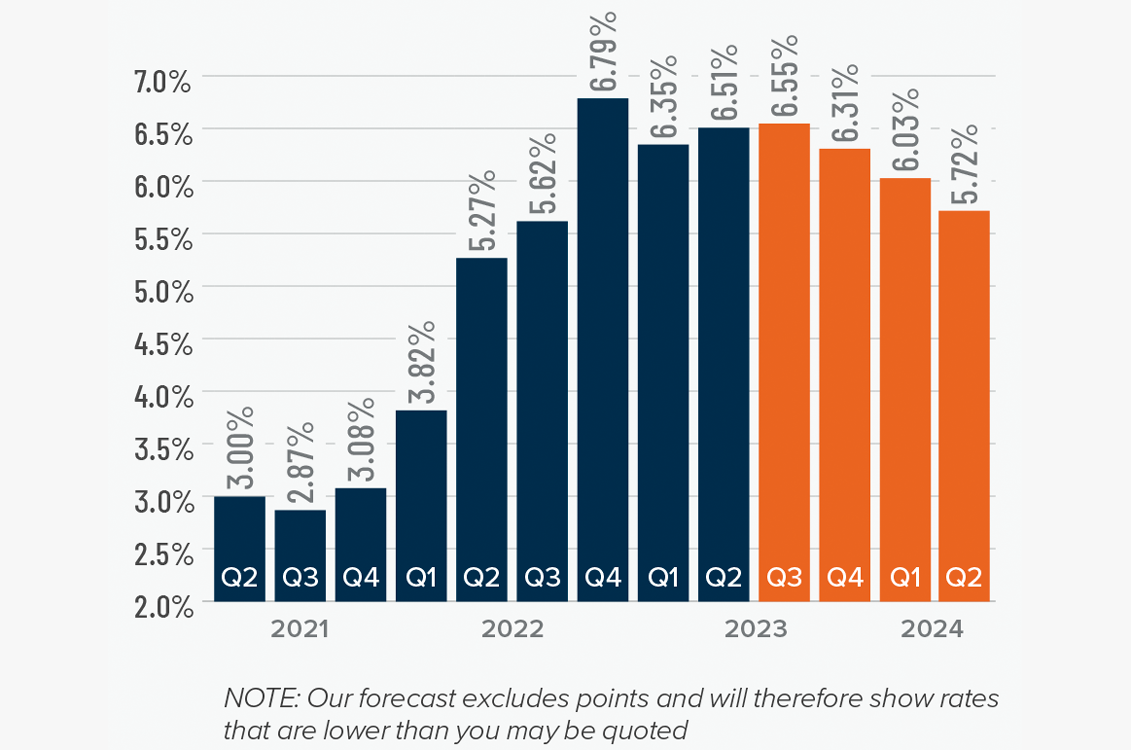
Although they were less erratic than the first quarter, mortgage rates unfortunately trended higher and ended the quarter above 7%. This was due to the short debt ceiling impasse, as well as several economic datasets that suggested the U.S. economy was not slowing at the speed required by the Federal Reserve.
While the June employment report showed fewer jobs created than earlier in the year, as well as downward revisions to prior gains, inflation has not sufficiently slowed. Until it does, rates cannot start to trend consistently lower. With the economy not slowing as fast as expected, I have adjusted my forecast: Rates will hold at current levels in third quarter and then start to trend lower through the fall. Although there are sure to be occasional spikes, my model now shows the 30-year fixed rate breaking below 6% next spring.
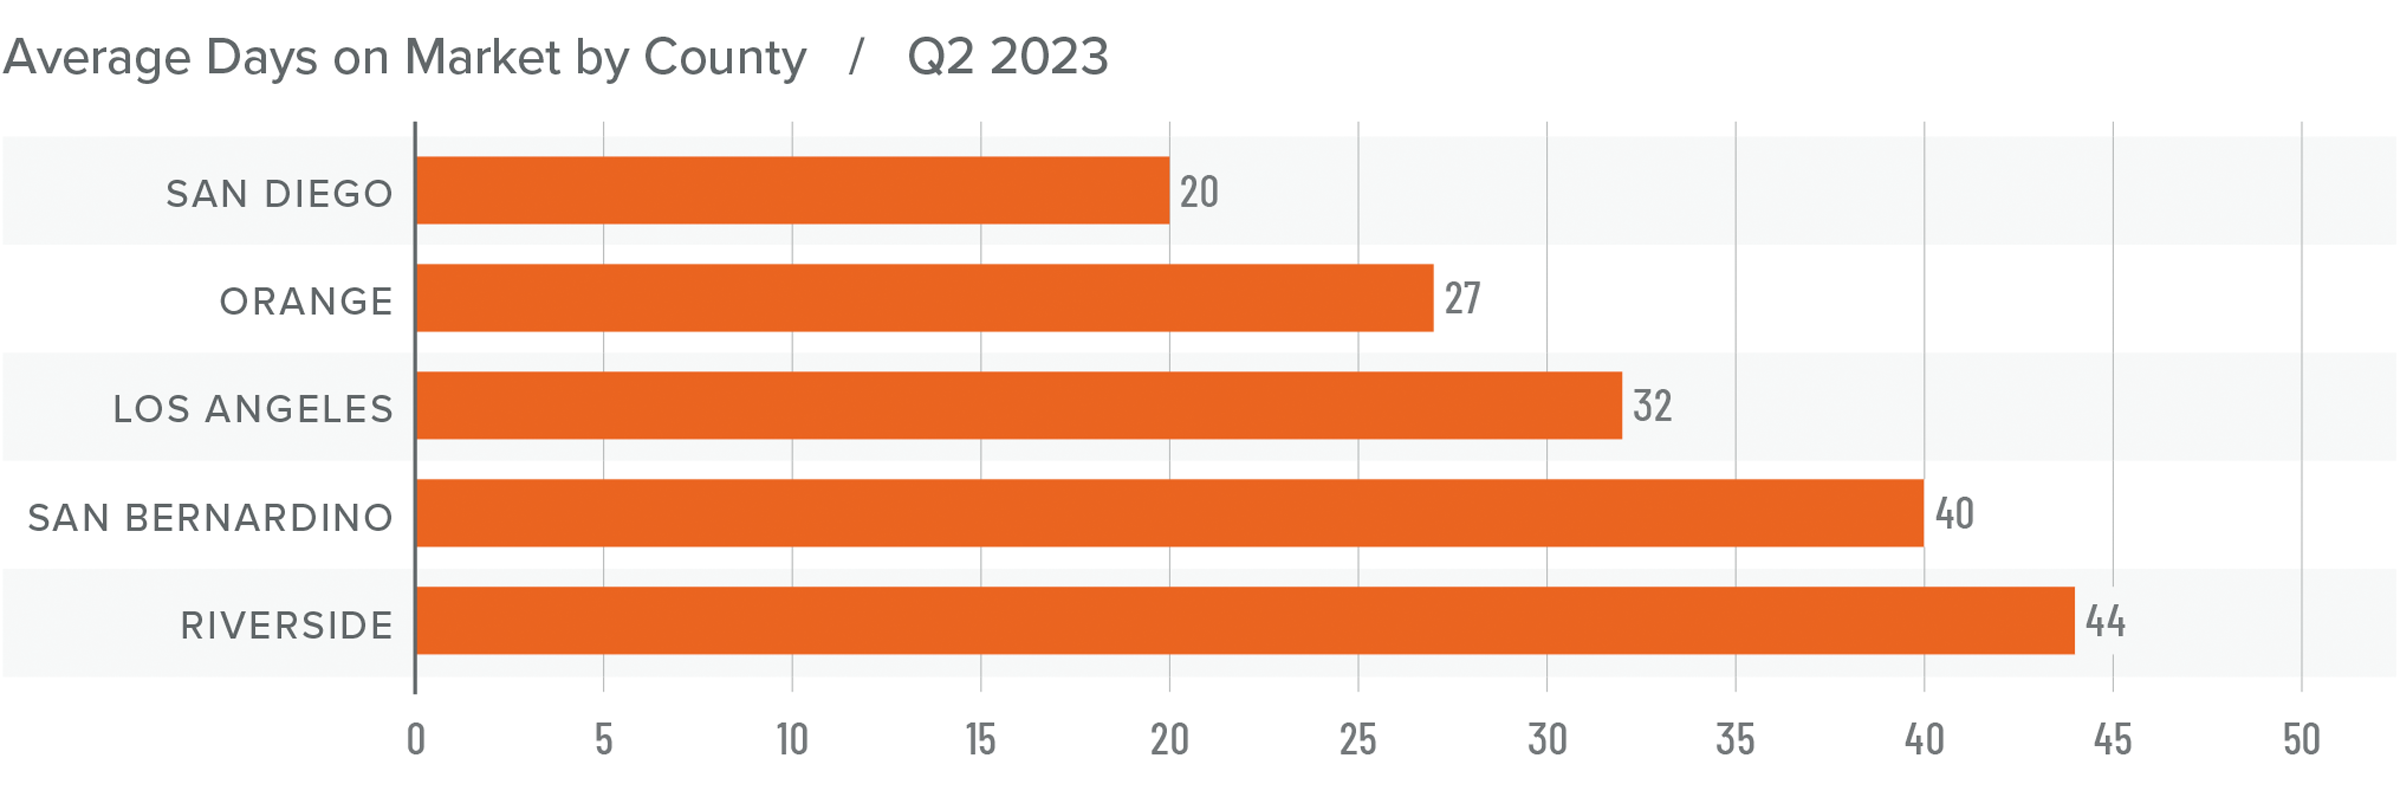
Southern California Days on Market
❱ In the second quarter of 2023, the average time it took to sell a home in the region was 32 days, which was 16 more than in the second quarter of 2022 but 13 fewer days than in the first quarter of 2023.
❱ Compared to the first quarter of 2023, market time fell in all counties covered by this report.
❱ Homes in San Diego County continue to sell at a faster rate than other markets in the region, but all counties saw market time increase from a year ago.
❱ Home buyers appear to be resigned to the fact that supply levels are unlikely to improve any time soon and believe that prices are not going to fall further. This is leading them to pursue buying a home even if mortgage rates remain very high, with the hope they will be able to refinance when rates eventually fall.
Conclusions
This speedometer reflects the state of the region’s real estate market using housing inventory, price gains, home sales, interest rates, and larger economic factors.
Home prices have stabilized and are starting to trend higher again. This is counterintuitive, especially given that mortgage rates are higher than the market has seen in over 15 years. However, the reason for this is straightforward: a lack of supply is bolstering home values. It will only be when supply levels rise to match demand that we will start to move toward a more balanced market. The issue, though, is that 85.7% of California homeowners with a mortgage have an average interest rate below 5%, and 30% have rates at or below 3%. I find it highly unlikely that homeowners will give up their current rate unless they absolutely have to, which is holding back supply.
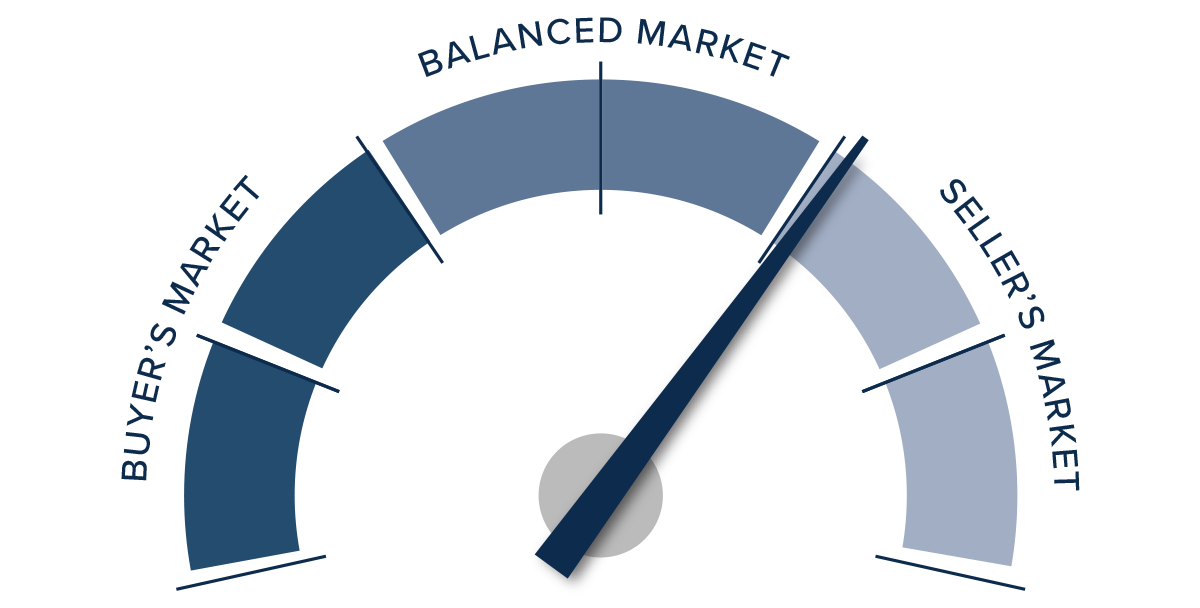
Homeowners who do decide to sell are aware of this and are increasingly confident in their ability to sell their homes regardless of mortgage rates. Given these factors, I have moved the needle into the seller’s sector of the speedometer.
About Matthew Gardner

As Chief Economist for Windermere Real Estate, Matthew Gardner is responsible for analyzing and interpreting economic data and its impact on the real estate market on both a local and national level. Matthew has over 30 years of professional experience both in the U.S. and U.K.
In addition to his day-to-day responsibilities, Matthew sits on the Washington State Governors Council of Economic Advisors; chairs the Board of Trustees at the Washington Center for Real Estate Research at the University of Washington; and is an Advisory Board Member at the Runstad Center for Real Estate Studies at the University of Washington where he also lectures in real estate economics.
")


