
 Facebook
 X
X
 Pinterest
 Copy Link

The following analysis of the greater Las Vegas real estate market is provided by Windermere Real Estate Chief Economist Matthew Gardner. We hope that this information may assist you with making better-informed real estate decisions. For further information about the housing market in your area, please don’t hesitate to contact your Windermere Real Estate agent.
Regional Economic Overview
Though employment growth in the Las Vegas area continues, the pace has been frenetic. The average monthly growth so far in 2022 has been about half as fast as 2021’s pace. That said, the market has recovered all but 6,800 of the 287,000 jobs that were lost during the pandemic. In the first quarter Gardner Report, I predicted that the area would return to pre-COVID employment levels by the spring. I am optimistic that when the June data is released, the region will have seen a full recovery. With rising employment, more residents started to look for work, which has grown the labor force quite significantly. That said, even though the unemployment rate remains higher than the U.S., it was still measured at a respectable 5.2%.
Nevada Home Sales
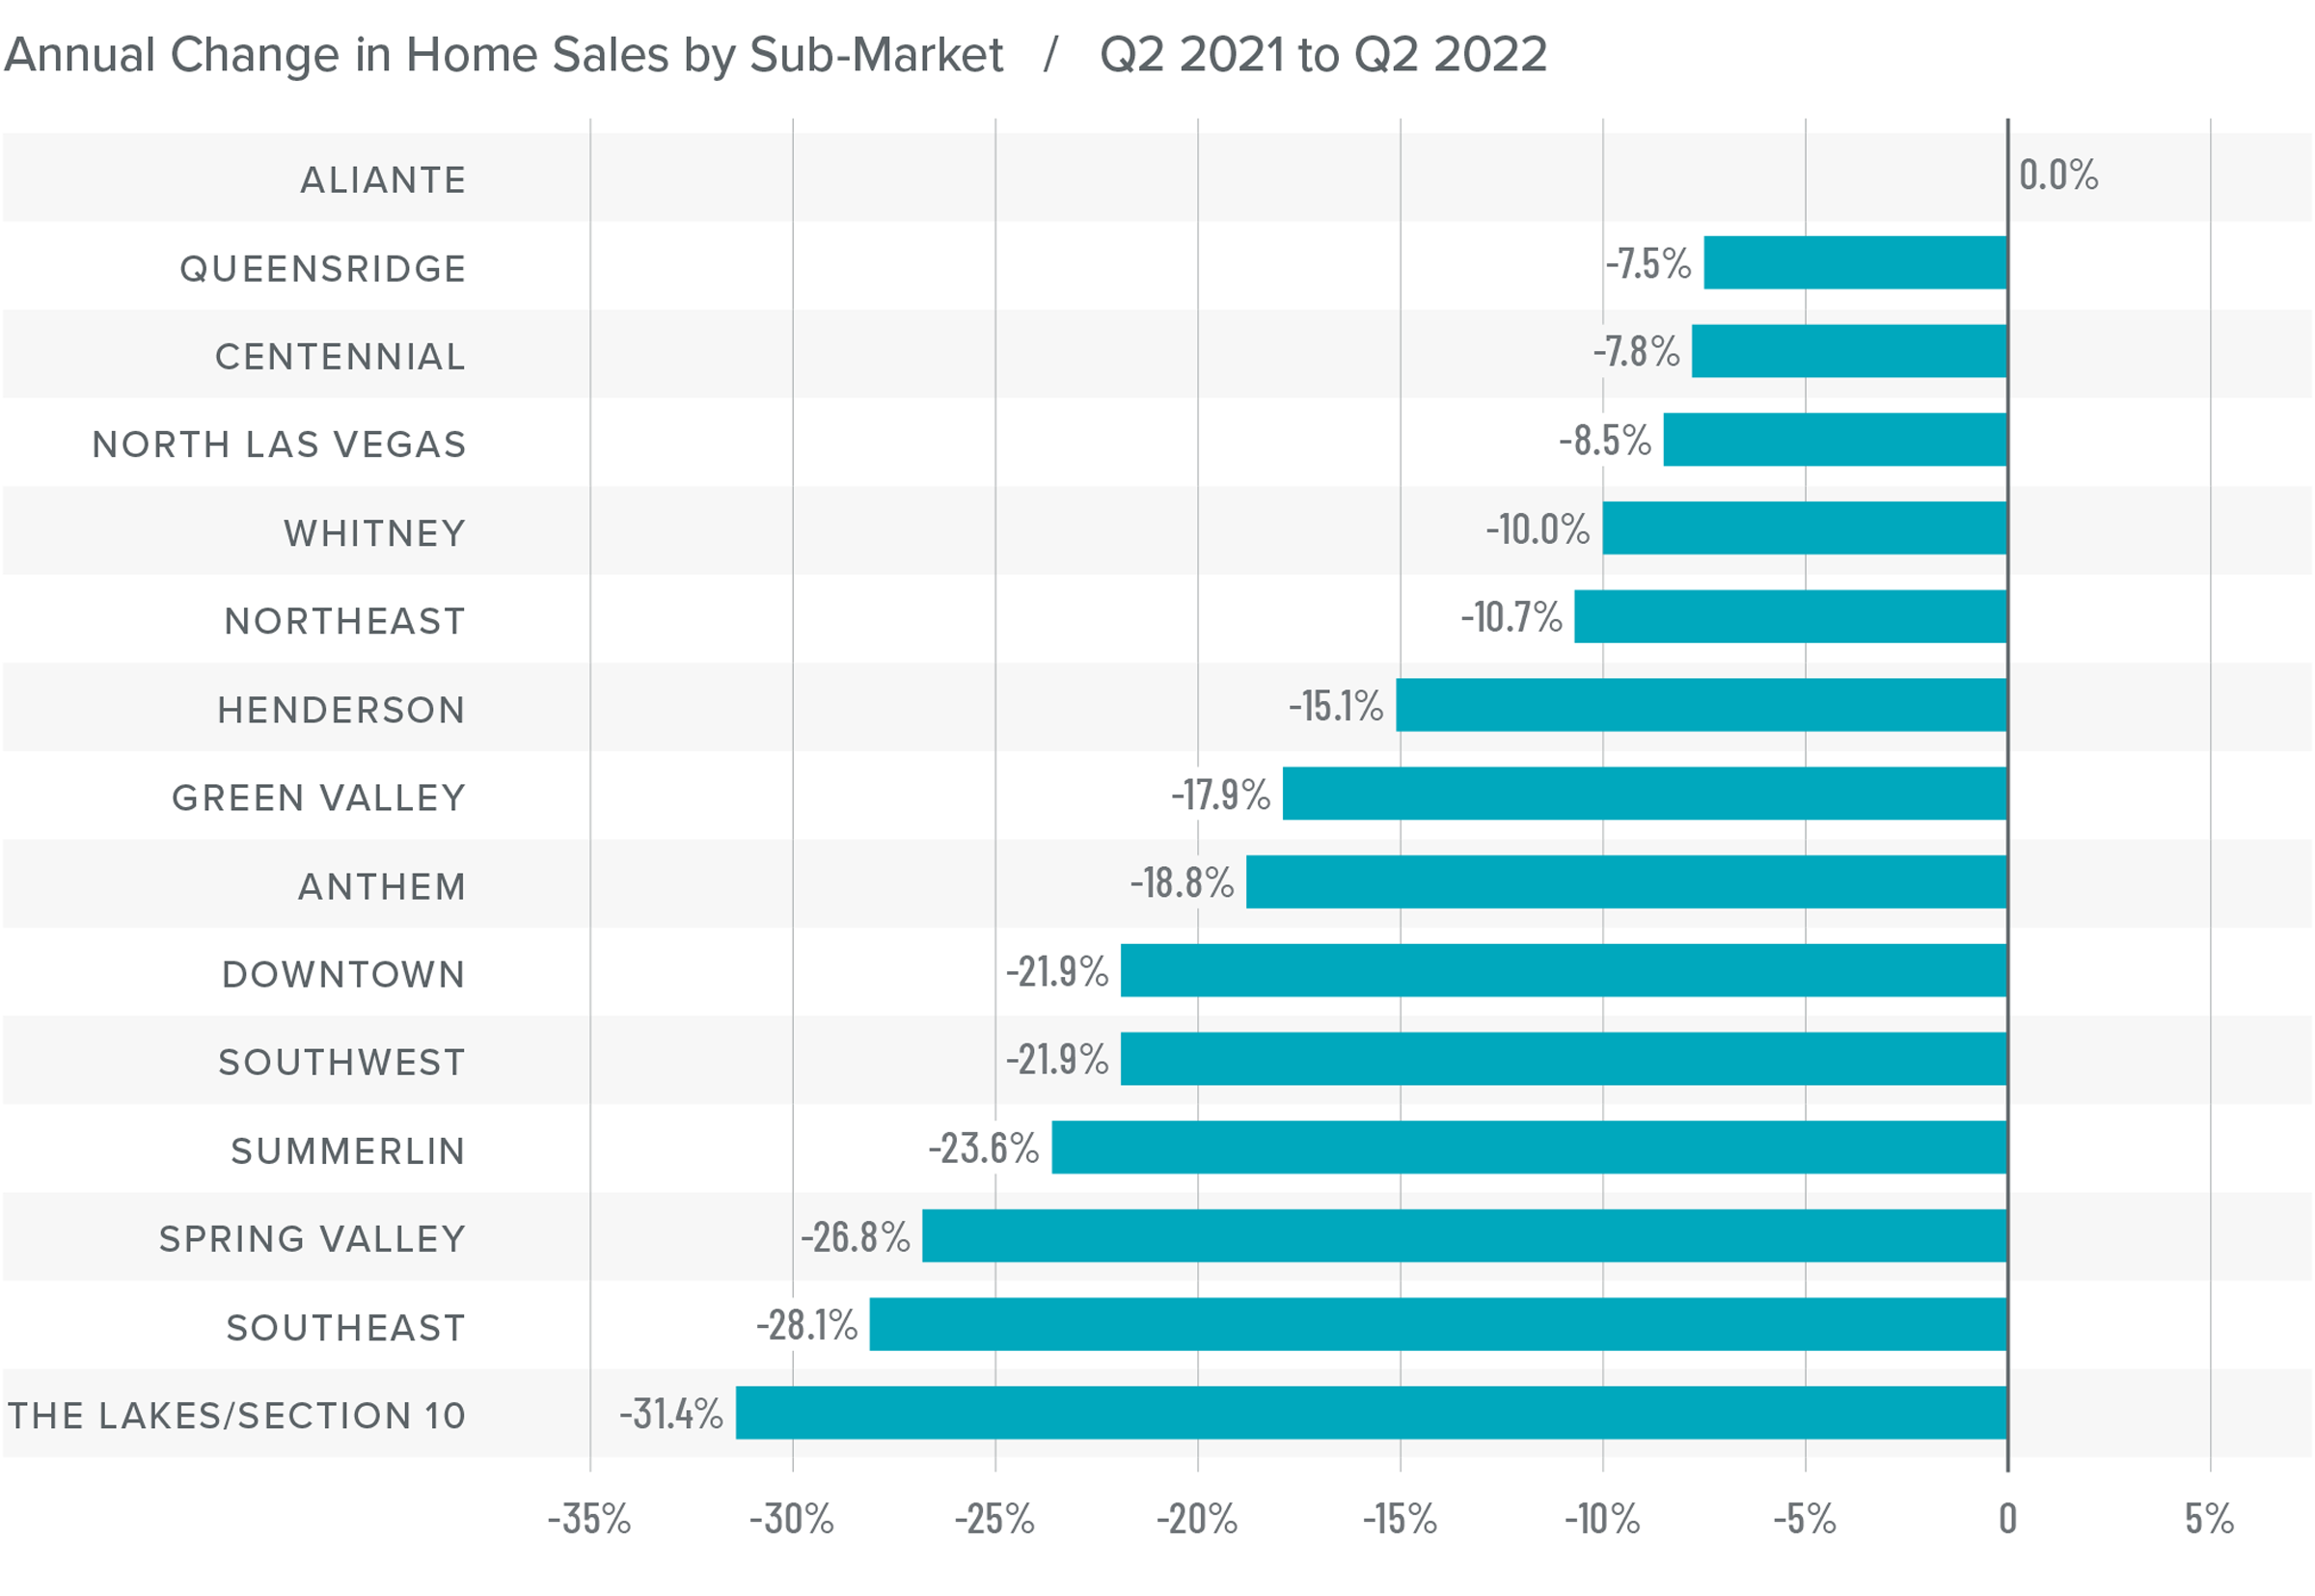
❱ A total of 9,365 homes sold in the second quarter, which was a drop of 17.4% compared to the same period a year ago. Sales rose 2.7% compared to the first quarter of this year.
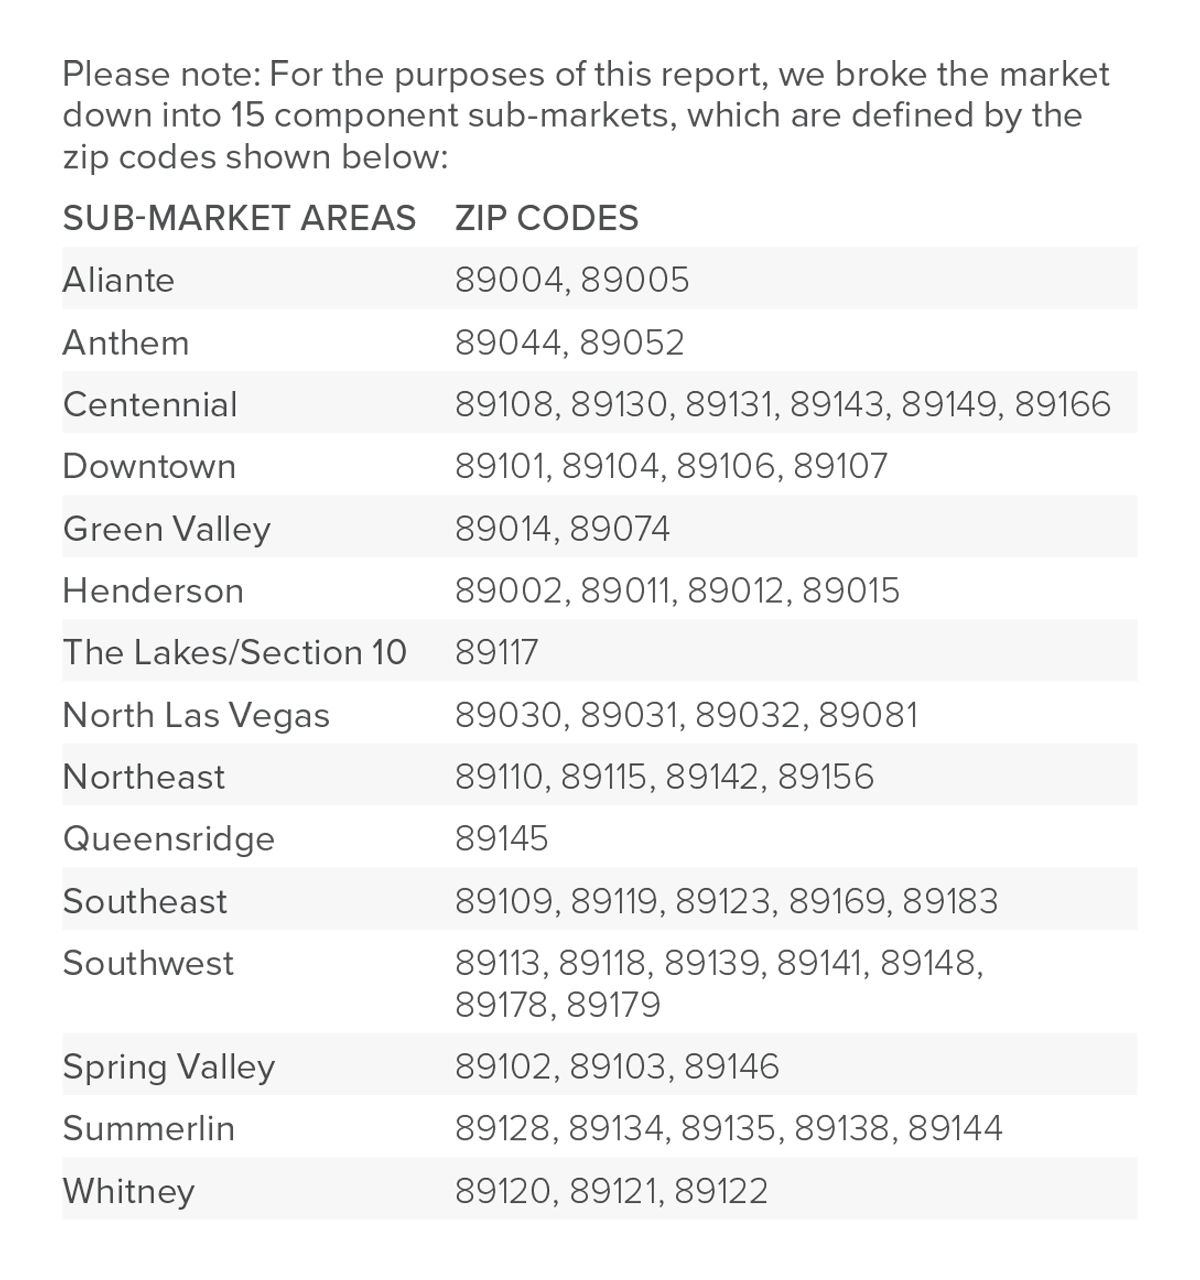
❱ Year over year, fewer transactions occurred in every neighborhood contained in this report, but rose in all but five areas compared to the first quarter of 2022. The Aliante, Queens Ridge, and Centennial areas all saw solid growth.
❱ Supply constraints have subsided, with the average number of listings almost doubling between the first and second quarters. This is good news for prospective home buyers.
❱ Pending sales, which are an indicator of future closings, fell 11.2% compared to the prior quarter, suggesting that growth in closings in the third quarter may be modest.
Nevada Home Prices
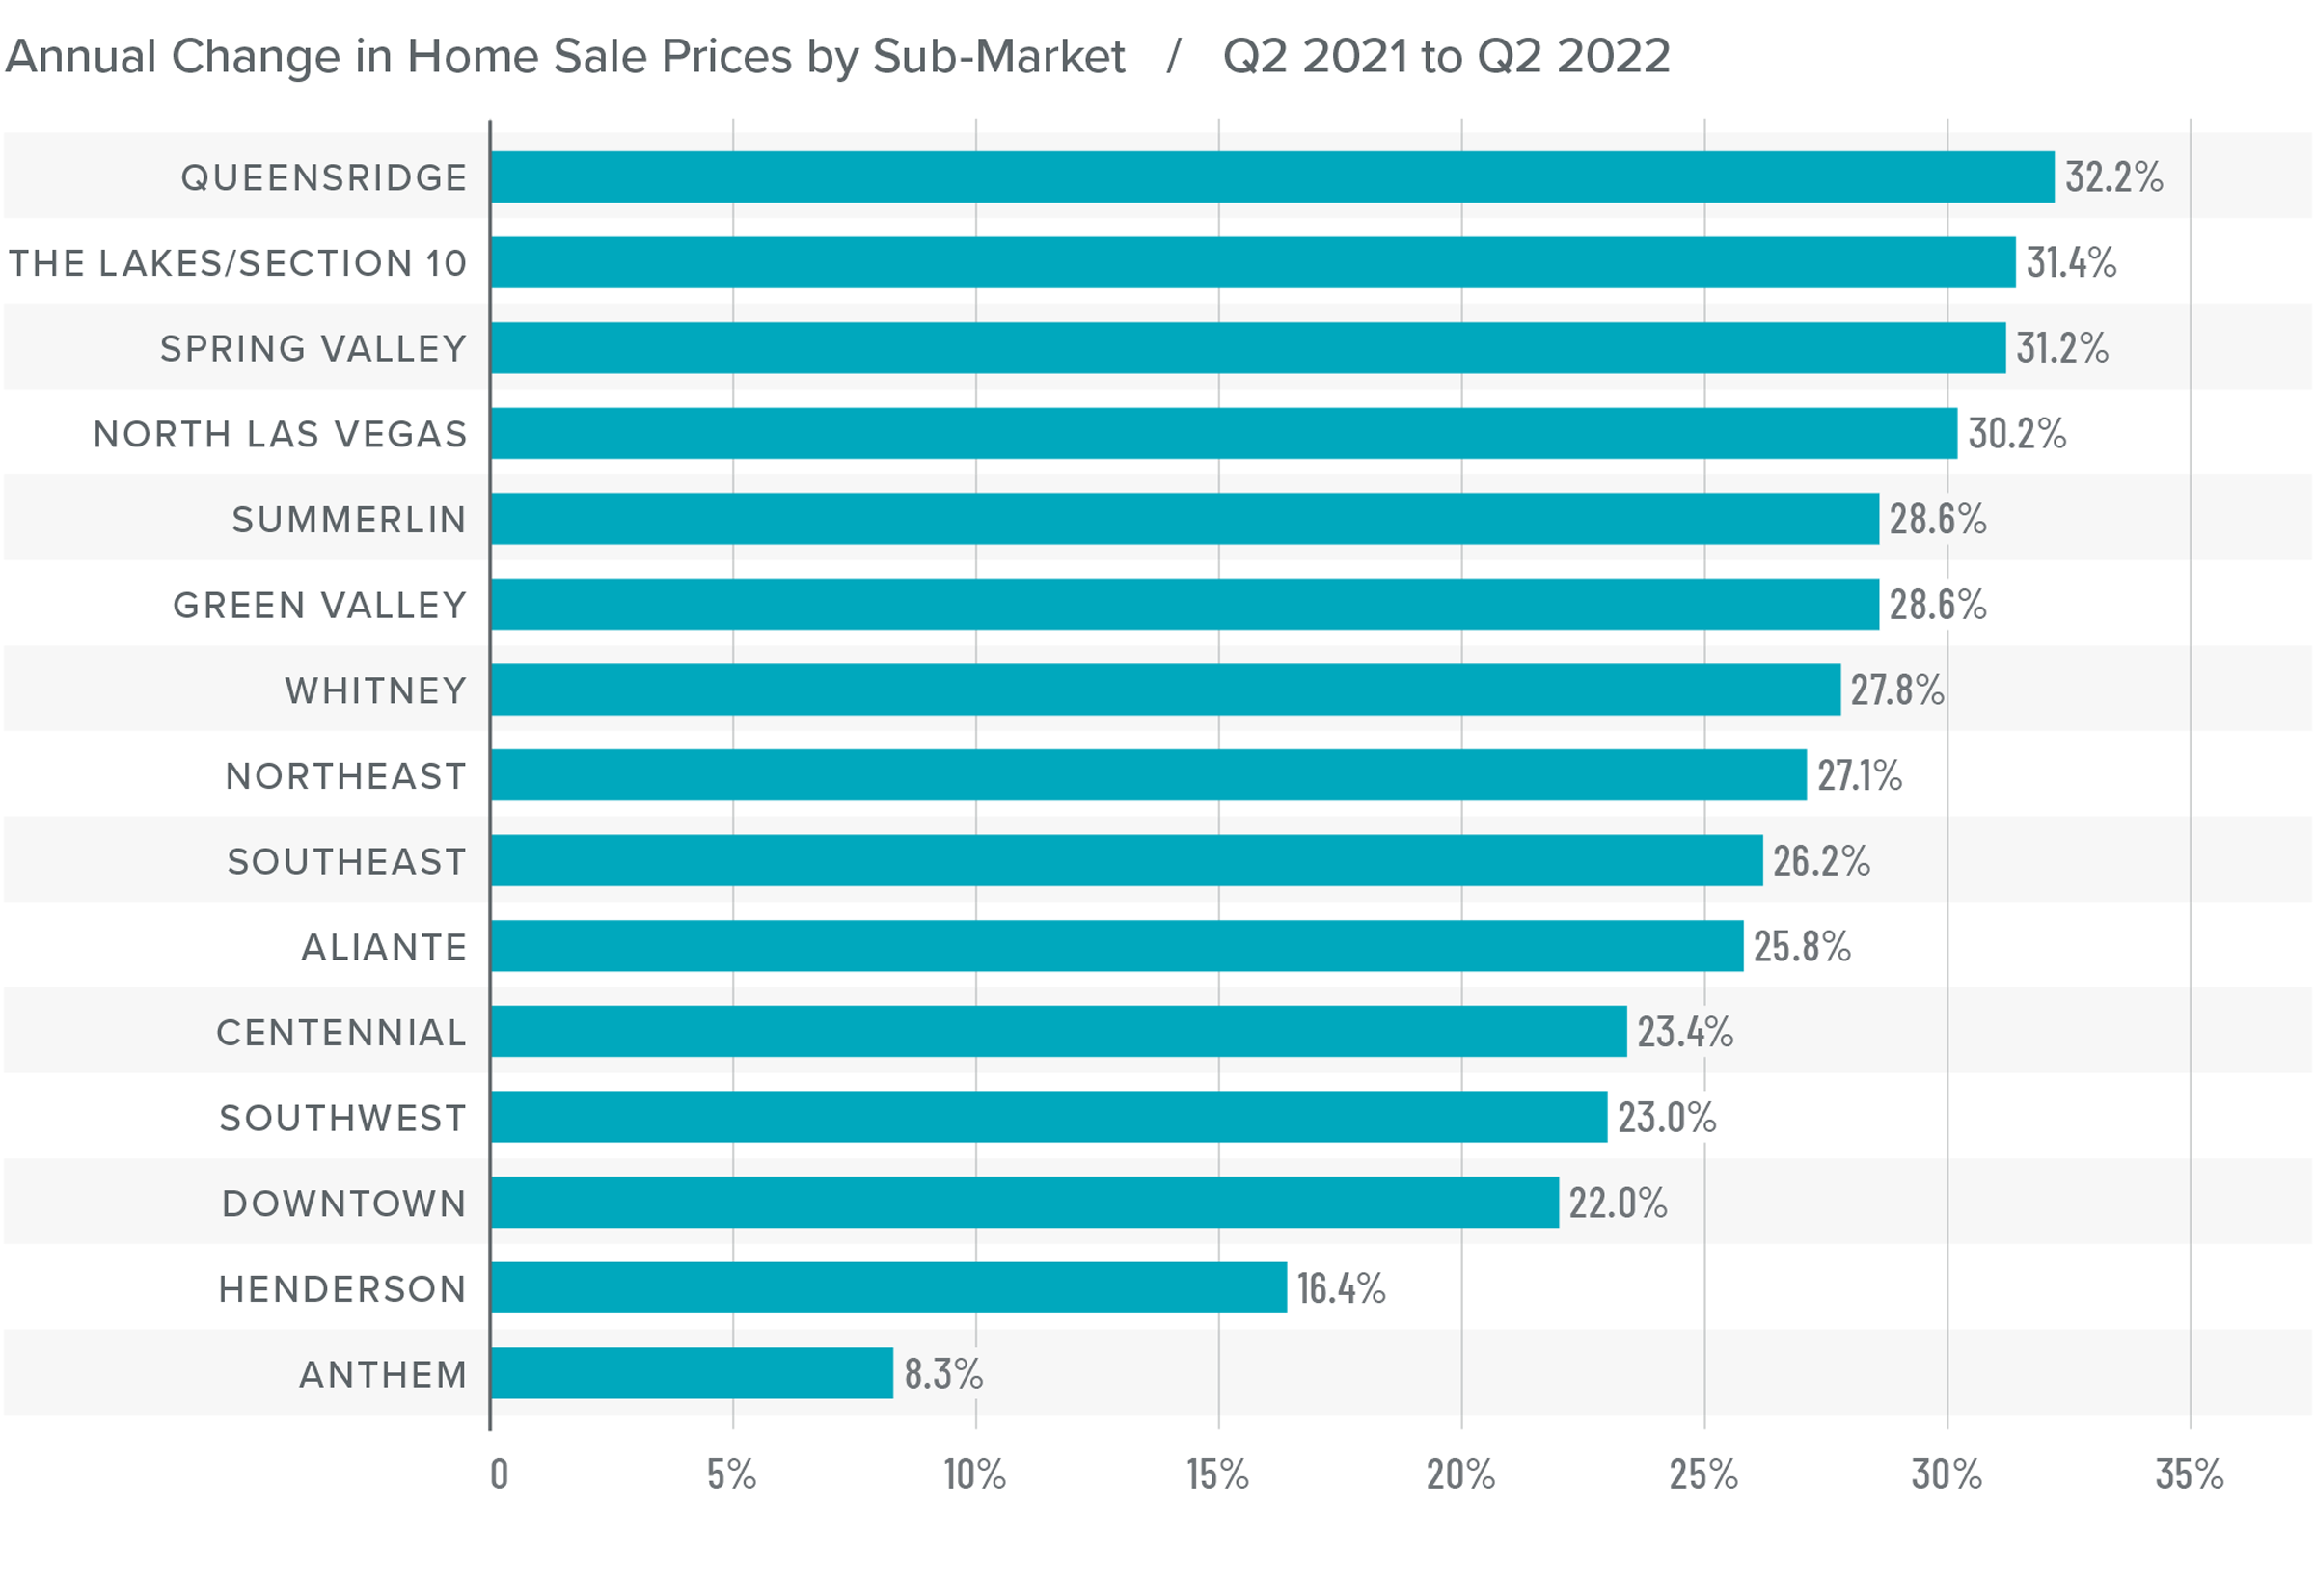
❱ Home prices rose 22.8% from a year ago to an average of $526,289. They were 8.3% higher than in the first quarter of 2022.
❱ With the jump in interest rates, I have been closely monitoring list prices to see if higher financing costs are having an impact on them. So far, they appear not to be. Median list prices rose by more than 13% compared to the first quarter. Only Spring Valley saw list prices fall.
❱ Year over year, prices rose by double digits in every neighborhood other than Anthem, and rose in all markets other than Spring Valley compared to the first quarter of this year.
❱ The market appears to still be fairly bullish, but I sense that it will start to move back toward equilibrium as financing costs and affordability become greater headwinds.
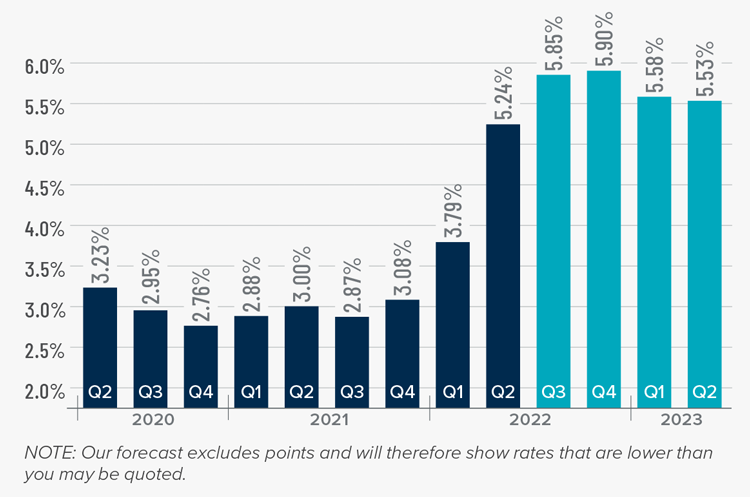
Mortgage Rates
Although mortgage rates did drop in June, the quarterly trend was still moving higher. Inflation—the bane of bonds and, therefore, mortgage rates—has yet to slow, which is putting upward pressure on financing costs.
That said, there are some signs that inflation is starting to soften and if this starts to show in upcoming Consumer Price Index numbers then rates will likely find a ceiling. I am hopeful this will be the case at some point in the third quarter, which is reflected in my forecast.
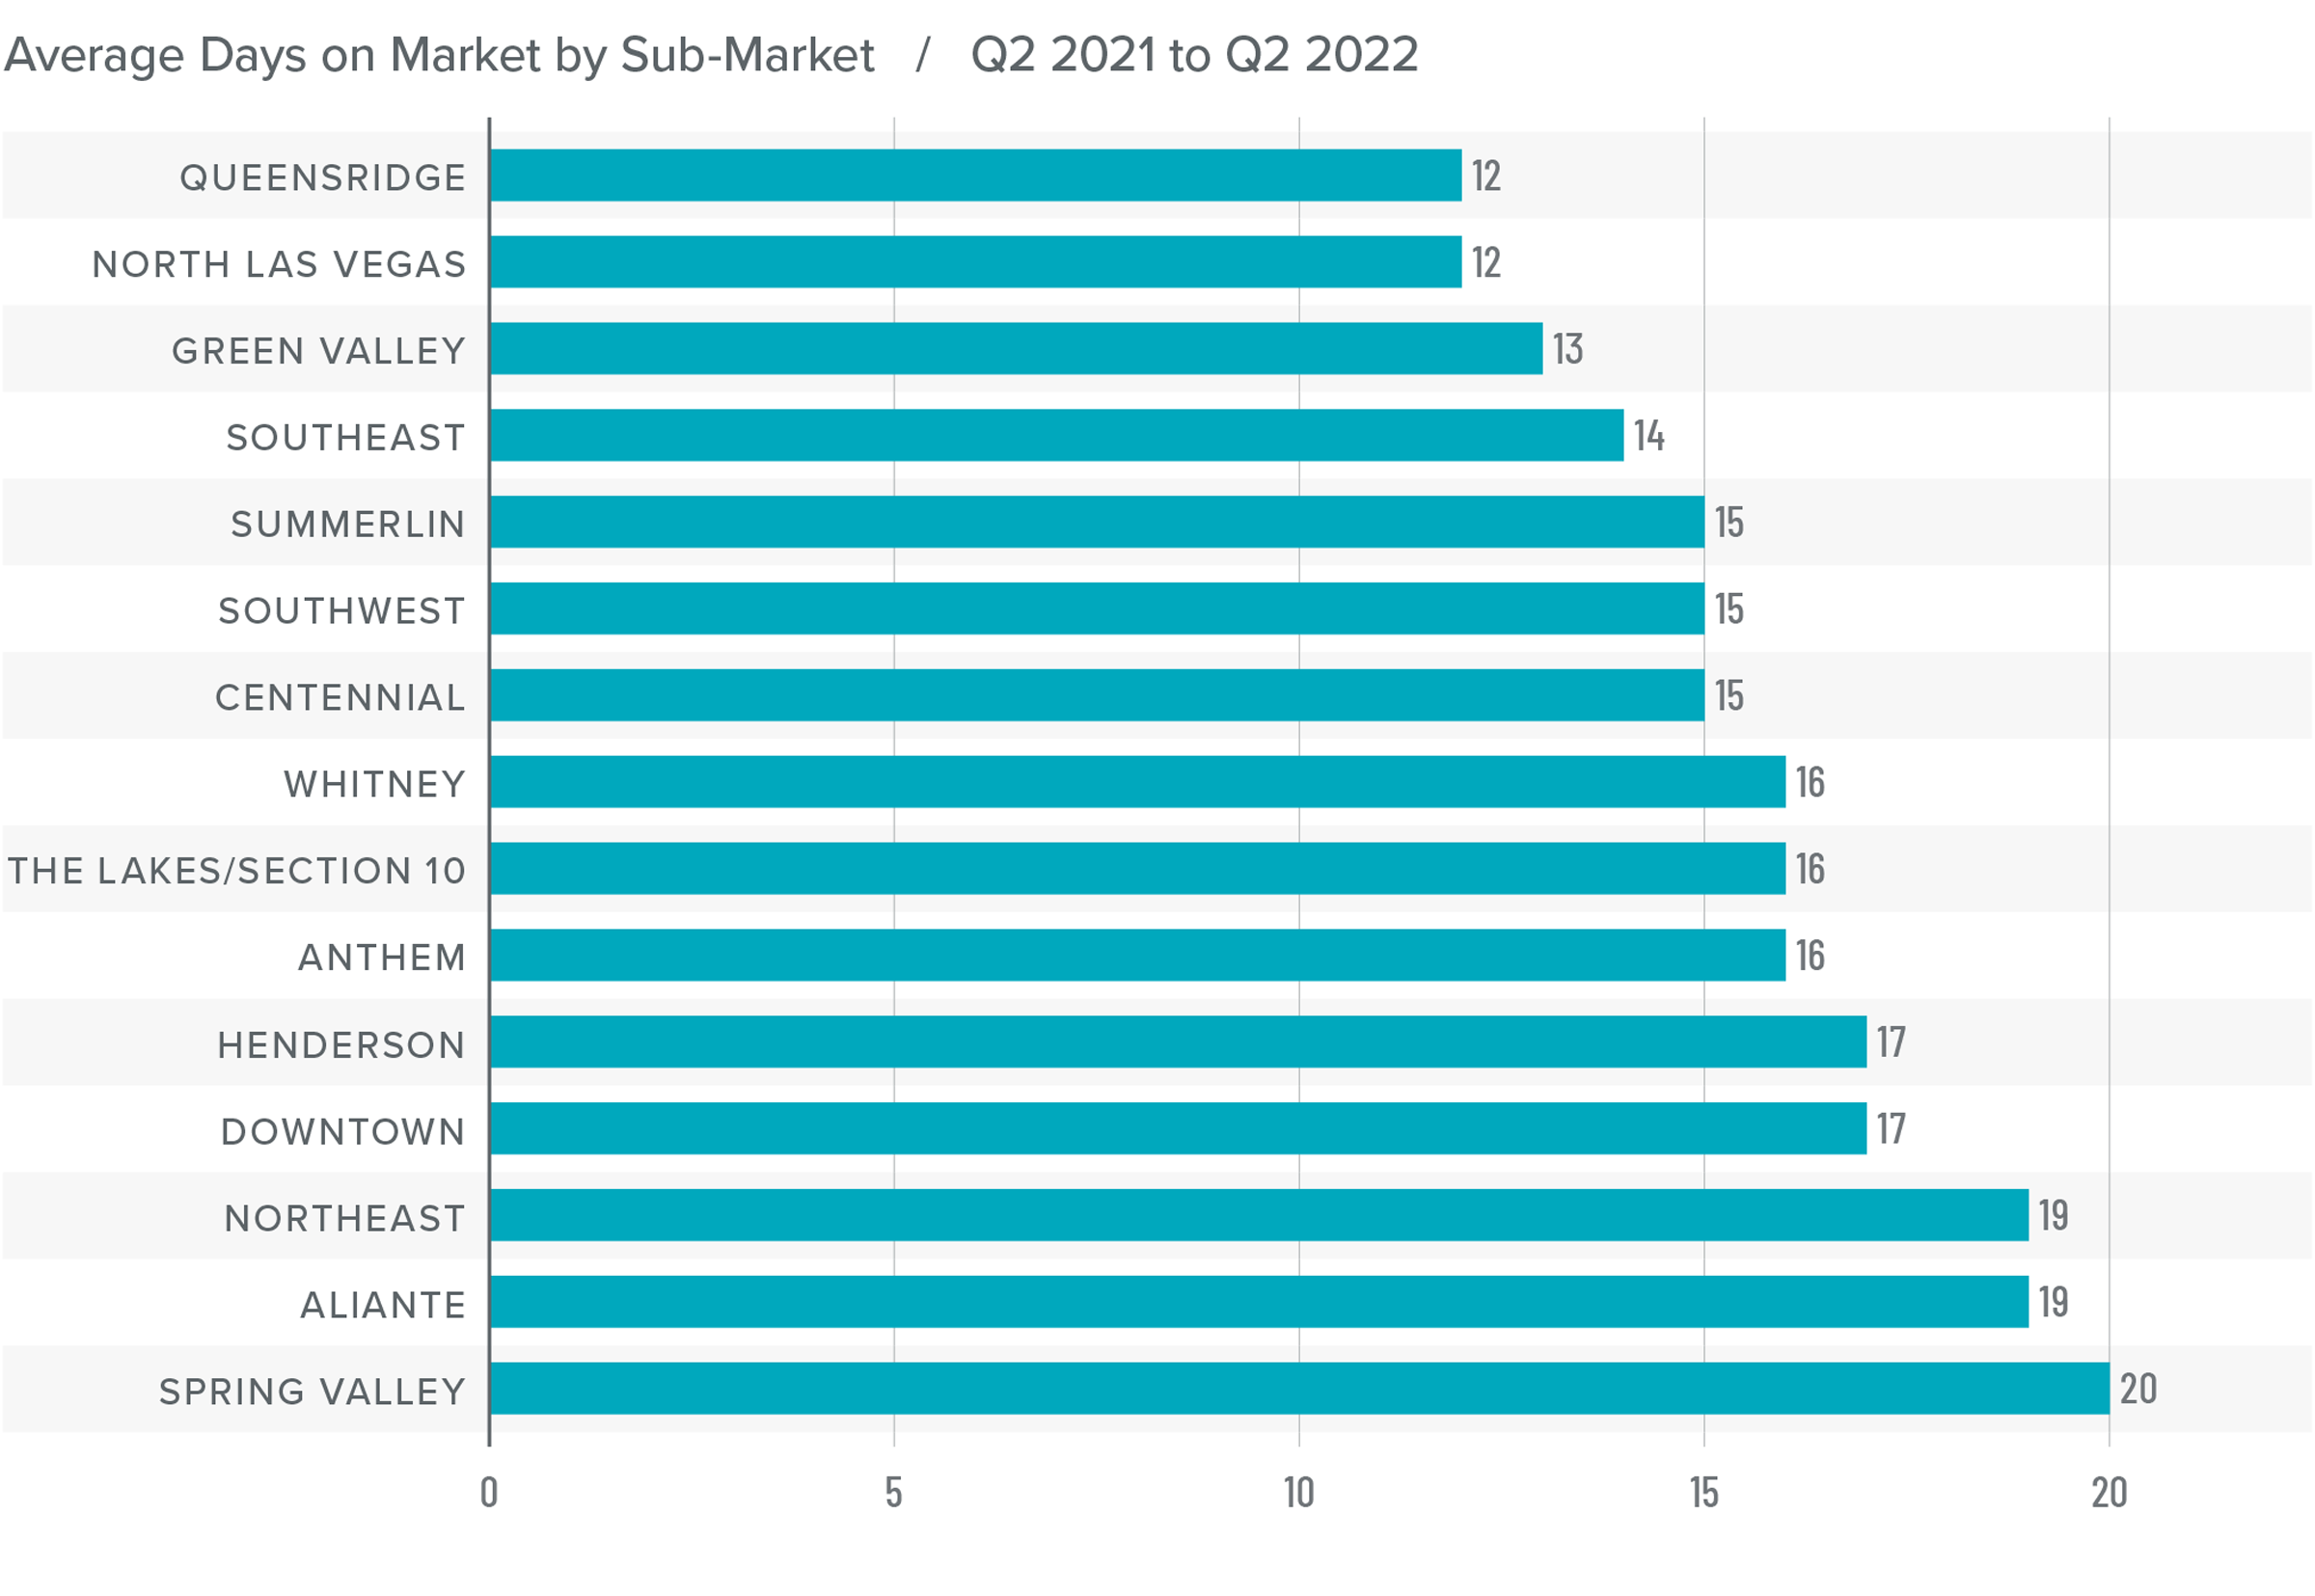
Nevada Days on Market
❱ The average time it took to sell a home in the region dropped seven days compared to the second quarter of 2021.
❱ It took an average of 16 days to sell a home in the quarter, which was down 7 days compared to the first quarter of this year.
❱ Days on market dropped in all neighborhoods except Anthem compared to the same period a year ago. Market time dropped in all neighborhoods other than Northeast Las Vegas (where it remained static) compared to the first quarter of the year.
❱ The greatest drop in market time was in the Spring Valley neighborhood, where the length of time it took to sell a home fell 15 days compared to a year ago.
Conclusions
This speedometer reflects the state of the region’s real estate market using housing inventory, price gains, home sales, interest rates, and larger economic factors.
Although listing activity and financing costs have risen, this has yet to negatively impact home sales or price growth. The growing number of homes for sale would normally cause asking prices to settle, which would favor home buyers, but so far this is not the case.

I expect the market to start moving somewhat toward balance, but for the time being sellers are still in the driver’s seat. Given all the data discussed here, I have left the needle in the same position as the last quarter. There are still too many unknowns preventing me from moving it one way or another. Hopefully, I will get more clarity once the summer winds down.
About Matthew Gardner

As Chief Economist for Windermere Real Estate, Matthew Gardner is responsible for analyzing and interpreting economic data and its impact on the real estate market on both a local and national level. Matthew has over 30 years of professional experience both in the U.S. and U.K.
In addition to his day-to-day responsibilities, Matthew sits on the Washington State Governors Council of Economic Advisors; chairs the Board of Trustees at the Washington Center for Real Estate Research at the University of Washington; and is an Advisory Board Member at the Runstad Center for Real Estate Studies at the University of Washington where he also lectures in real estate economics.
")


