
 Facebook
 X
X
 Pinterest
 Copy Link

The following analysis of select counties of the Colorado real estate market is provided by Windermere Real Estate Chief Economist Matthew Gardner. We hope that this information may assist you with making better-informed real estate decisions. For further information about the housing market in your area, please don’t hesitate to contact your Windermere Real Estate agent.
Regional Economic Overview
The slowdown in job gains in Colorado continued this spring. Although the state added 30,200 new jobs over the past year, this represents close to the lowest growth rate since 2011. Additionally, growth is now being driven by gains in government employment and not from increases in the private sector. Part of the reason that job growth has slowed so significantly is that the labor market remains extremely tight. Since the pandemic, the labor pool has only risen a bit under 37,000 over the past year, which is well below average. With a tight labor market, I’m not surprised that the unemployment rate in May was only 2.8%. Regionally, jobless rates ranged from a low of 2.5% in Fort Collins and Boulder to a high of 3.1% in the Grand Junction metropolitan area.
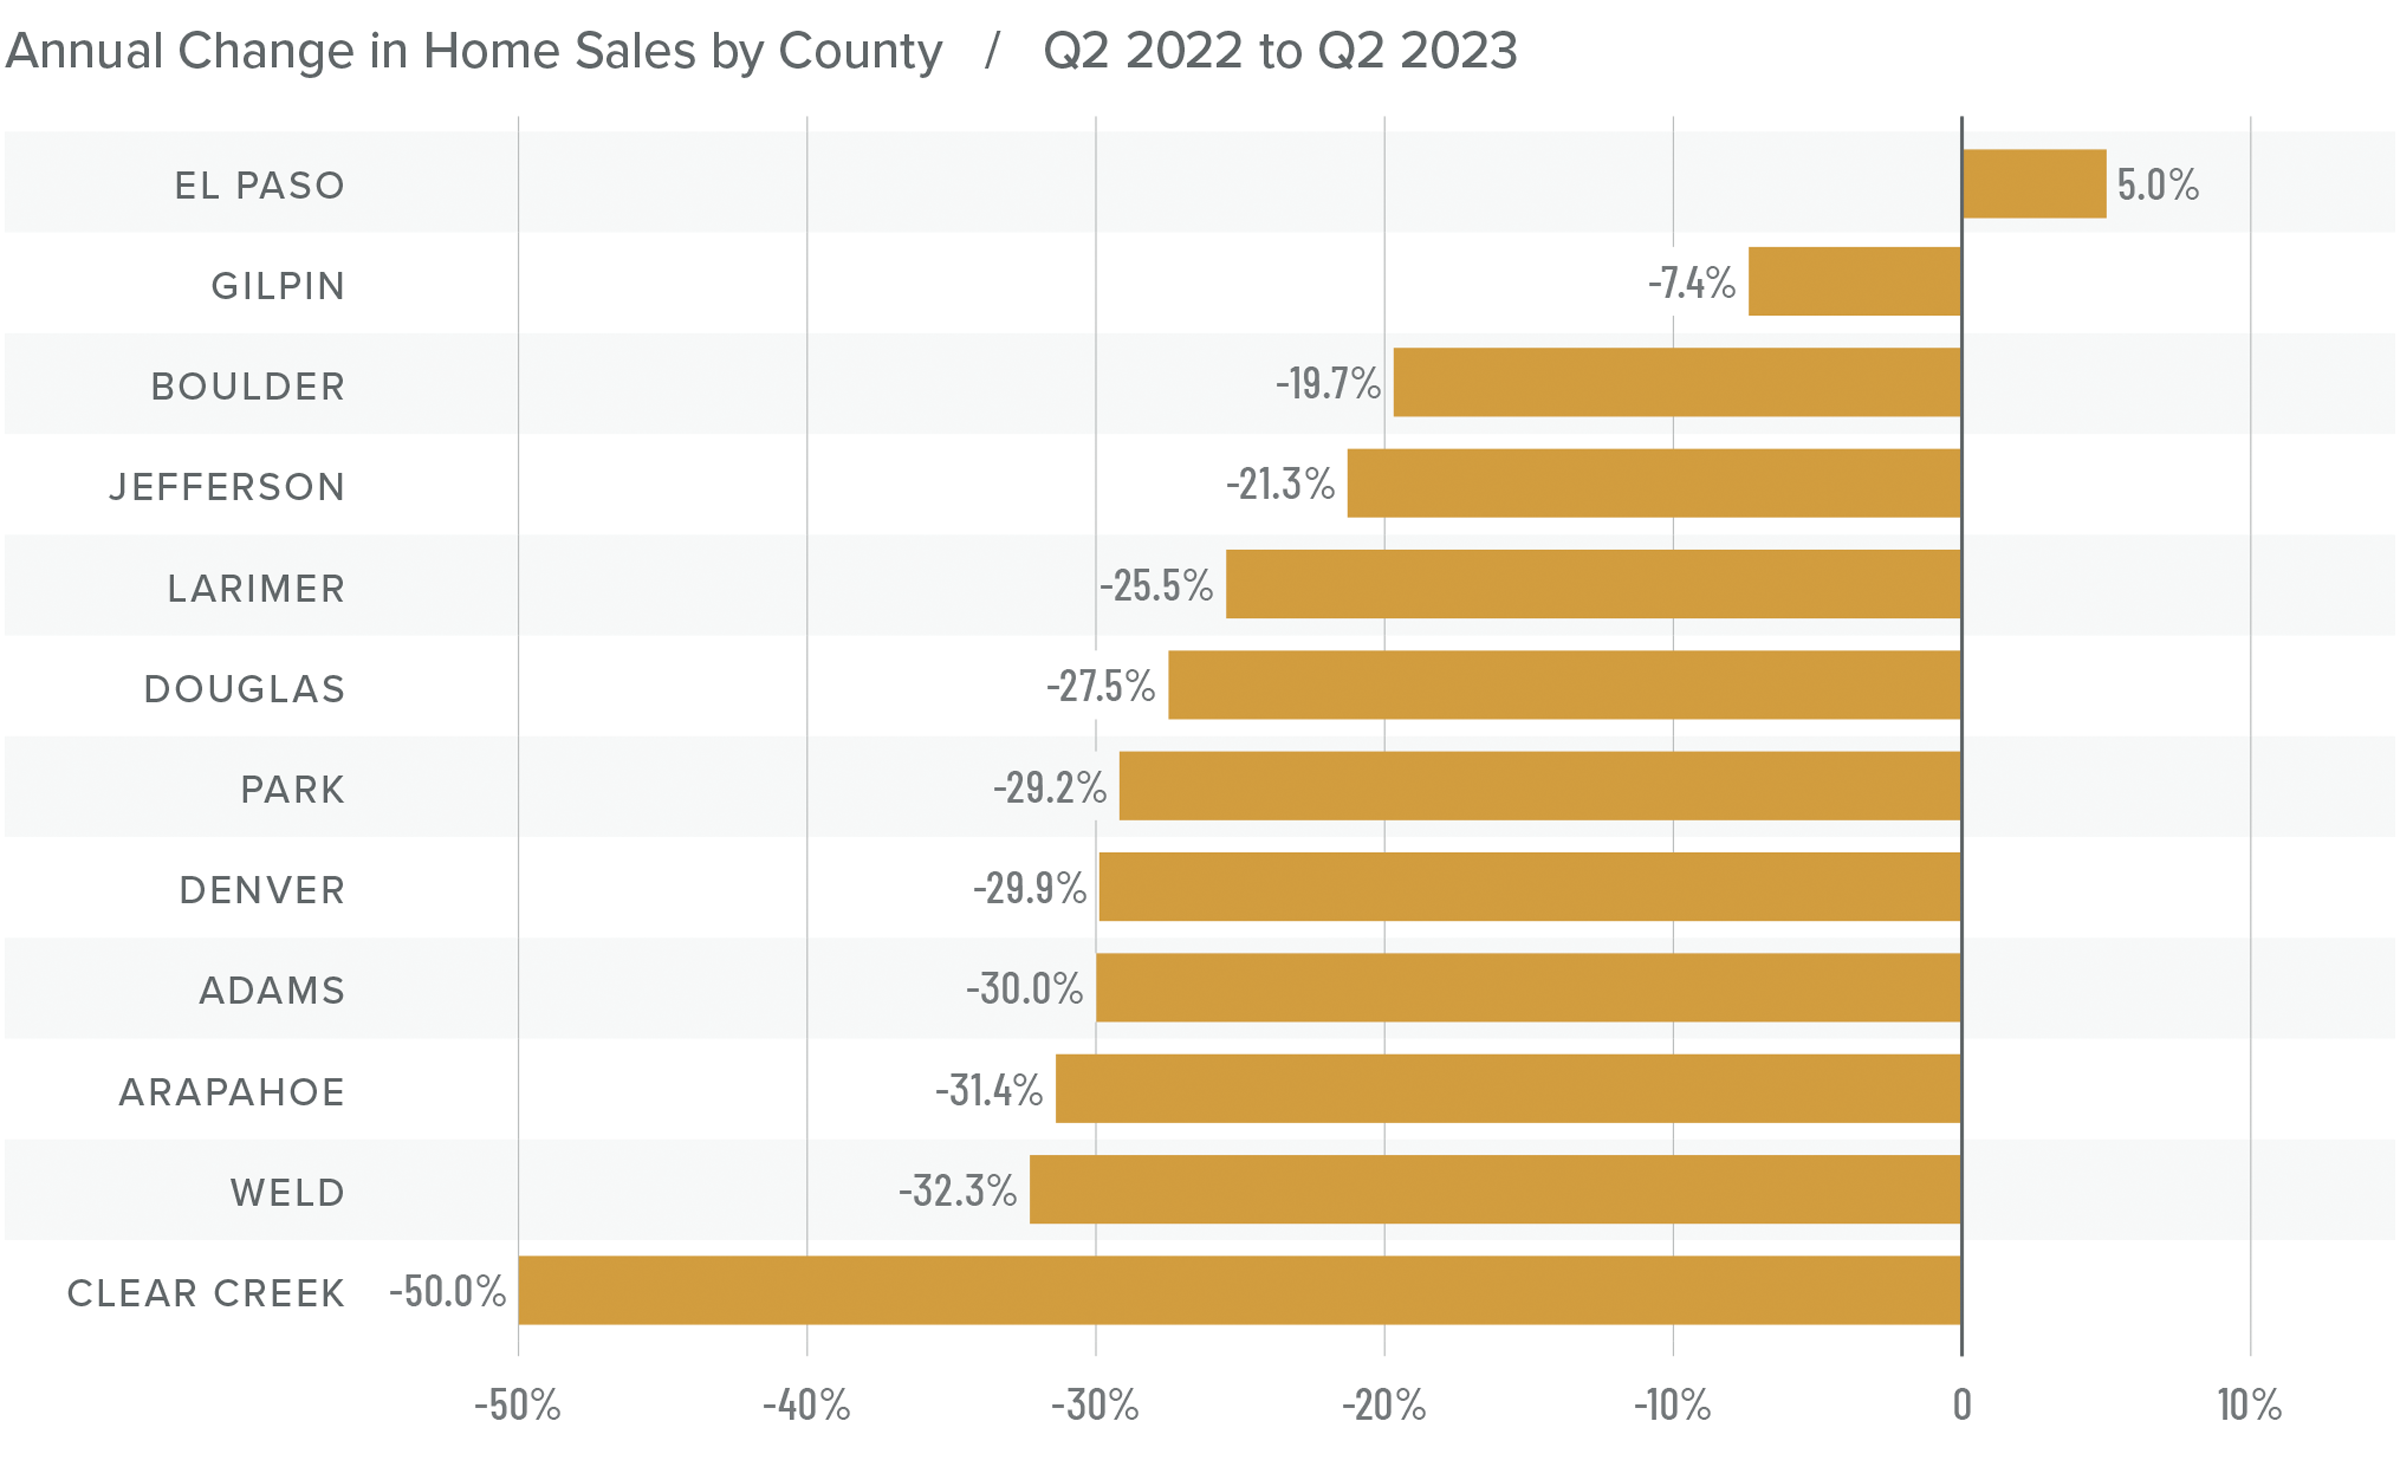
Colorado Home Sales
❱ In the second quarter of this year, 9,615 homes sold, which was a drop of 26% from the same period in 2022, but an increase of 45.6% from the first quarter of 2023.
❱ Year over year, sales fell in all the markets covered by this report except El Paso County. Compared to the first quarter of this year, sales rose across the board.
❱ The year-over-year drop in sales is not a surprise given that a year ago mortgage rates were starting to rise, so buyers were keen to lock in low rates while they could. I was pleased to see the significant jump in sales over the first quarter even with remarkably high financing costs.
❱ Pending sales, which are an indicator of future closings, jumped 25.8% from the first quarter. This suggests that sales will likely rise as we move through the summer.
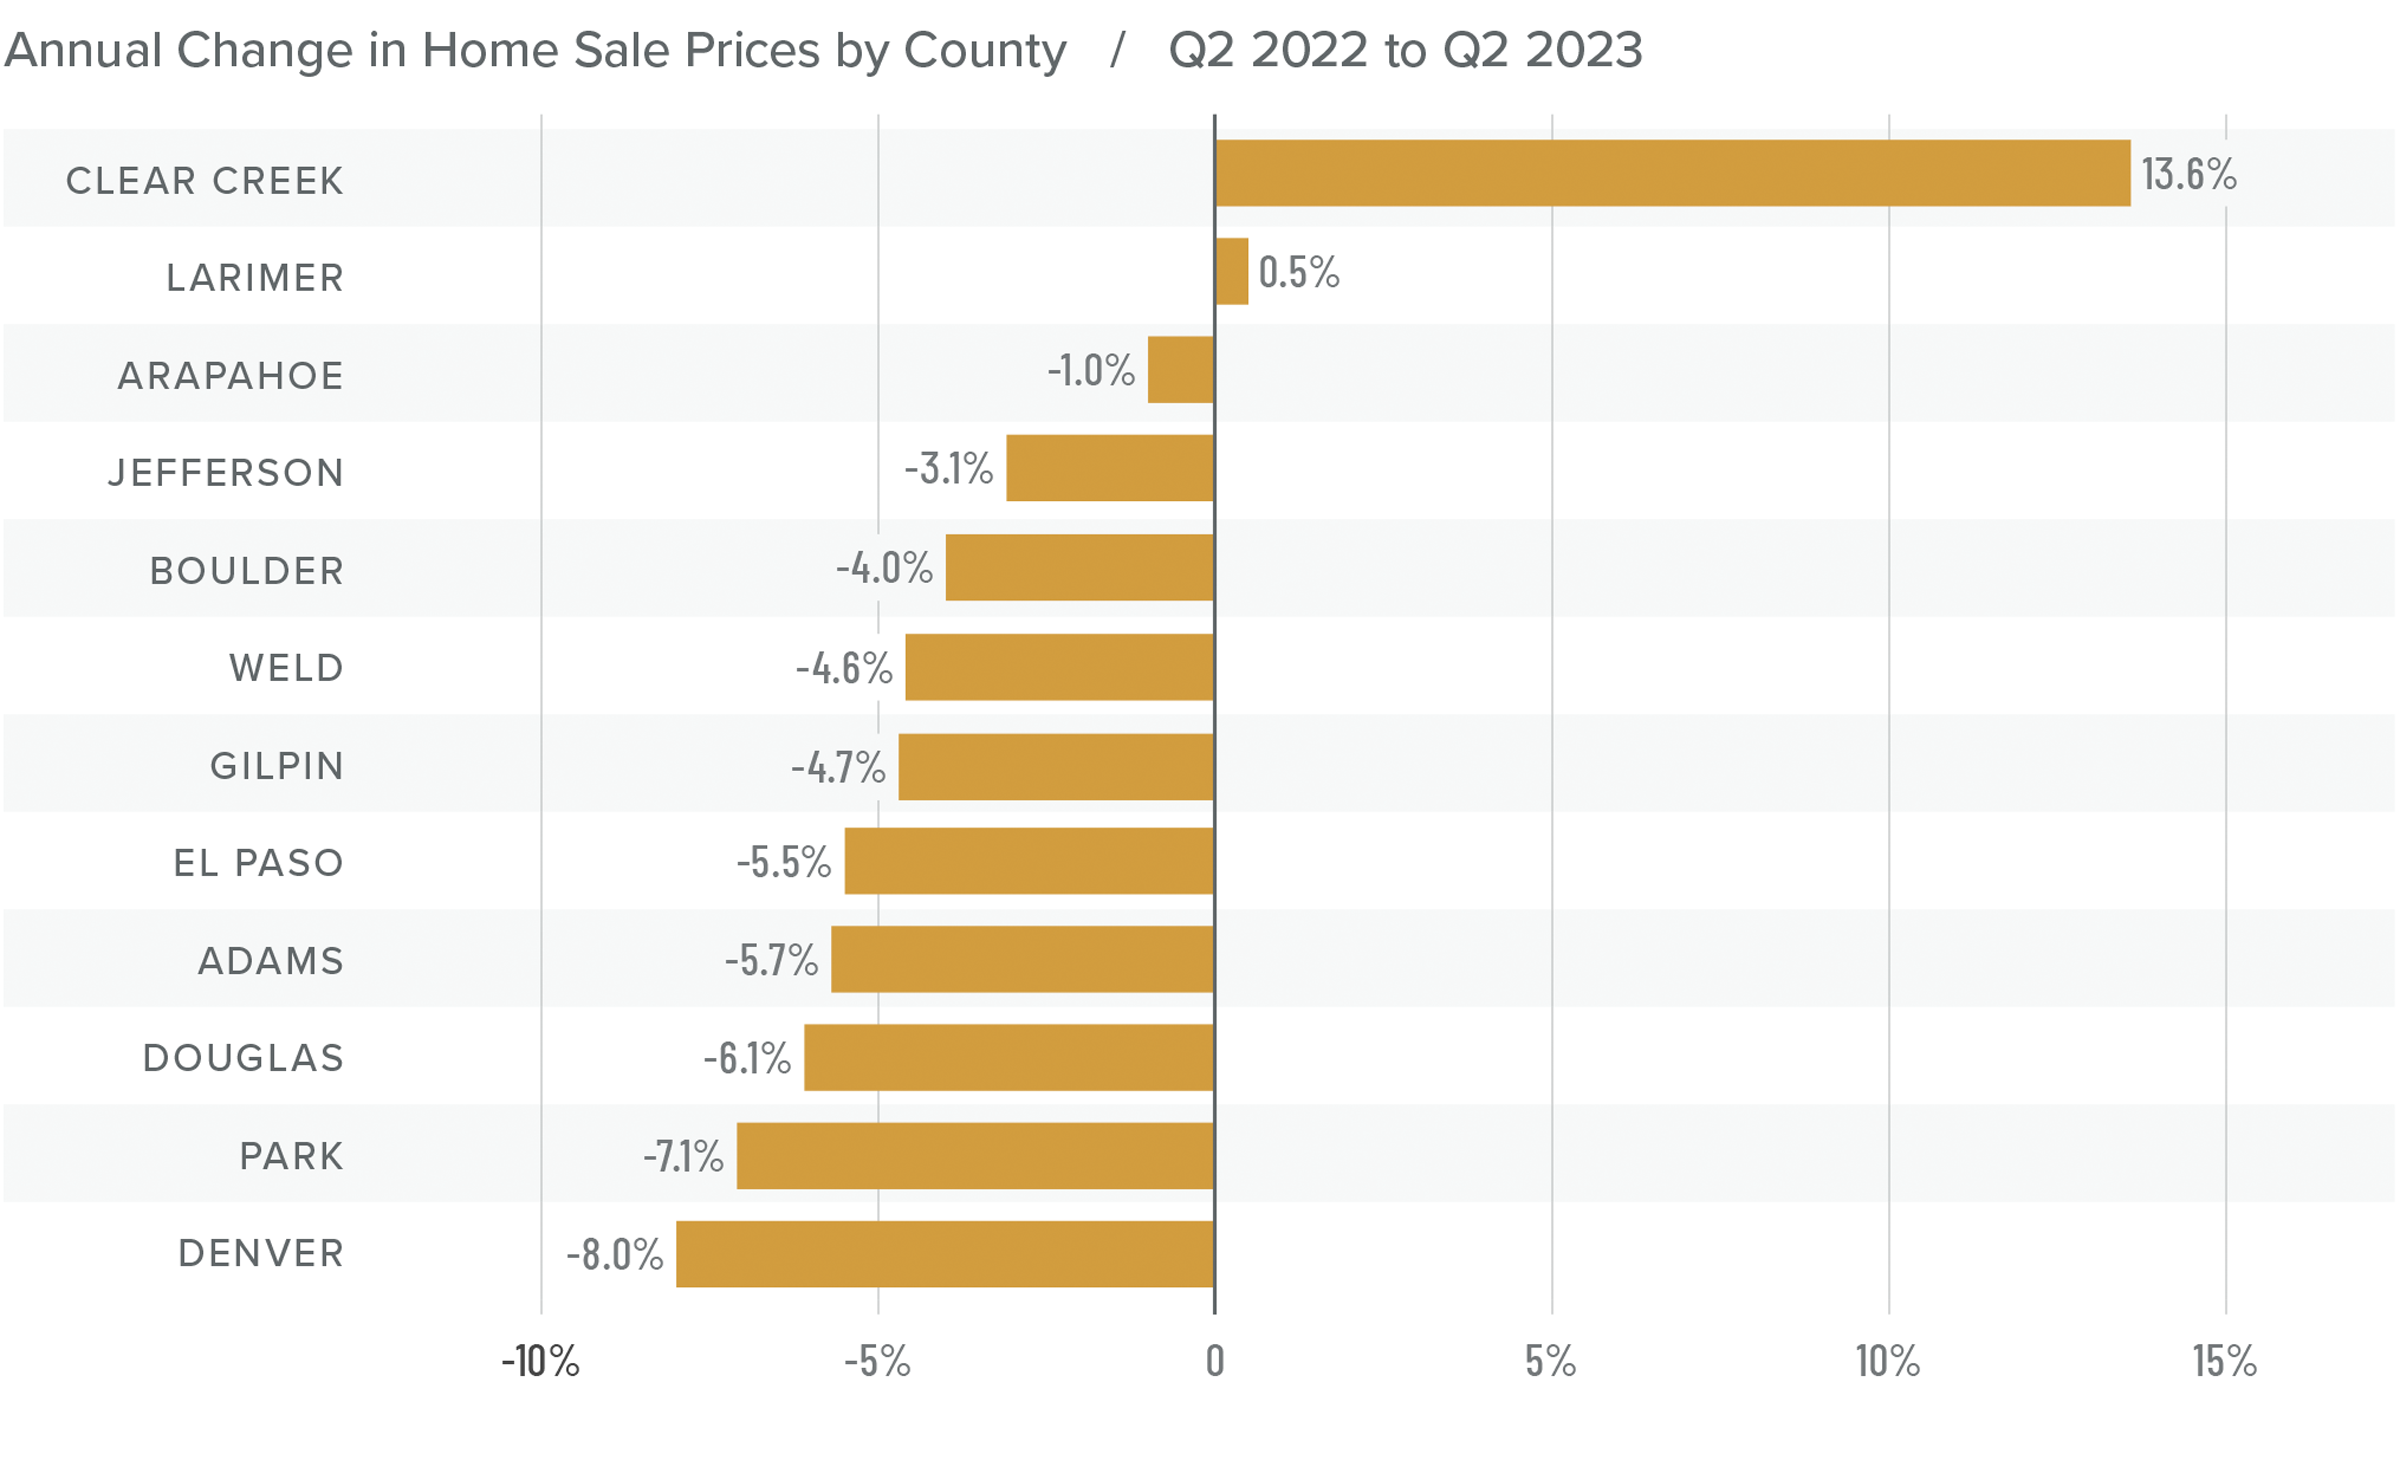
Colorado Home Prices
❱ Average sale prices fell 4% compared to the same period in 2022 to $672,864. Closed sale prices were 7.6% higher than in the first quarter of this year.
❱ Compared to the first quarter, prices rose in all counties other than Boulder and Gilpin. This may be because these are the two most expensive markets covered by this report.
❱ Year over year, prices rose in two counties but fell in the balance of the markets. Clear Creek County saw significant growth, but it is prone to significant swings because very few sales happen there.
❱ The median list price of a home for sale in the second quarter rose 1.9% from the first quarter of this year. In fact, every county except Clear Creek and Park saw list prices rise. Sellers appear to be confident about the market, regardless of mortgage rates.
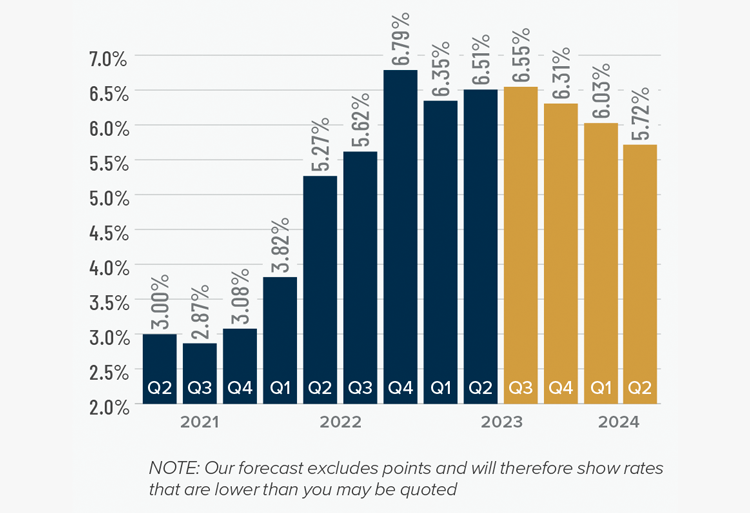
Mortgage Rates
Although they were less erratic than the first quarter, mortgage rates unfortunately trended higher and ended the quarter above 7%. This was due to the short debt ceiling impasse, as well as several economic datasets that suggested the U.S. economy was not slowing at the speed required by the Federal Reserve.
While the June employment report showed fewer jobs created than earlier in the year, as well as downward revisions to prior gains, inflation has not sufficiently slowed. Until it does, rates cannot start to trend consistently lower. With the economy not slowing as fast as expected, I have adjusted my forecast: Rates will hold at current levels in third quarter and then start to trend lower through the fall. Although there are sure to be occasional spikes, my model now shows the 30-year fixed rate breaking below 6% next spring.
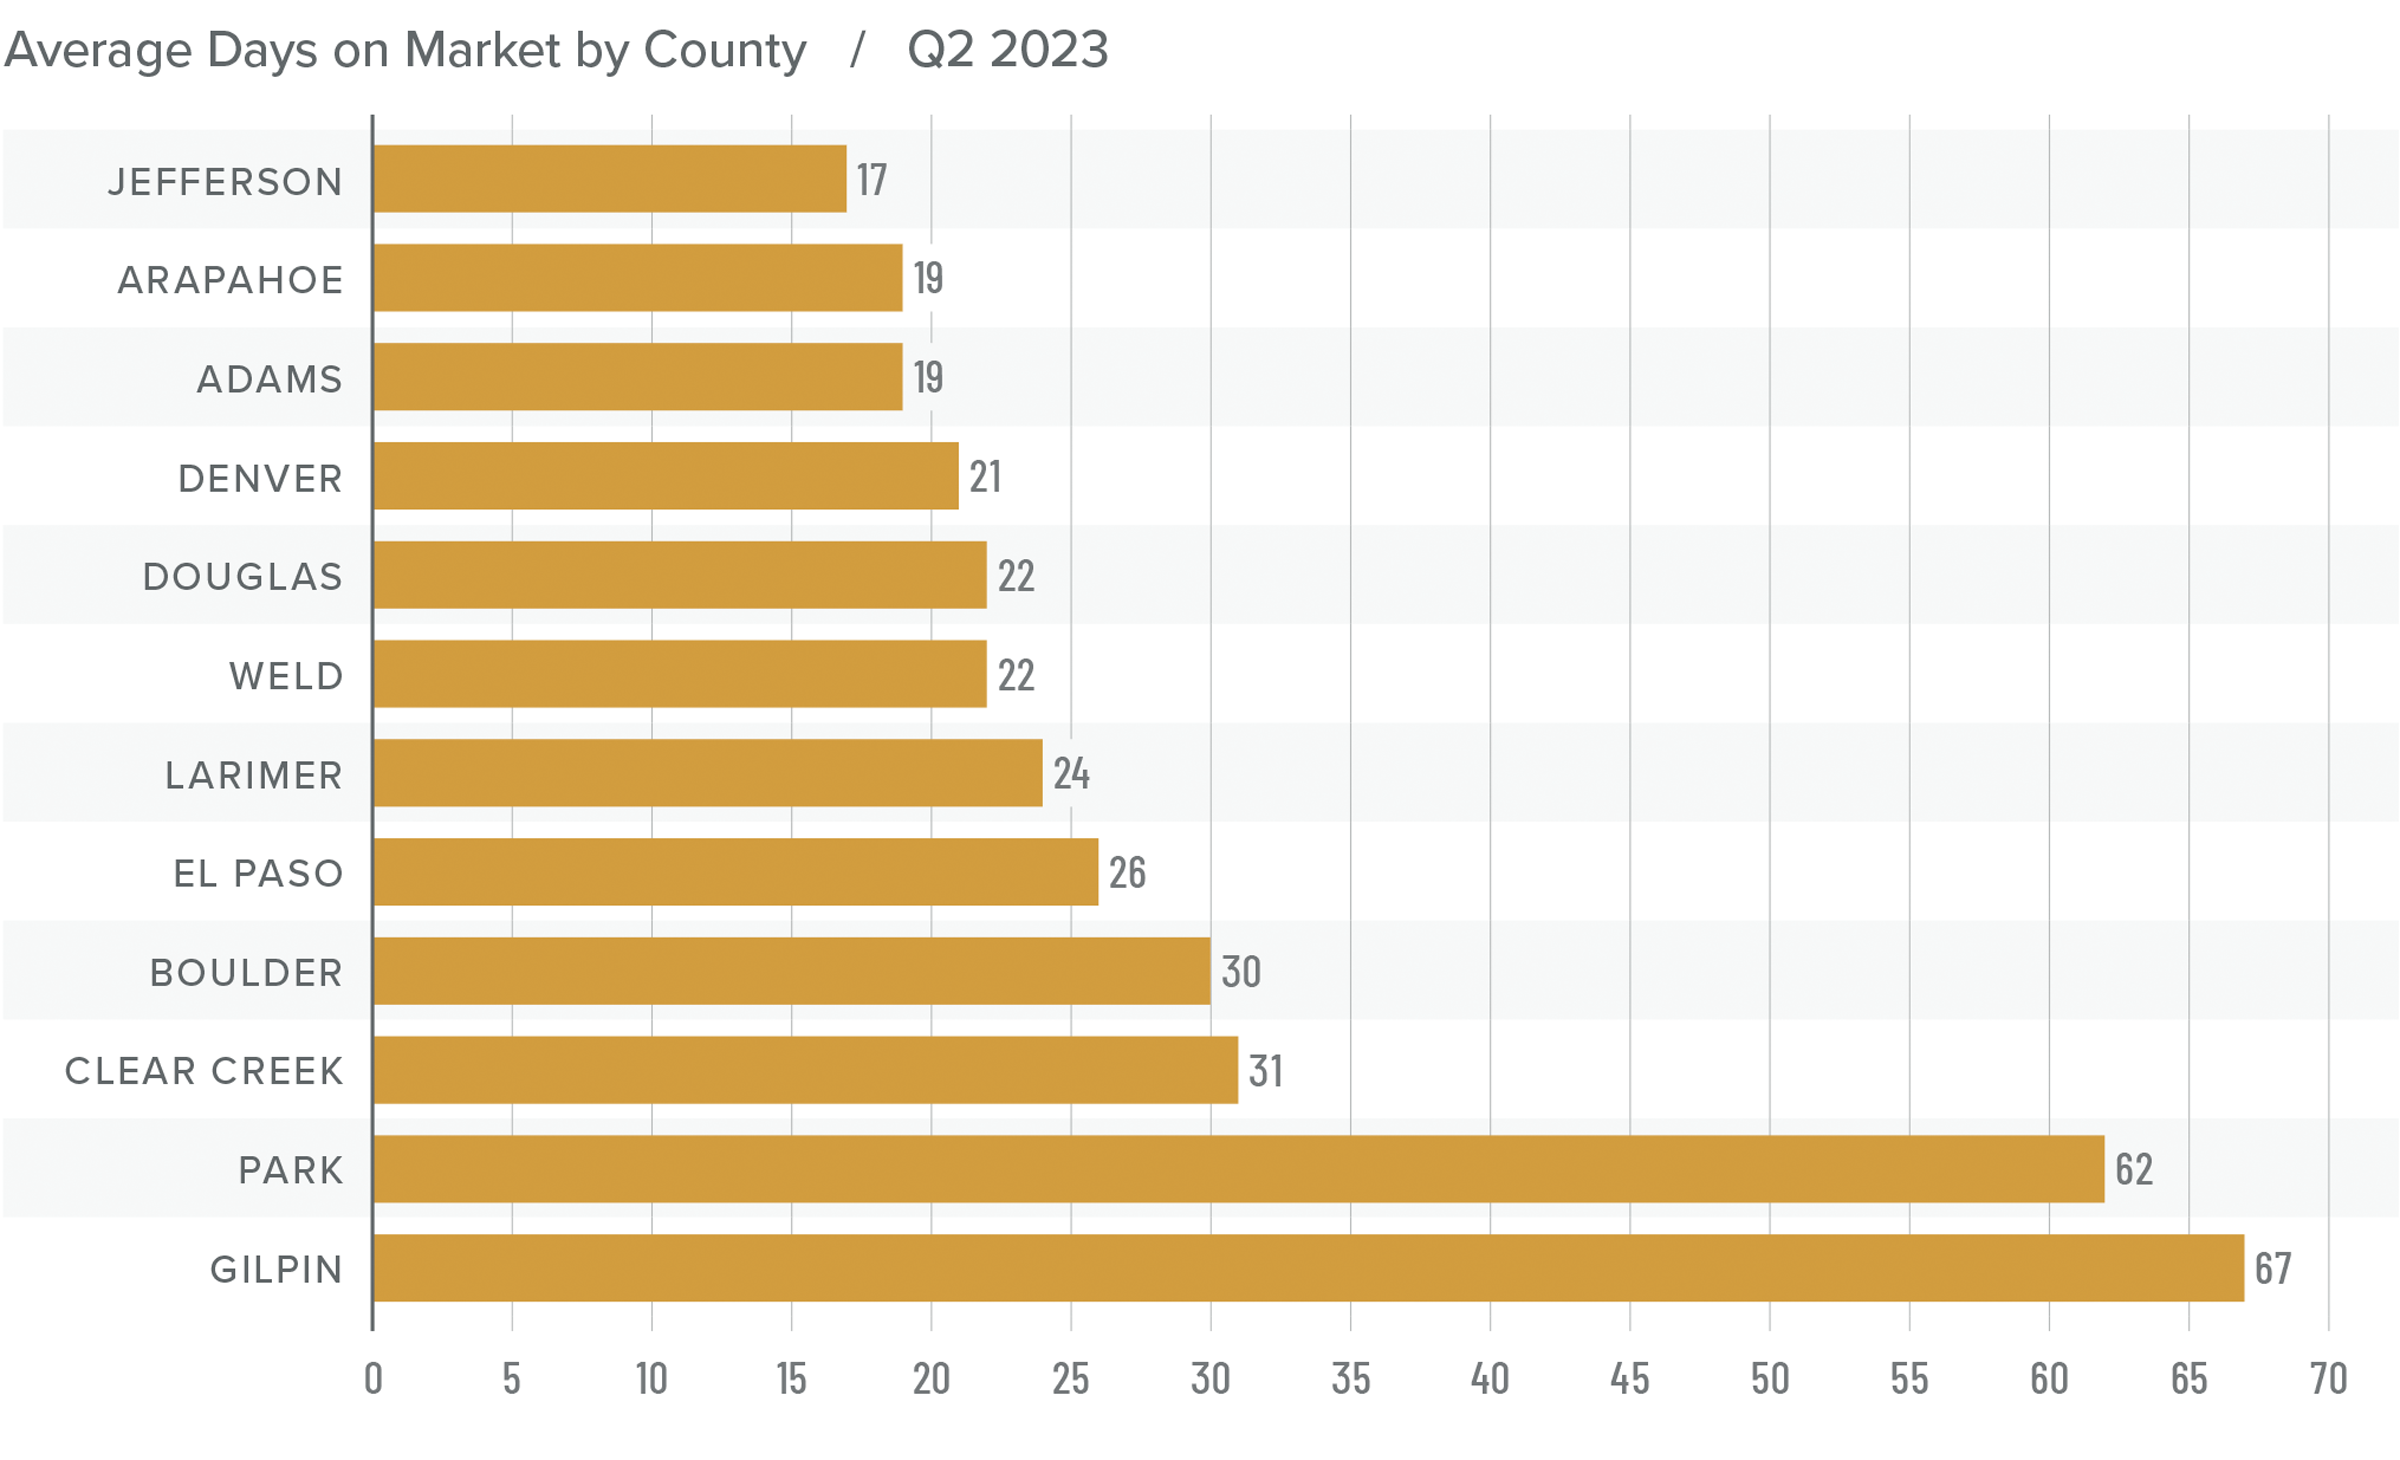
Colorado Days on Market
❱ The average time it took to sell a home in the markets contained in this report rose 20 days compared to the same period in 2022.
❱ The length of time it took to sell a home compared to the first quarter of this year fell across all markets except Gilpin County, where market time rose 31 days.
❱ It took an average of 30 days to sell a home in the counties covered by this report, which was down 17 days compared to the first quarter of 2023.
❱ Regardless of being faced with more choice in the market than they’ve had in a long time, buyers picked up the pace in the quarter. It will be interesting to see if this continues despite stubbornly high financing costs.
Conclusions
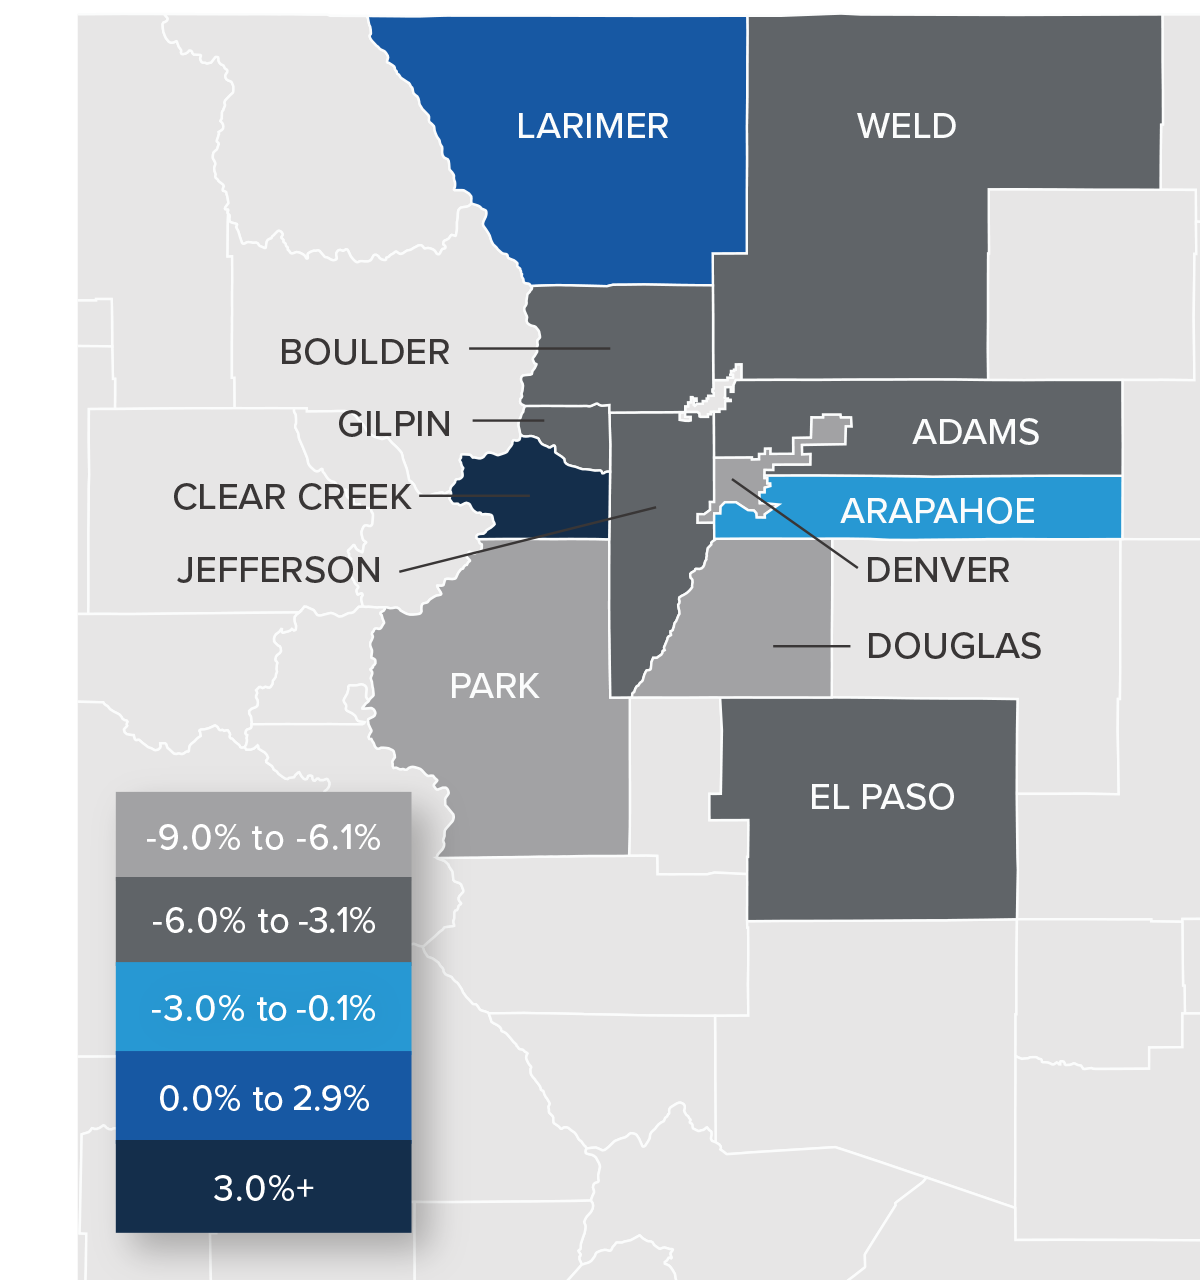
This speedometer reflects the state of the region’s real estate market using housing inventory, price gains, home sales, interest rates, and larger economic factors.
Although job growth has slowed significantly, and financing costs remain high, the market appears to have gained traction. Clearly, buyers do not expect prices to fall further. Even if borrowing costs remain high, it appears that buyers believe rates will come down at some point, which will allow them to refinance into a lower rate mortgage.
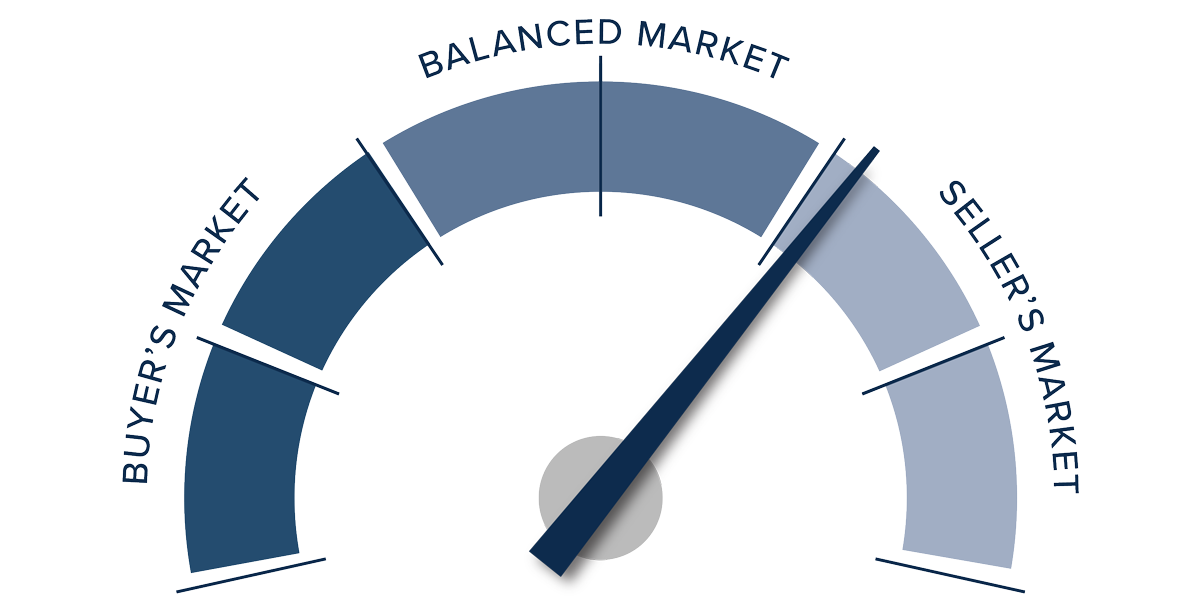
In last quarter’s Gardner Report, I stated that home prices had likely turned the corner and were going to start rising again, which has proved to be accurate. Listing activity has risen, but so have sales. List and sale prices are trending higher even as market time drops. All in all, the data points to a seller’s market. As such, I have moved the needle accordingly.
About Matthew Gardner

As Chief Economist for Windermere Real Estate, Matthew Gardner is responsible for analyzing and interpreting economic data and its impact on the real estate market on both a local and national level. Matthew has over 30 years of professional experience both in the U.S. and U.K.
In addition to his day-to-day responsibilities, Matthew sits on the Washington State Governors Council of Economic Advisors; chairs the Board of Trustees at the Washington Center for Real Estate Research at the University of Washington; and is an Advisory Board Member at the Runstad Center for Real Estate Studies at the University of Washington where he also lectures in real estate economics.
")


