
 Facebook
 X
X
 Pinterest
 Copy Link

The following analysis of select counties of the Montana real estate market is provided by Windermere Real Estate Chief Economist Matthew Gardner. We hope that this information may assist you with making better-informed real estate decisions. For further information about the housing market in your area, please don’t hesitate to contact your Windermere Real Estate agent.
Regional Economic Overview
Though the pace of job growth continues to taper, Montana still added 15,800 new jobs over the past year, which is impressive when compared to historic averages. All of Montana’s metro areas have recovered the jobs lost due to the pandemic. The unemployment rate in Montana in June was 2.6%, an increase from the all-time low of 2.3% in April. In the metro areas contained in this report, the lowest jobless rate was in Billings at 2.5%, followed by Missoula at 2.7% and Great Falls at 2.8%. I continue to be worried about the lack of workers in the state. The labor force participation rate (which is the civilian population divided by the labor force) stands at only 62.6%, close to a historic low and making it difficult for employers to find workers.
Montana Home Sales
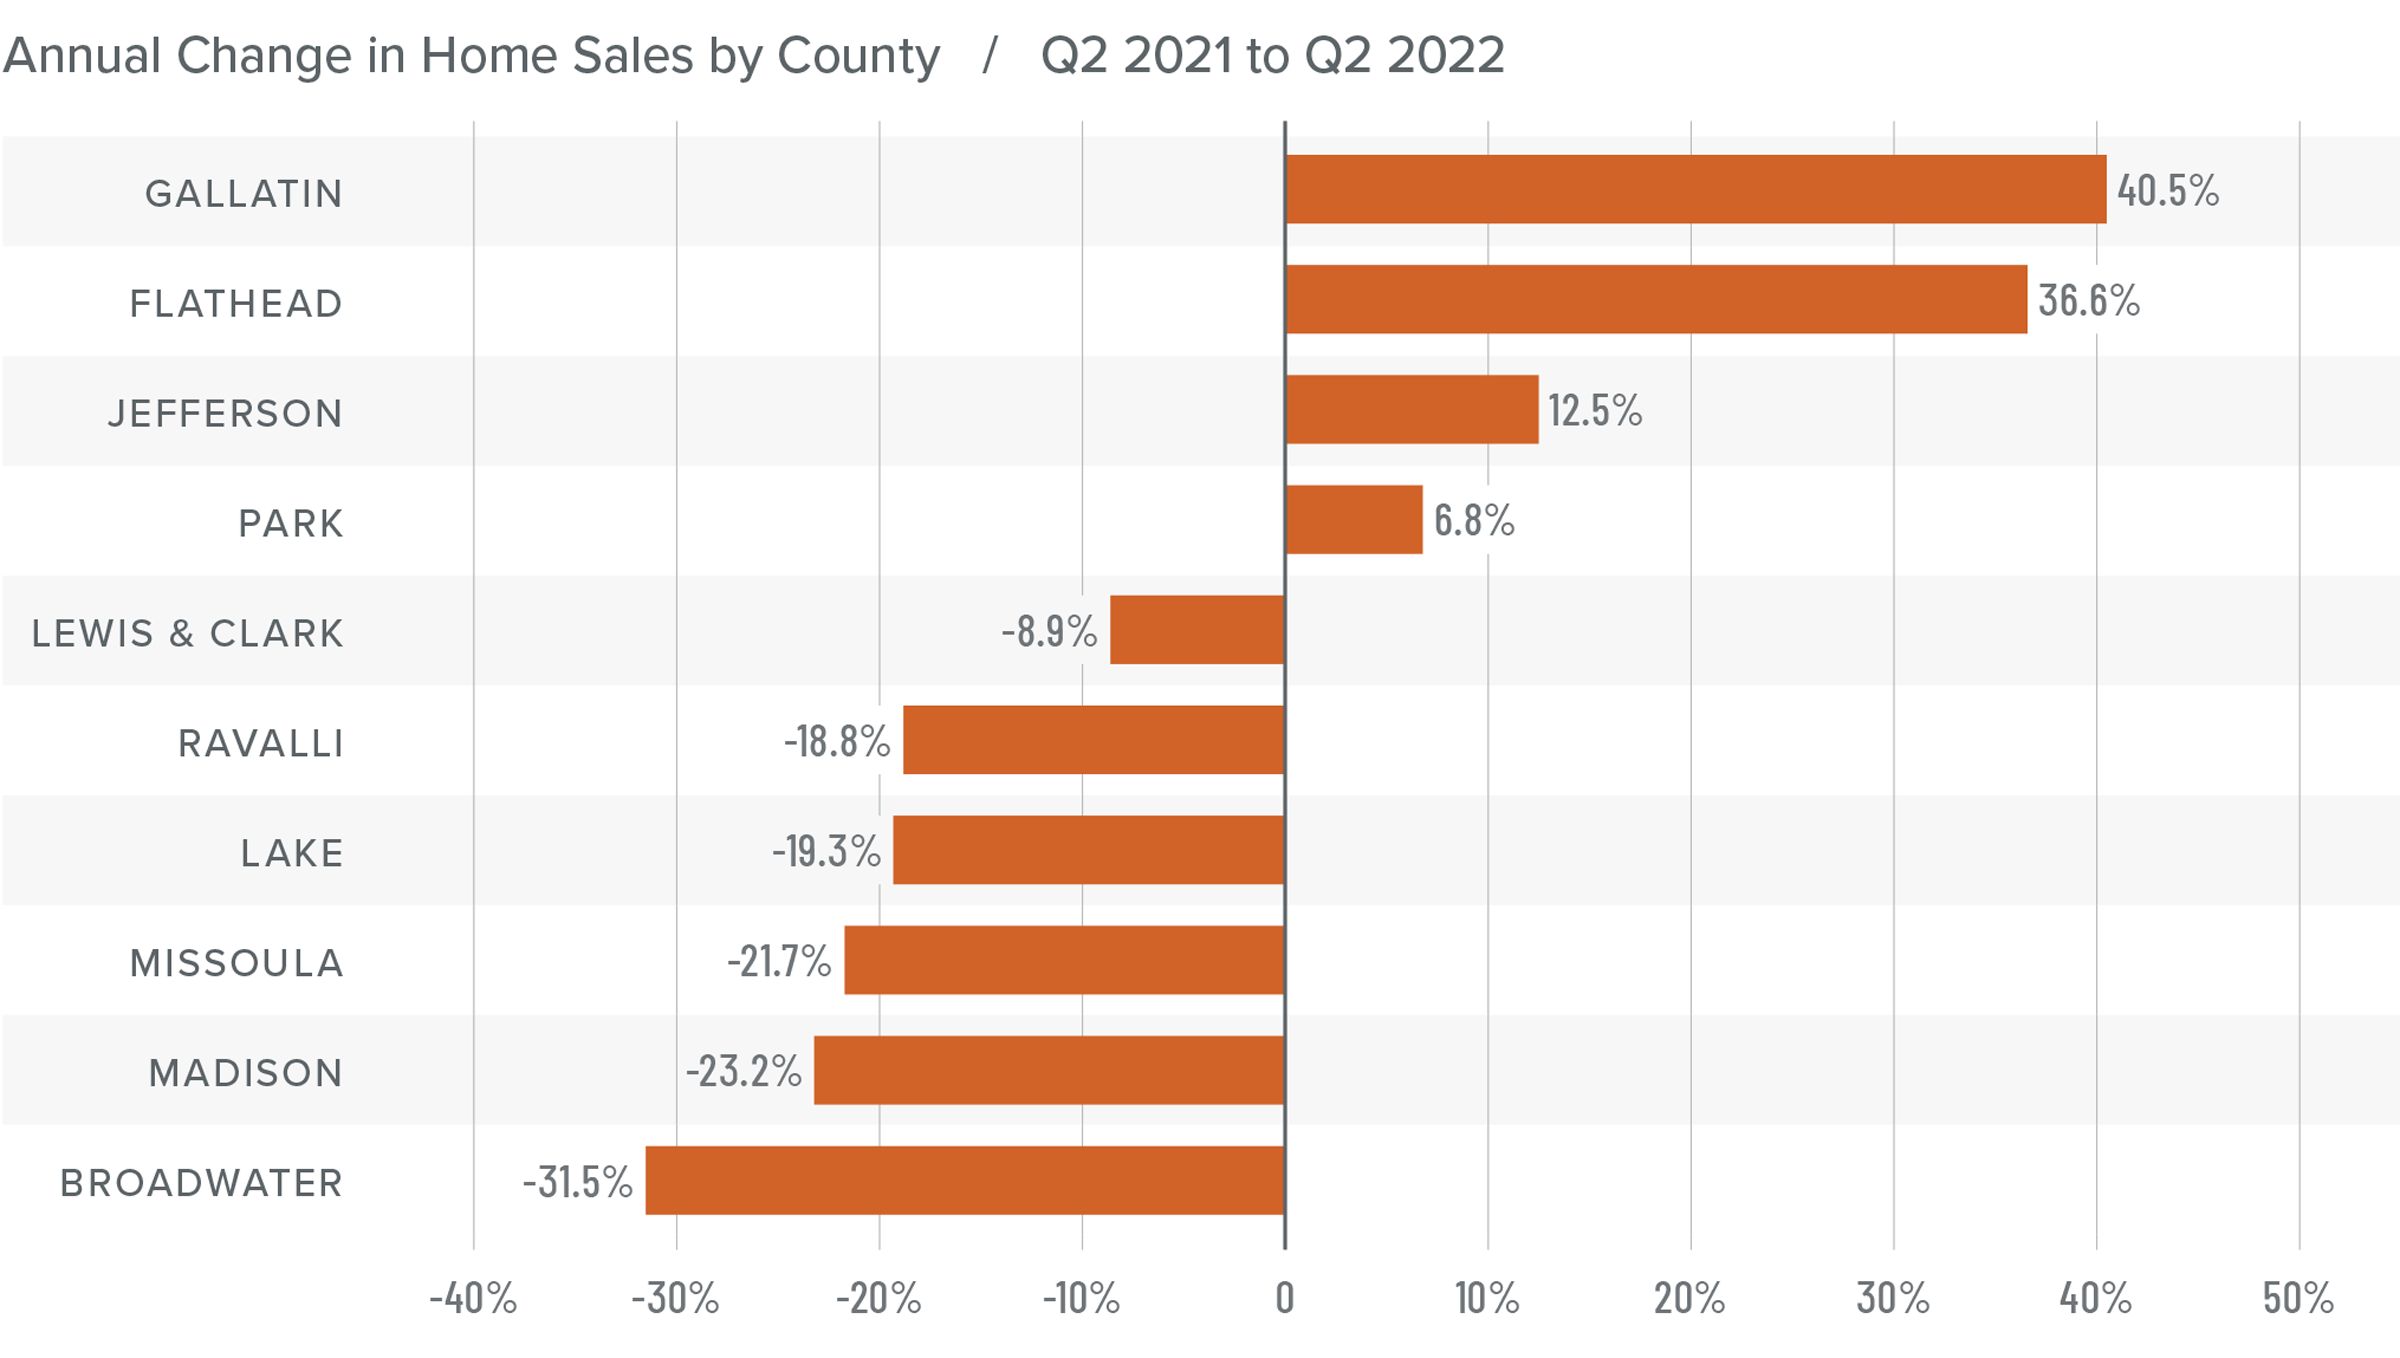
❱ In the second quarter, 2,359 homes sold in the markets contained in this report. This was a 2.9% increase from a year ago and more than double the number of closings in the first quarter of the year.
❱ Higher home sales can be attributed to the 124% increase in the number of homes that came to market in the quarter.
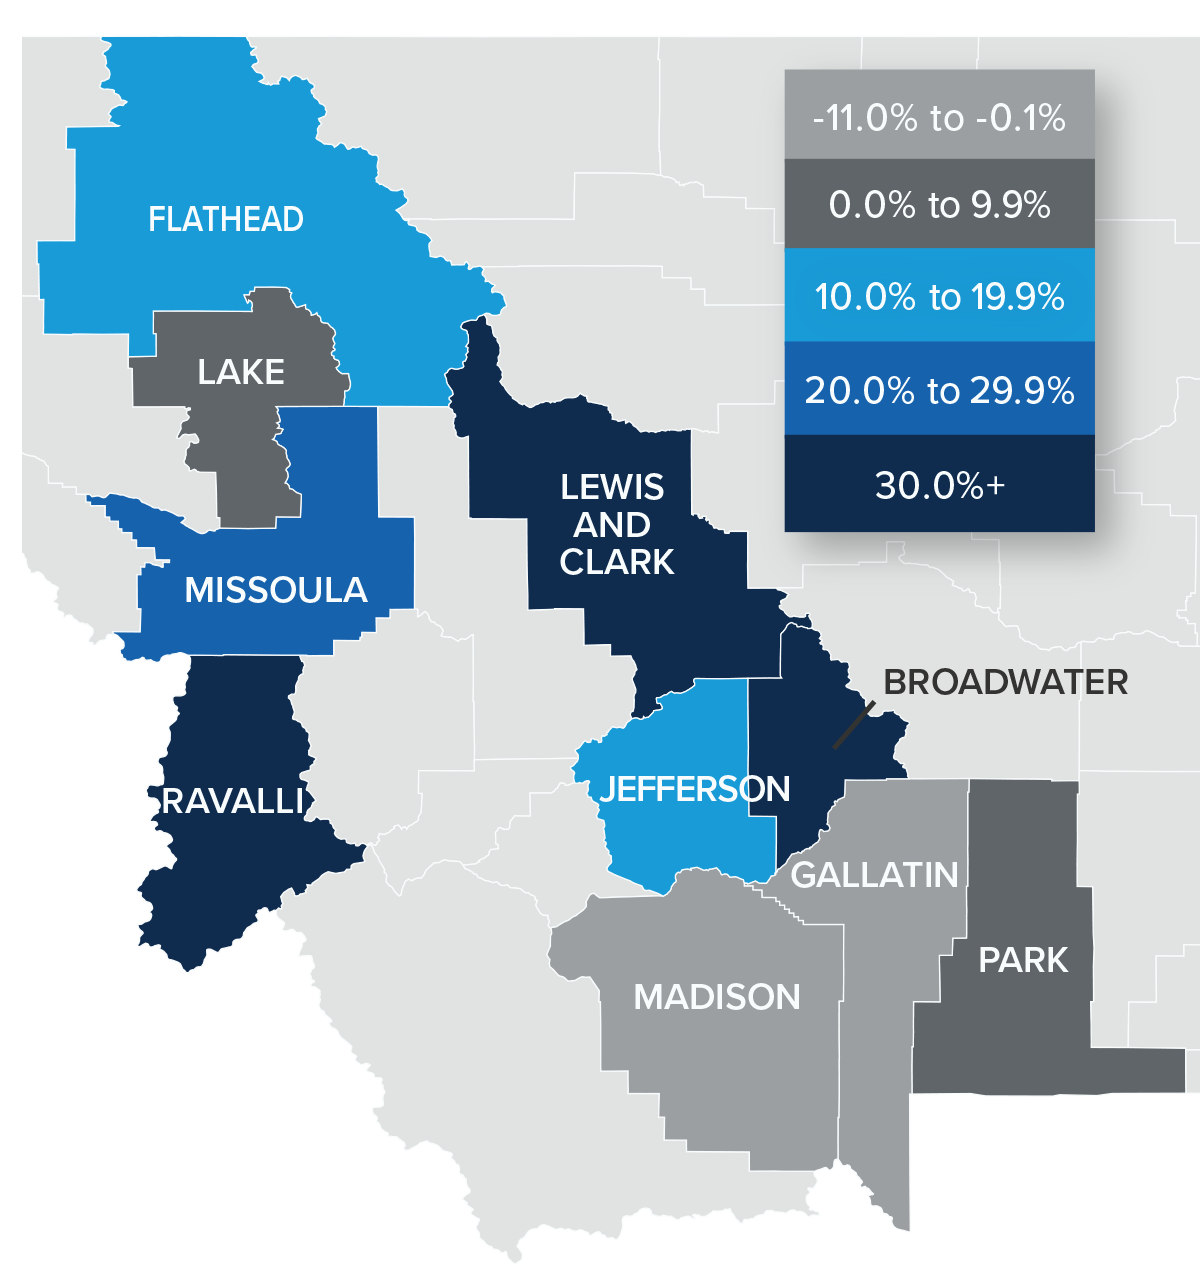
❱ Year over year, sales rose in four of the counties included in this report but fell in the rest of the markets. Compared to the first quarter, however, sales were up in every county other than Madison.
❱ With significantly more homes to choose from, pending sales rose 11.7% from first quarter, suggesting that third quarter numbers may also be strong.
Montana Home Prices
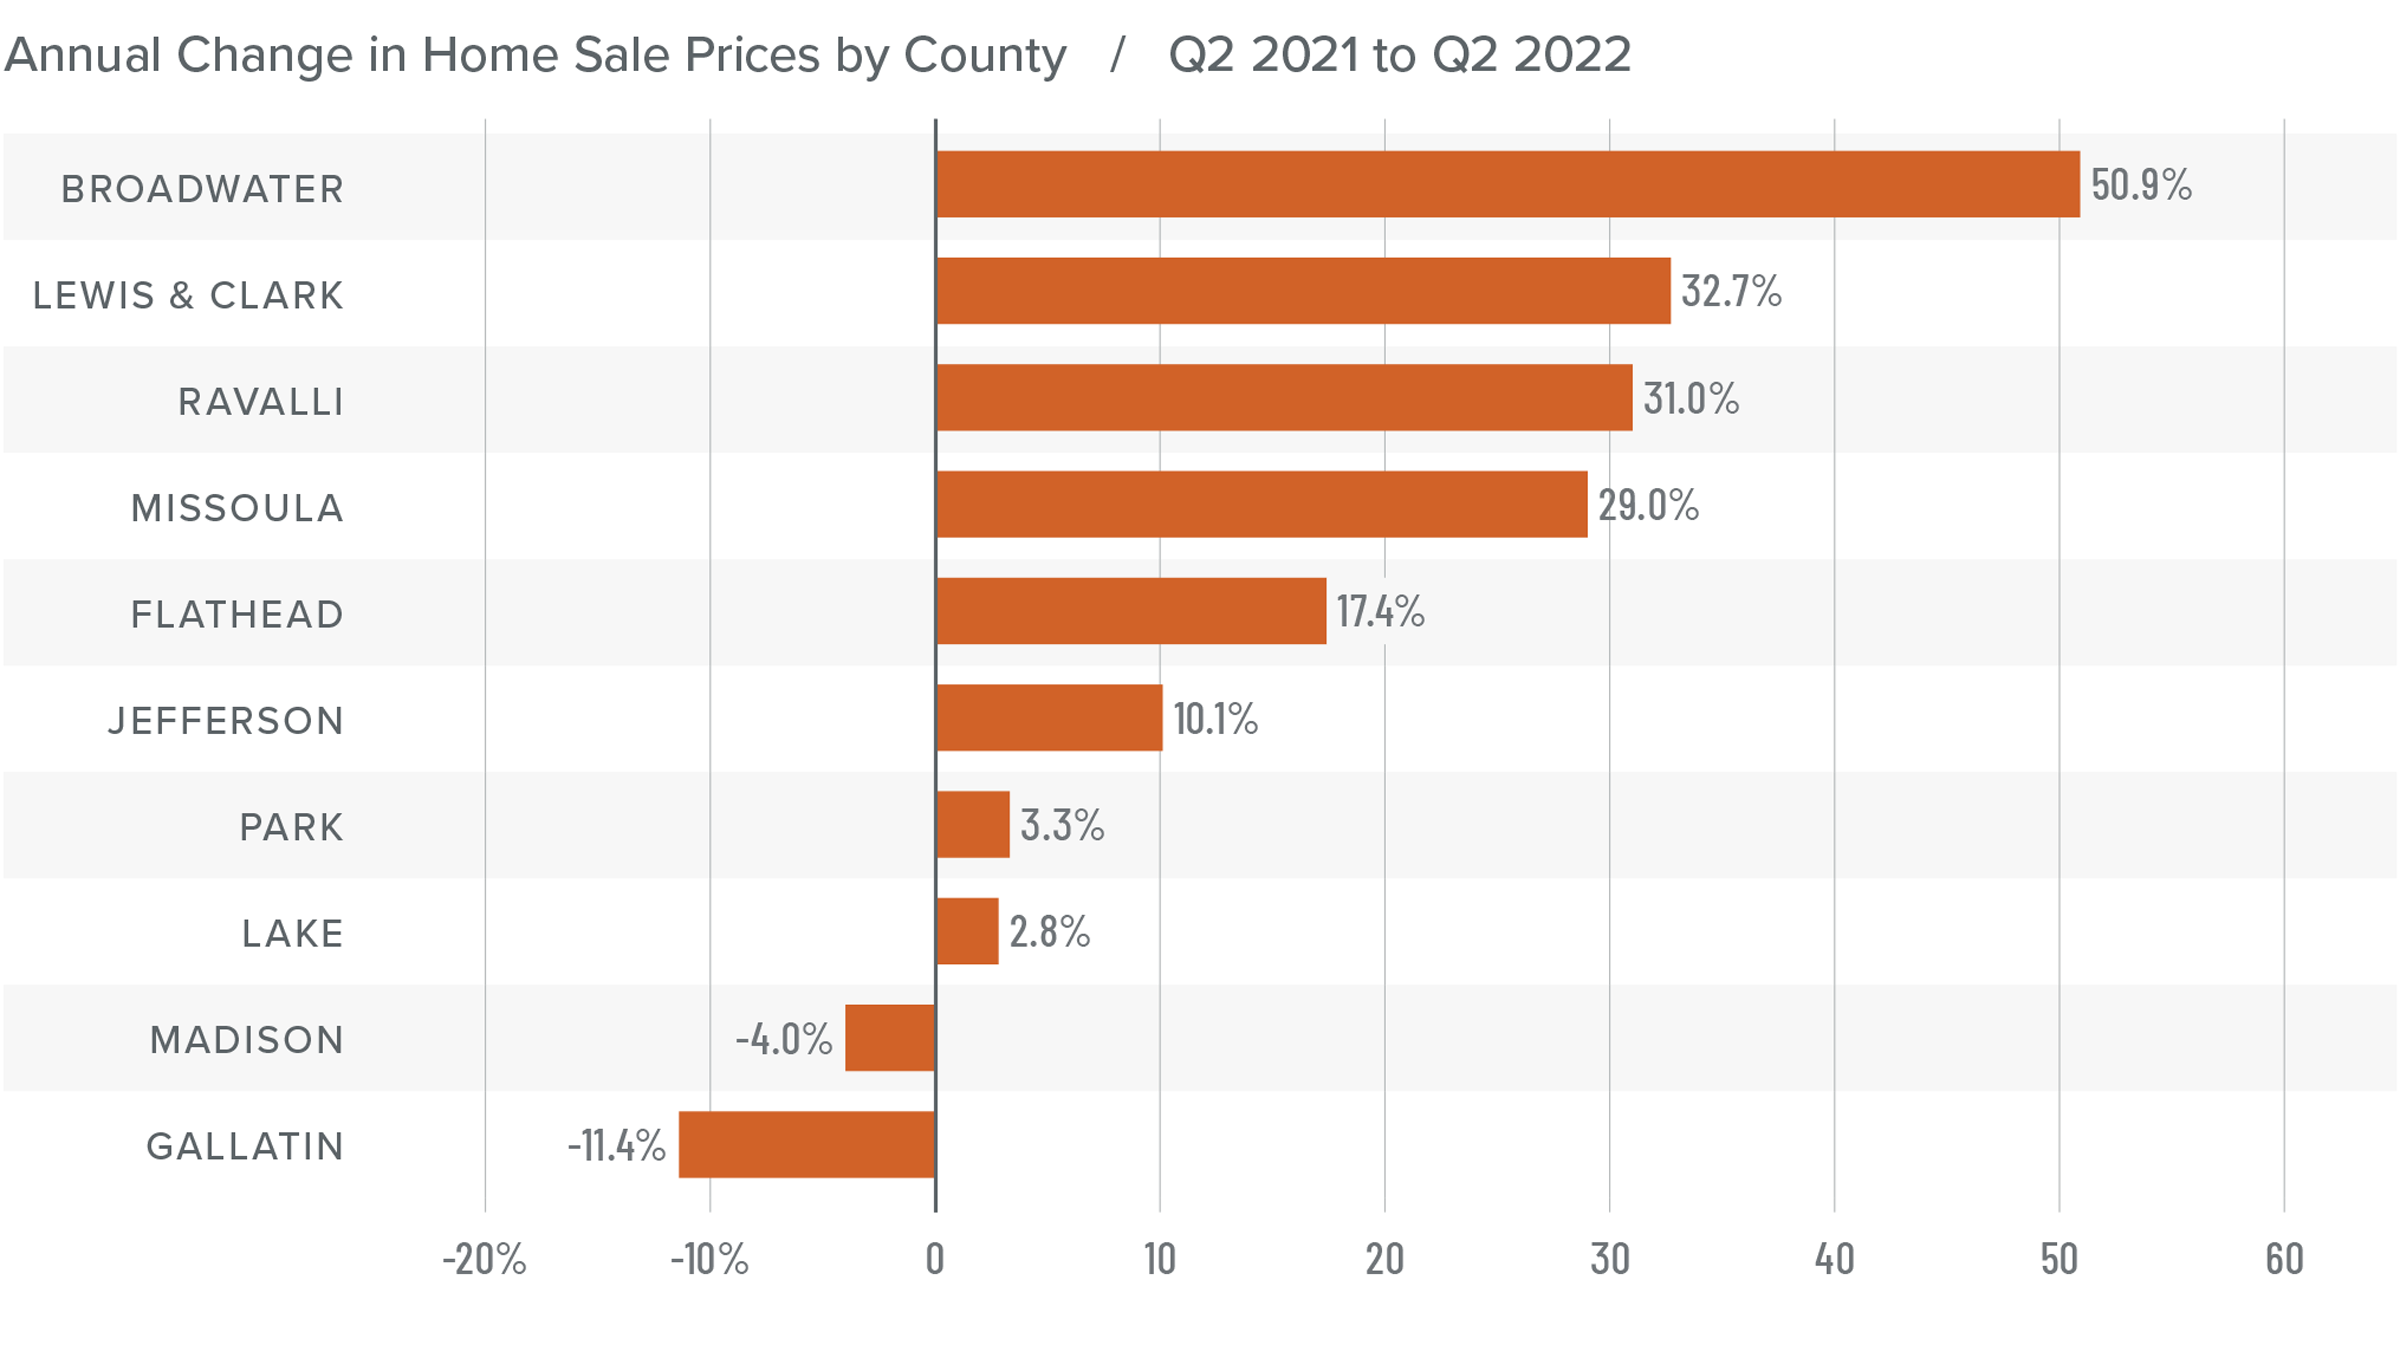
❱ Home prices rose 17.8% year over year to an average of $710,428 but were 12.9% lower than in the first quarter of 2022.
❱ I have started watching list prices more closely, as they are a leading indicator of the health of the housing market. Thus far, despite rising mortgage rates and inventory levels, sellers remain confident. This is evident in the median list price going up in every county other than Gallatin compared to the prior quarter.
❱ Although the quarterly drop may concern some, the average sale price used in this report is weighted to account for market size. If we use simple averages, prices in the second quarter were 11.9% higher than in the first quarter.
❱ Price growth has yet to slow but, given the changing market conditions, it’s only a matter of time before it does.
Mortgage Rates
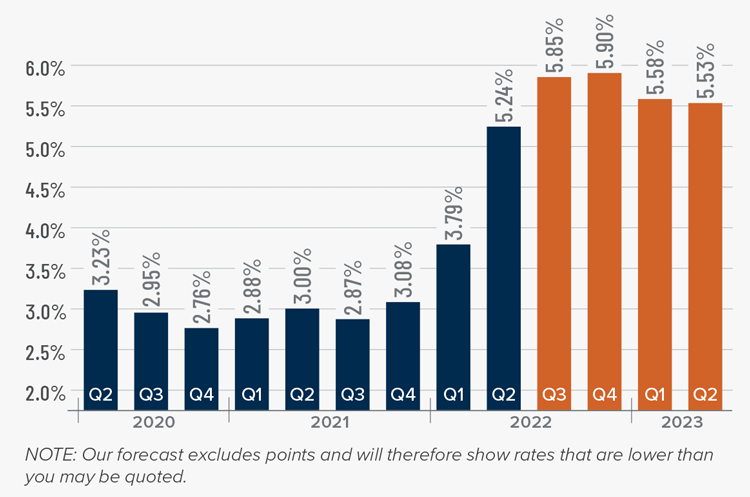
Although mortgage rates did drop in June, the quarterly trend was still moving higher. Inflation—the bane of bonds and, therefore, mortgage rates—has yet to slow, which is putting upward pressure on financing costs.
That said, there are some signs that inflation is starting to soften and if this starts to show in upcoming Consumer Price Index numbers then rates will likely find a ceiling. I am hopeful this will be the case at some point in the third quarter, which is reflected in my forecast.
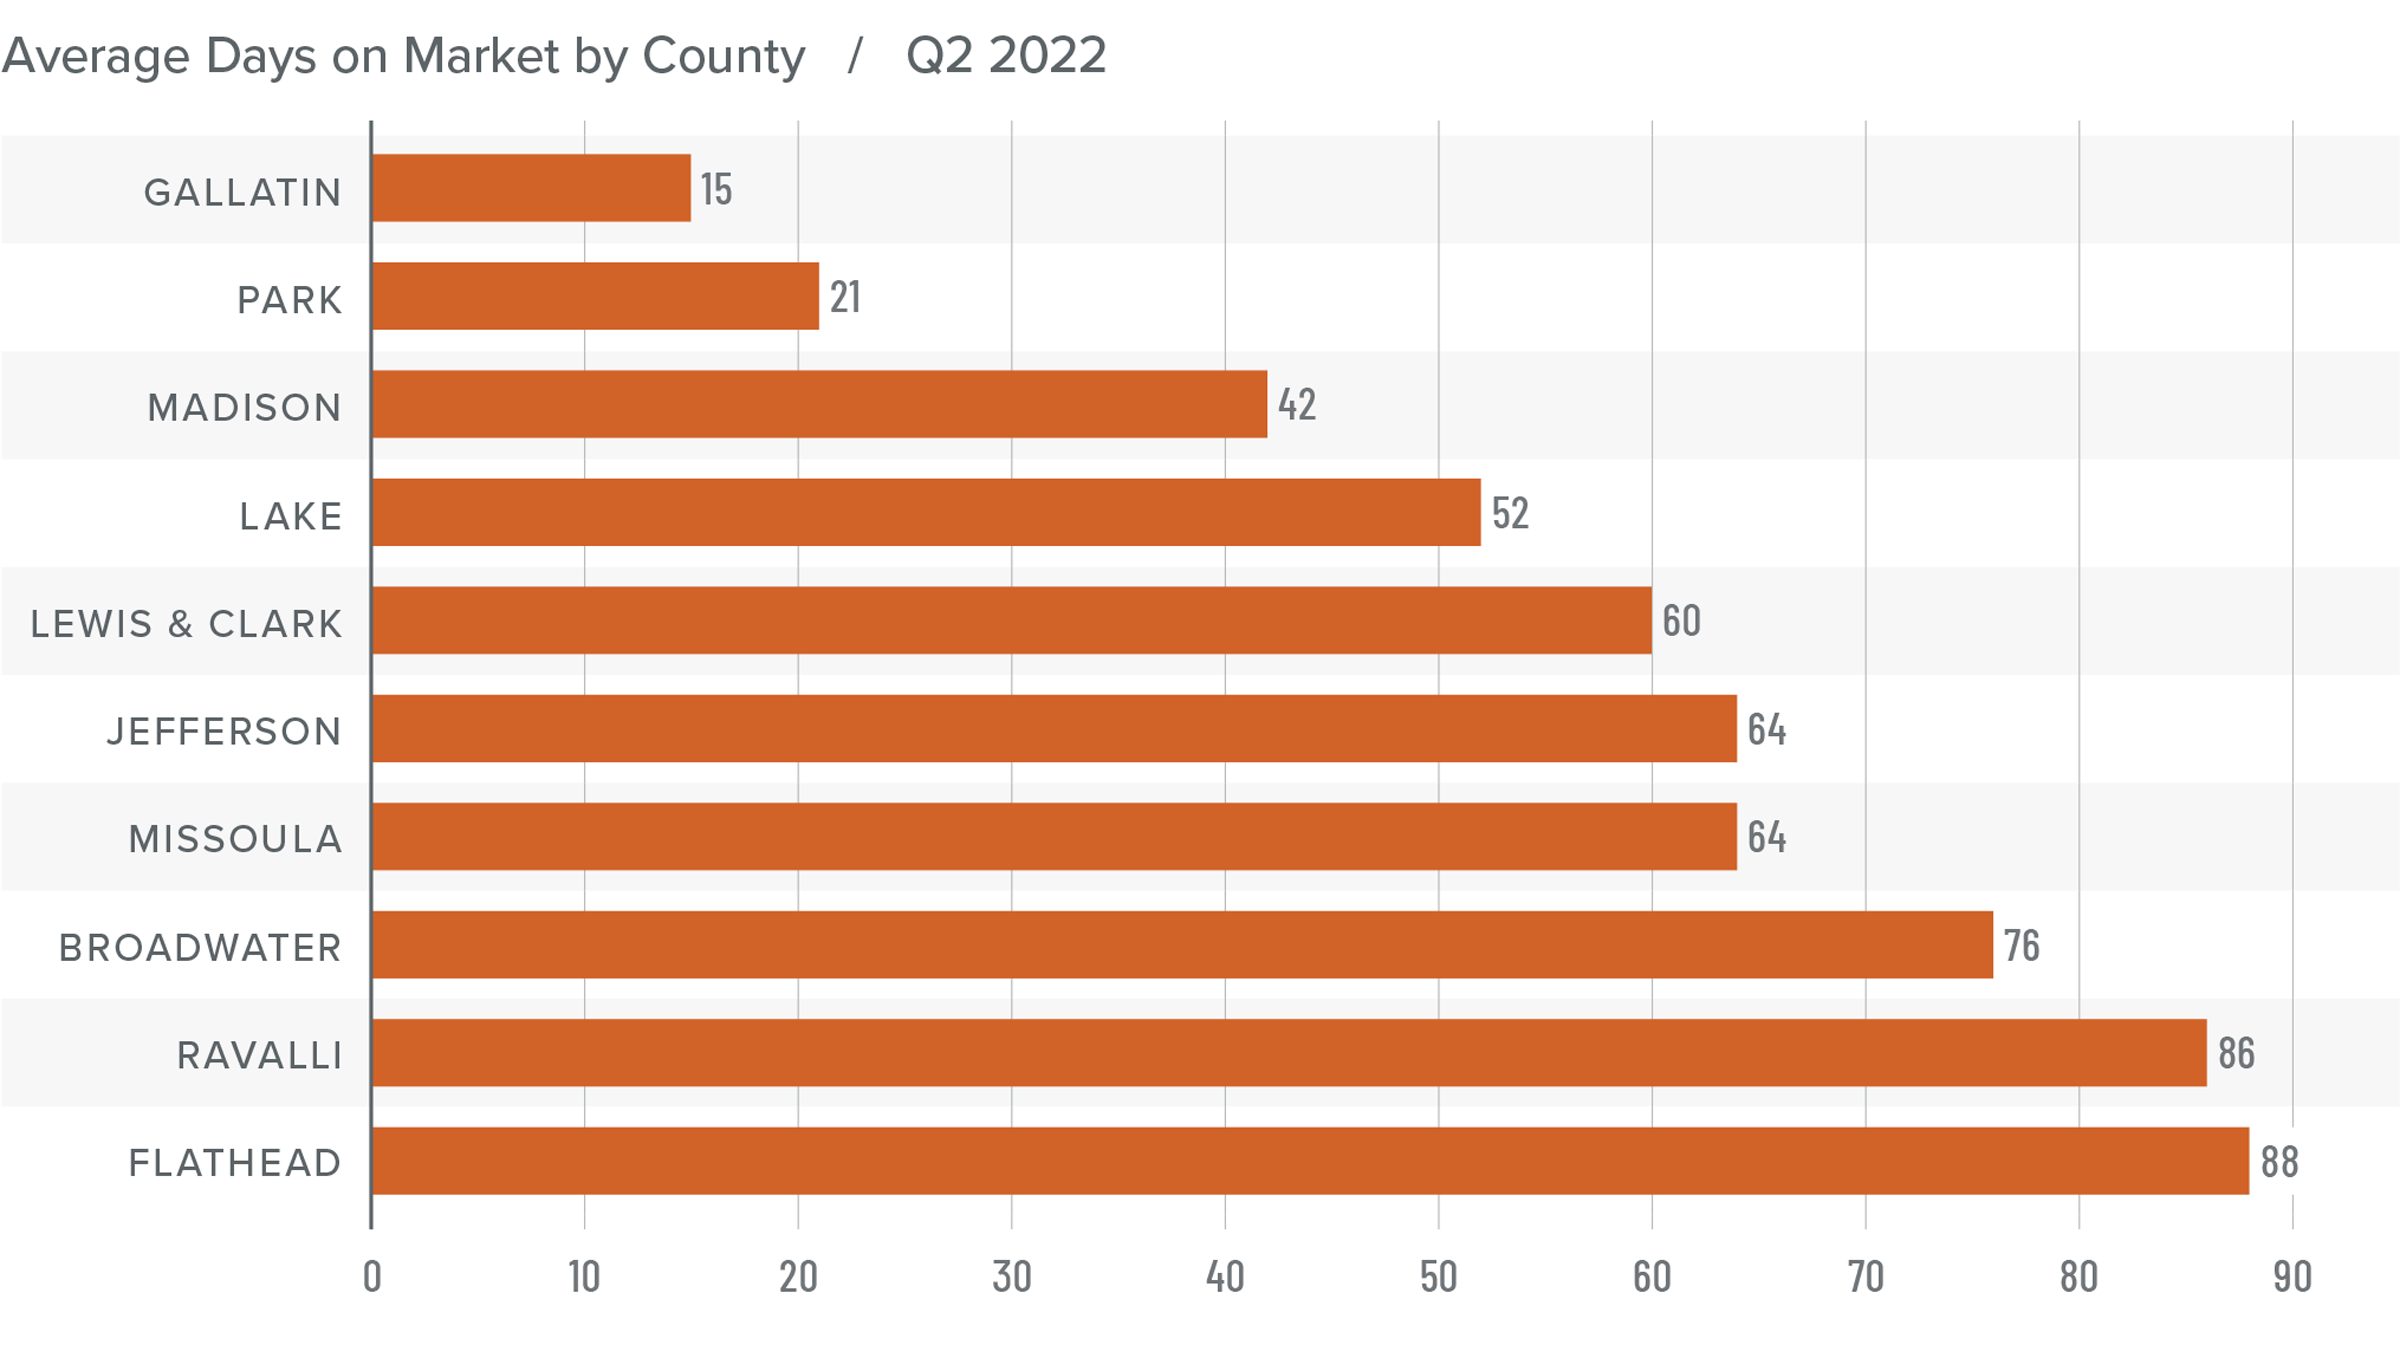
Montana Days on Market
❱ The average time it took to sell a home dropped 31 days compared to the second quarter of 2021.
❱ Homes sold fastest in Gallatin County. Flathead County homes took the longest time to find a buyer. All counties saw market time drop compared to a year ago.
❱ During the quarter, it took an average of 57 days to sell a home in the region.
❱ In comparison to the first quarter of the year, average market time fell in every market other than Jefferson (+17 days) and Broadwater (+45 days).
Conclusions
This speedometer reflects the state of the region’s real estate market using housing inventory, price gains, home sales, interest rates, and larger economic factors.
Even with a shortage of workers, the economy remains buoyant, which is an important factor when it comes to the regional housing market, particularly for buyers. Even though the number of homes for sale has grown significantly, which normally favors buyers, demand is strong and the market remains competitive. List prices continue to rise, demonstrating that sellers remain confident even in the face of higher financing costs, which is likely discouraging for home buyers. Sellers are clearly still in control.

As such, I have moved the needle a little more in the direction of sellers. Until we see list-price growth and transactional velocities slow significantly, we will not approach a balanced market.
About Matthew Gardner

As Chief Economist for Windermere Real Estate, Matthew Gardner is responsible for analyzing and interpreting economic data and its impact on the real estate market on both a local and national level. Matthew has over 30 years of professional experience both in the U.S. and U.K.
In addition to his day-to-day responsibilities, Matthew sits on the Washington State Governors Council of Economic Advisors; chairs the Board of Trustees at the Washington Center for Real Estate Research at the University of Washington; and is an Advisory Board Member at the Runstad Center for Real Estate Studies at the University of Washington where he also lectures in real estate economics.
")


