
 Facebook
 X
X
 Pinterest
 Copy Link

The following analysis of select counties of the Utah real estate market is provided by Windermere Real Estate Chief Economist Matthew Gardner. We hope that this information may assist you with making better-informed real estate decisions. For further information about the housing market in your area, please don’t hesitate to contact your Windermere Real Estate agent.
Regional Economic Overview
The Utah economy remains buoyant. Although the pace of job growth has tapered somewhat from 2021, jobs continue to be added faster than the long-term average. Over the past 12 months, the state has added 55,400 jobs, representing a growth rate of 3.4%. The counties covered in this report added almost 53,000 new jobs over the past year, representing a growth rate of 4%. The state’s unemployment rate in May was 2%, which is marginally above the all-time low of 1.9% in April of this year. The labor force continues to expand, suggesting that the region expects economic growth to remain strong. All in all, a very impressive situation.
Utah Home Sales
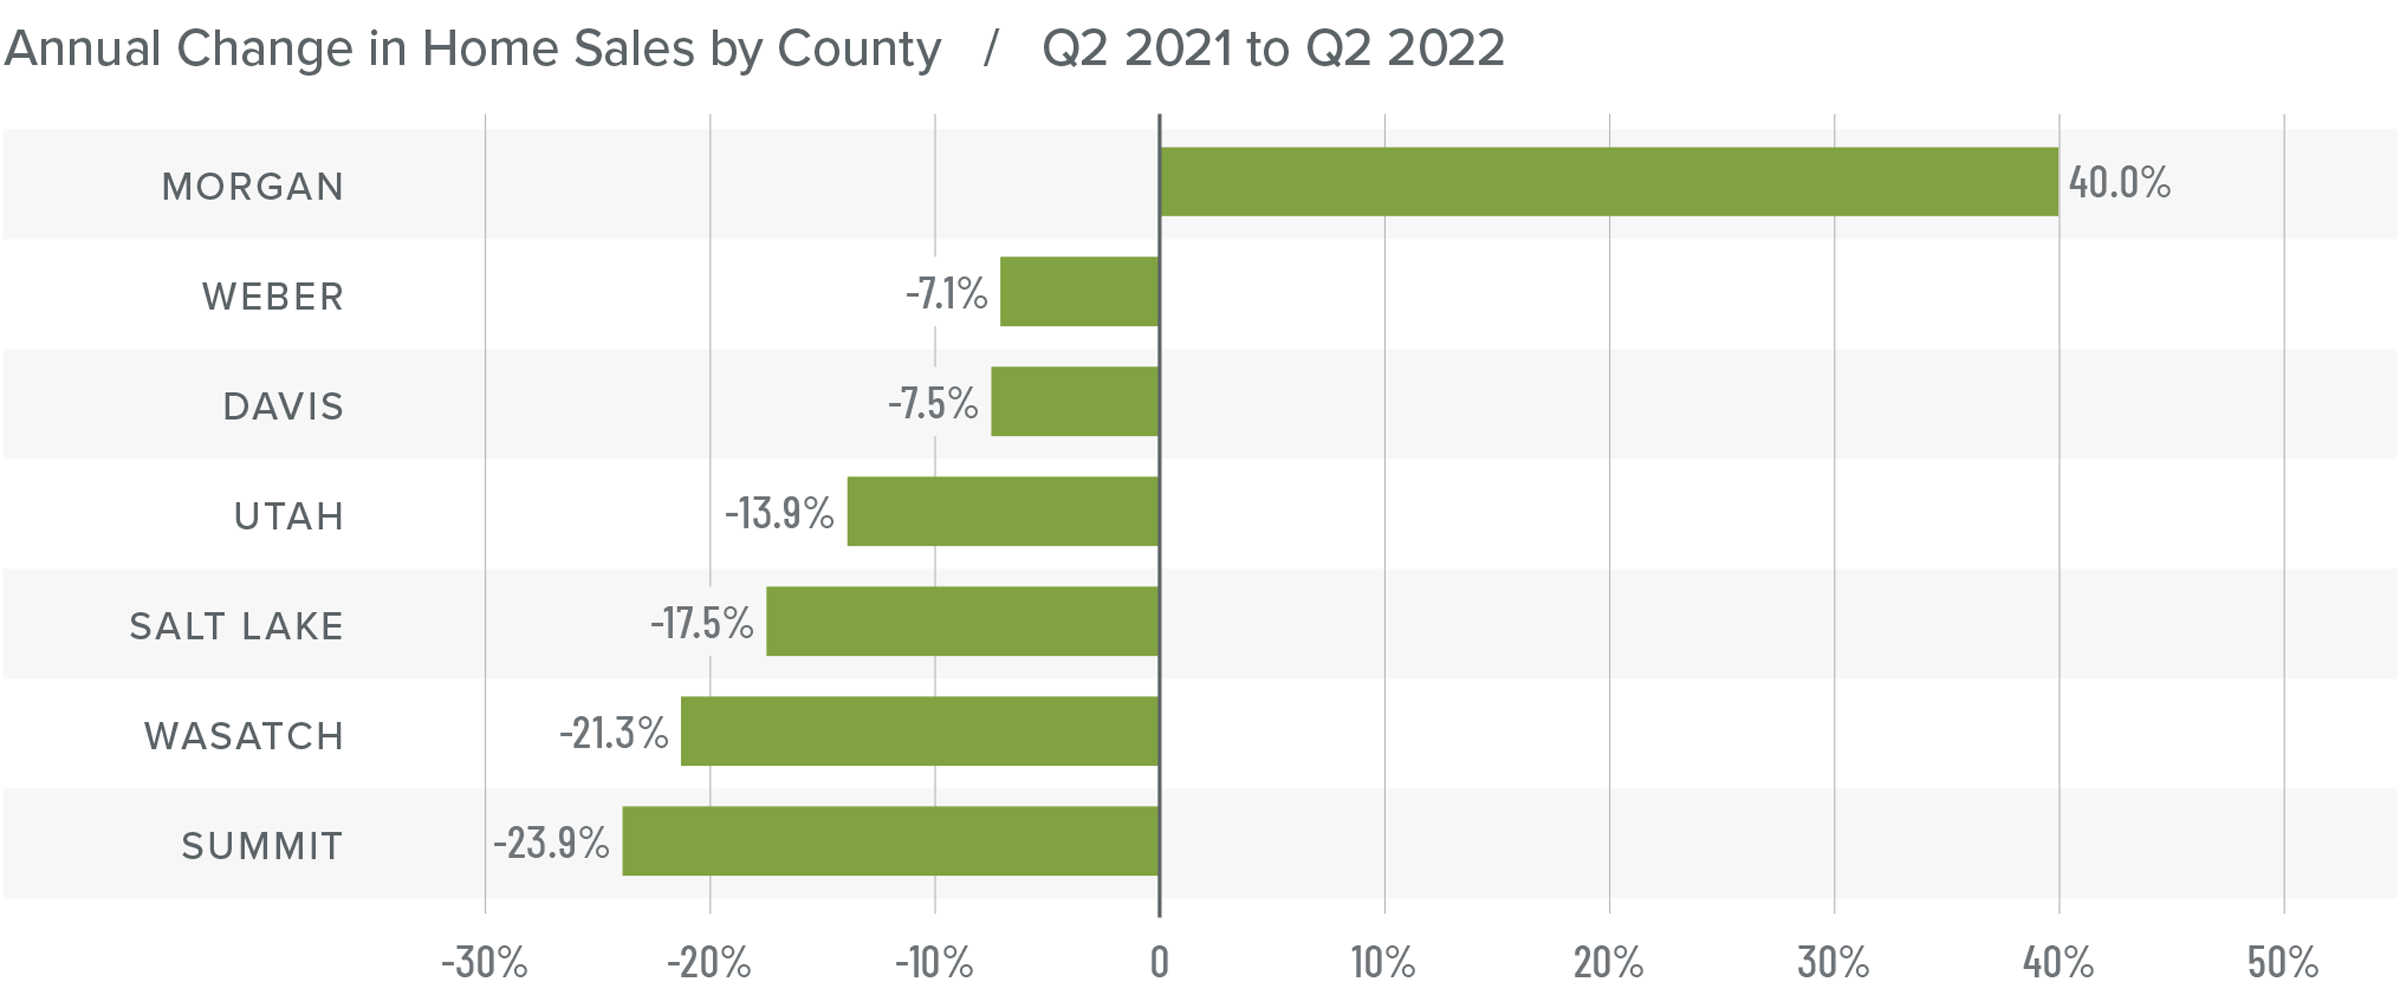
❱ In the second quarter of 2022, 8,501 homes sold, which was a drop of 14.4% year over year. Sales were 30.9% higher than in first quarter of the year.
❱ Year over year, sales rose in the small Morgan County area but fell in the rest of the markets included in this report. Conversely, sales rose across the board compared to the first quarter, with impressive growth in Morgan, Davis, Utah, and Salt Lake counties.
❱ Inventory levels, which had been remarkably low, rose 206.2% from the first quarter of the year. This clearly had a positive effect on the market as more choice for buyers led to more sales.
❱ Buyers appeared to shrug off the fact that mortgage rates rose more than 1.5% in the quarter, which suggests they still believe owning a home is a solid investment.
Utah Home Prices
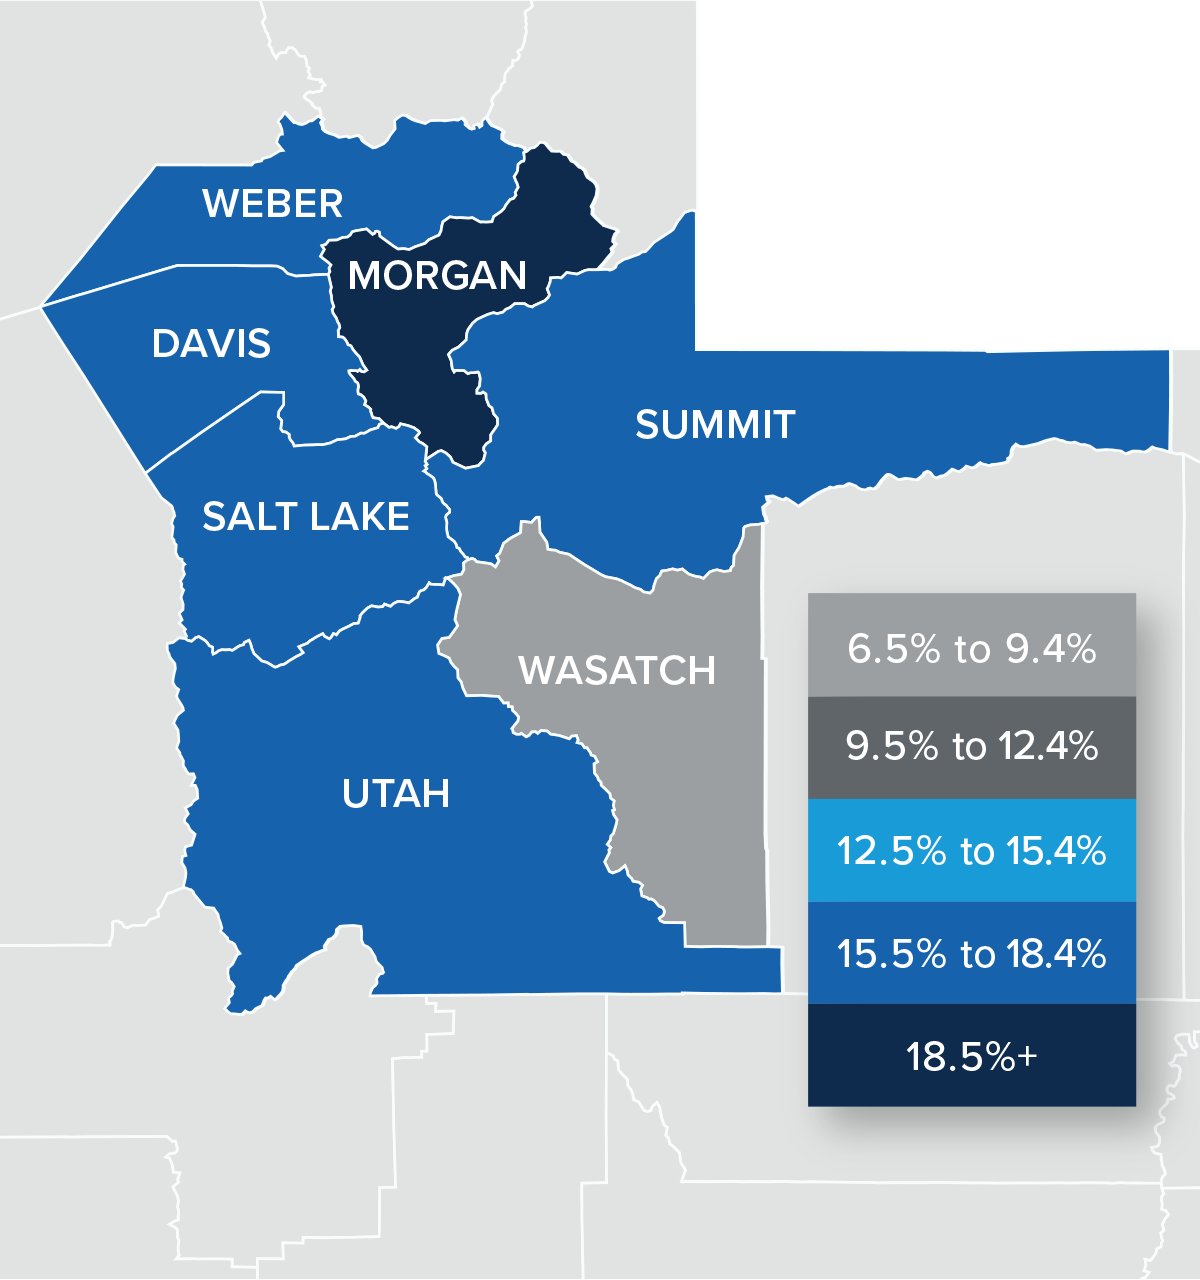
❱ Even with more homes on the market, prices continued to rise. Home prices rose 15.4% year over year to an average of $665,697, and they were 4.2% higher than in the first quarter of 2021.
❱ I have started watching list prices, as they will be a leading indicator of whether the market is starting to feel the impacts of declining affordability due to rising financing costs. In the second quarter, the median list price in the region dropped 2.2%, but it rose in Morgan, Davis, and Salt Lake counties.
❱ All areas contained in the report except for Wasatch County saw sale prices increase by double digits compared to a year ago. Compared to the first quarter of this year, prices were higher in every county other than Summit.
❱ Higher financing costs combined with declining affordability may have started to slow the rapid pace of appreciation we’ve seen over the past two years. This is nothing to be concerned about; rather it suggests that the market is starting to return to some sense of normalcy.

Mortgage Rates
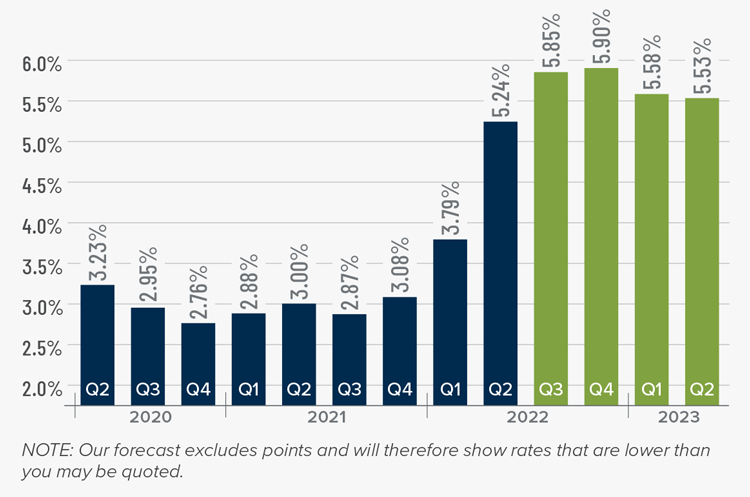
Although mortgage rates did drop in June, the quarterly trend was still moving higher. Inflation—the bane of bonds and, therefore, mortgage rates—has yet to slow, which is putting upward pressure on financing costs.
That said, there are some signs that inflation is starting to soften and if this starts to show in upcoming Consumer Price Index numbers then rates will likely find a ceiling. I am hopeful this will be the case at some point in the third quarter, which is reflected in my forecast.
Utah Days on Market
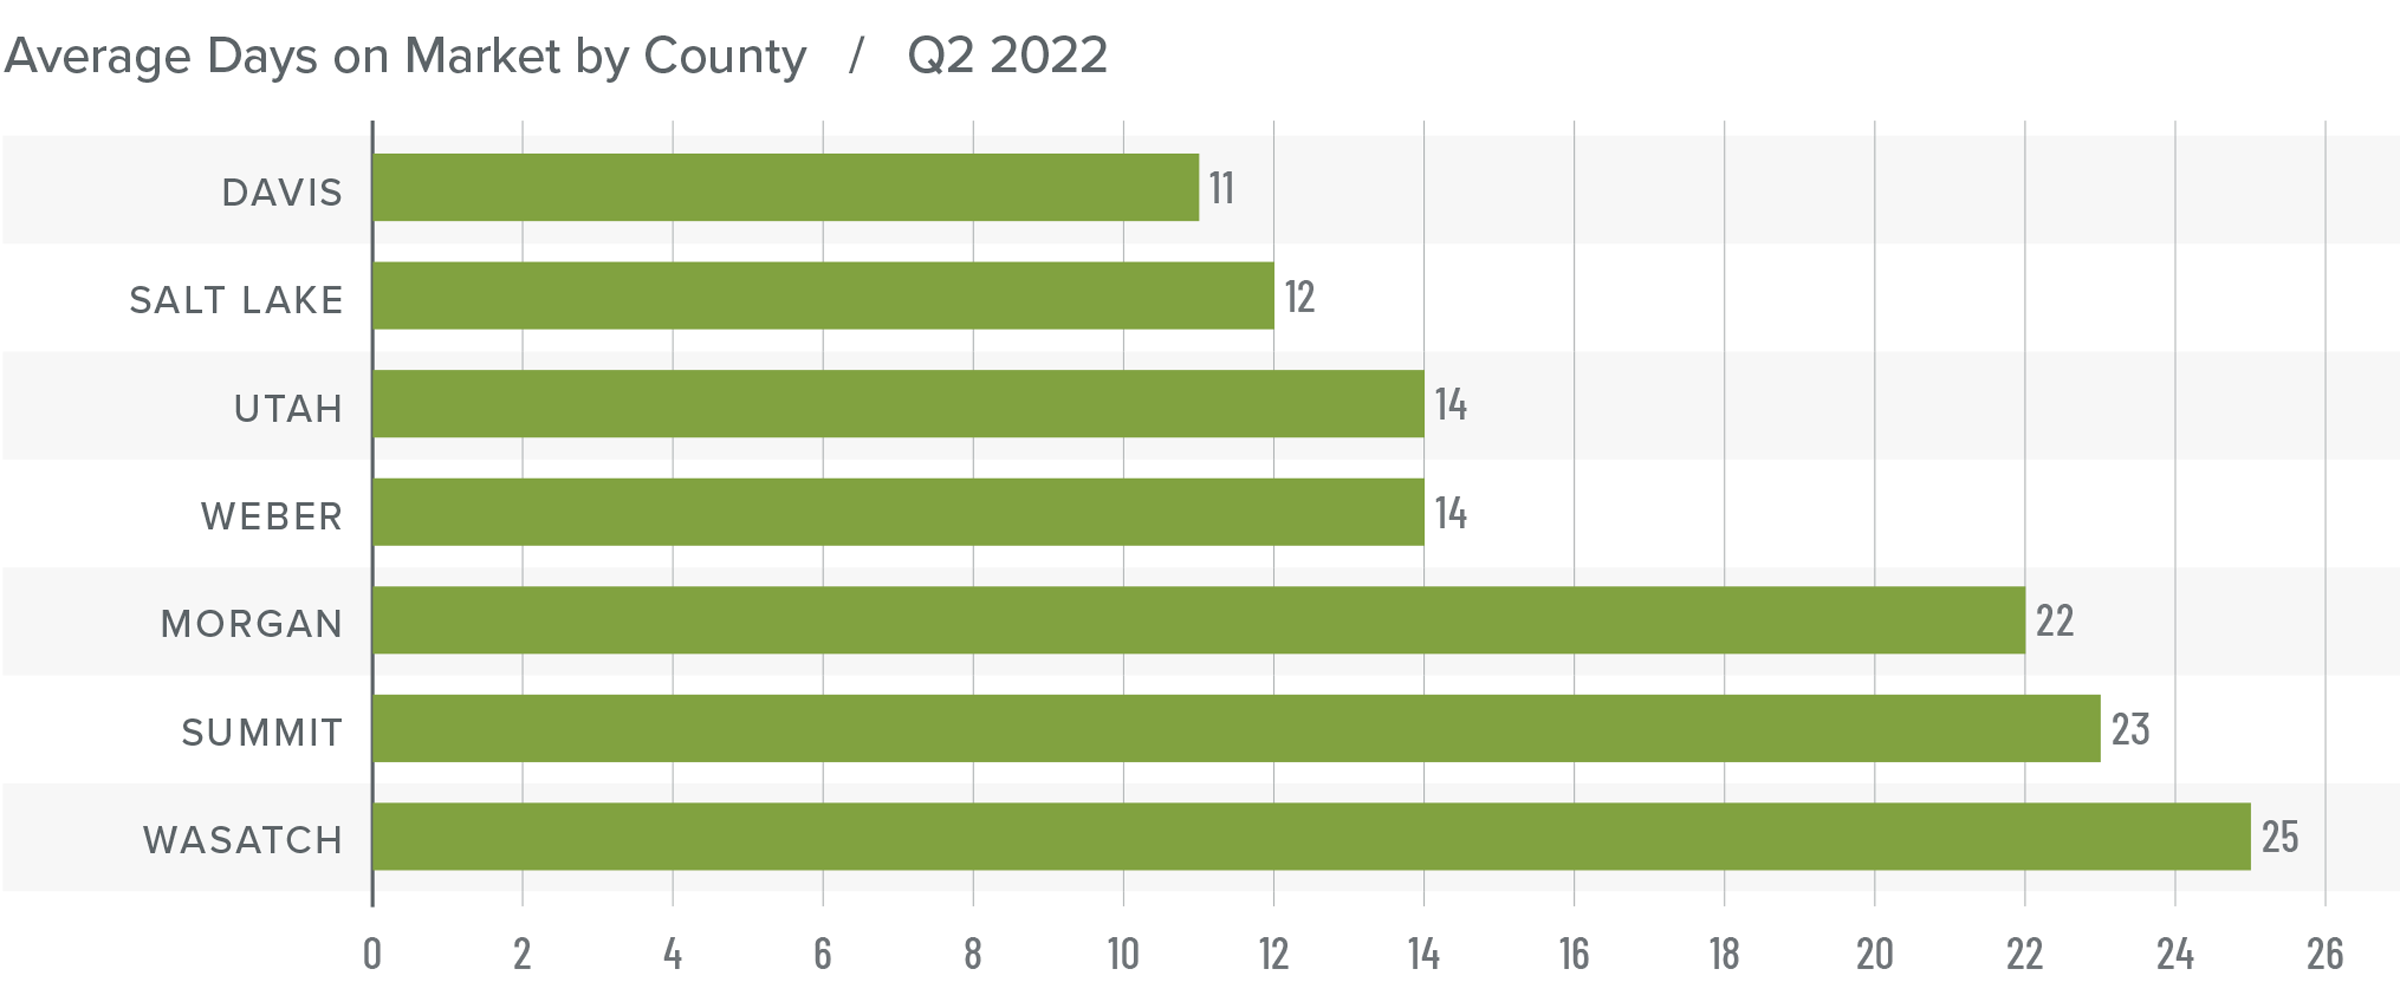
❱ The average time it took to sell a home in the counties covered by this report dropped two days compared to the same period a year ago.
❱ Homes again sold fastest in Davis County, and every county except Summit and Wasatch saw average time on market rise compared to a year ago. The greatest drop in market time was in Summit County, where it took 19 fewer days to sell a home.
❱ During the second quarter, it took an average of 17 days to sell a home in the region. Not only did market time fall year over year, but it took 8 fewer days for homes to sell compared to first quarter.
❱ The market remains very competitive and, as mentioned earlier, appears to not yet be impacted by higher mortgage rates.
Conclusions
This speedometer reflects the state of the region’s real estate market using housing inventory, price gains, home sales, interest rates, and larger economic factors.
The number of homes for sale in Utah has risen significantly and buyers are absorbing the additional supply. That said, higher inventory levels are forcing sellers to be a little more competitive than they were, as demonstrated by declining median list prices in several areas. I would contend that the market is not headed for any sort of correction; rather it has started to trend back to some sense of normalcy. This may be concerning to those who have become accustomed to the frenetic pace the market has experienced since the start of the pandemic, but it really is nothing to worry about.
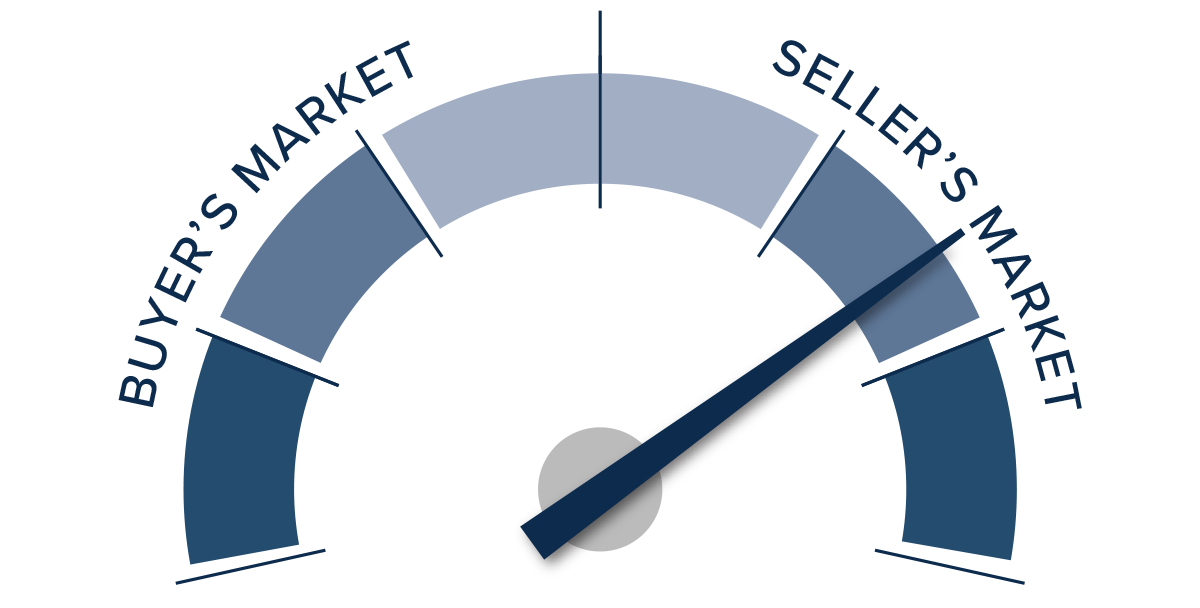
Sellers still have the upper hand and well-positioned, appropriately-priced homes continue to attract significant interest from buyers. Given all the data discussed in this report, I have left the needle in the same position as the last quarter. Although the market still favors sellers, a shift may be on the way that would lead us toward a more balanced market.
About Matthew Gardner

As Chief Economist for Windermere Real Estate, Matthew Gardner is responsible for analyzing and interpreting economic data and its impact on the real estate market on both a local and national level. Matthew has over 30 years of professional experience both in the U.S. and U.K.
In addition to his day-to-day responsibilities, Matthew sits on the Washington State Governors Council of Economic Advisors; chairs the Board of Trustees at the Washington Center for Real Estate Research at the University of Washington; and is an Advisory Board Member at the Runstad Center for Real Estate Studies at the University of Washington where he also lectures in real estate economics.
")


