
 Facebook
 X
X
 Pinterest
 Copy Link
Sleek, sustainable design, open concept floor plans, minimalism, and eco-conscious thinking are defining characteristics of modern architecture. These concepts were formed in the early to mid-twentieth century as part of the modern art movement which encompassed art deco interior design and mid-century modern architecture among other styles. Here’s a breakdown of the features that define modern architecture.
6 Features of Modern Architecture
1. Clean Geometric Lines
At the heart of modernist values lies the simplification of form. Ornate decorations quickly became a thing of the past as designers became focused on taking a no-frills approach to home design. Modernist homes have a very linear feel with straight lines and exposed building materials, as opposed to more irregular shapes that were popular in the past.
2. Multifunctional Spaces
Multifunctional living spaces are a foundational element of modern homes. Built-in storage is commonly used to reflect this multi-purpose, space-saving feel. This gives added significance to the spaces in a home by upping each one’s utility. It creates an environment where everything has purpose.
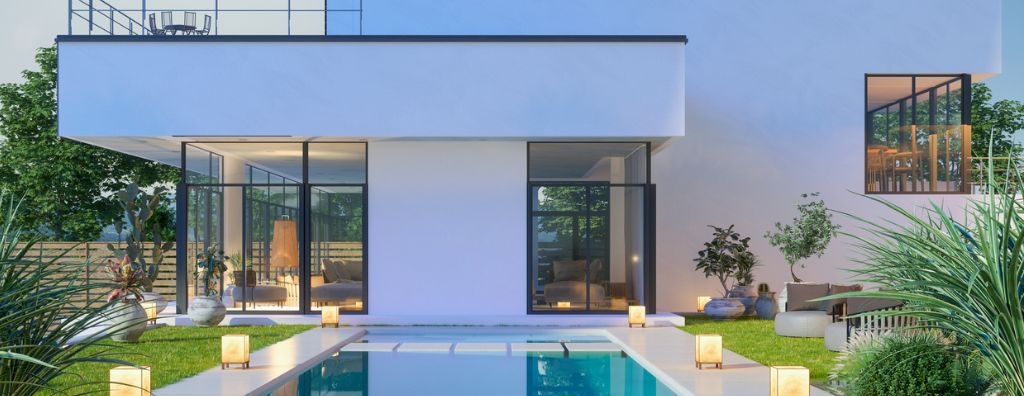
3. Eco-Friendly
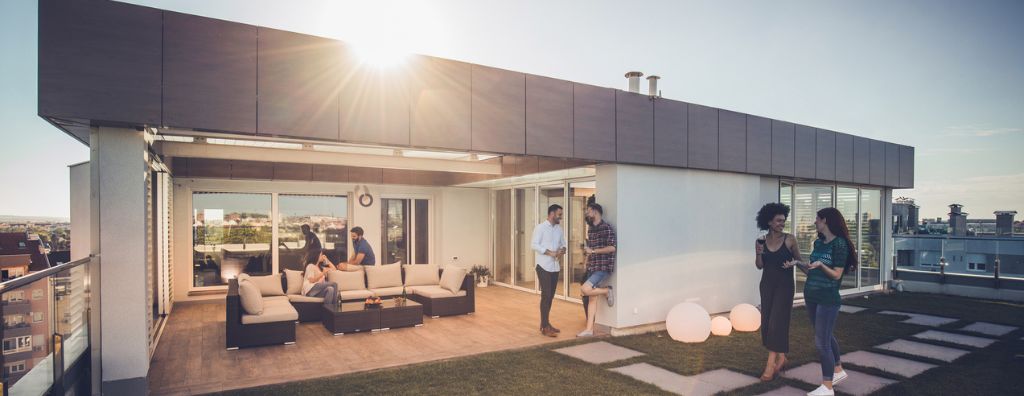
Modern homes are well suited for technological and eco-friendly home upgrades, as well as eco-friendly building materials and energy efficient practices, and flat roofs to accommodate solar power. A new trend is to decorate each room with plants for a calming, soothing effect. Large windows are abundant in modern architecture, allowing light to fill and expand the interior space, bringing the natural world indoors.
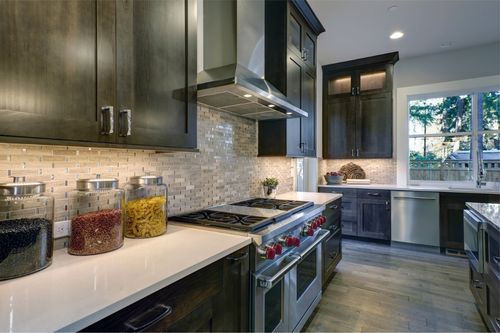
Image Source: Getty Images – Image Credit: irina88w
4. Post-and-Beam Structure
Exposed wood posts and ceiling beams are classic elements in modern architecture and modern offshoots like farmhouse interior design. Modern homes significantly emphasize the structure rather than hiding the bones behind drywall. In new modern homes the post-and-beam structure can be made of concrete, iron, or other materials. The visible horizontal and vertical beams reinforce the clean geometric lines of the space.
5. Open Concept
Modern design strives to “open” the space by eliminating enclosed rooms. A common design method is to open the kitchen and dining room into an open living space, allowing the spaces to flow into one another.
6. Minimalism
With open and connected modernist spaces, careful curation of furniture, décor, and household objects is paramount to incorporating the modernist aesthetic. Generally, modernist homes have art and furniture that reflects the clean geometric lines and the natural materials of the architecture, leaving less space for clutter. Minimalist philosophies encourage few household items that serve both form and function, which work well within this design and architectural style.
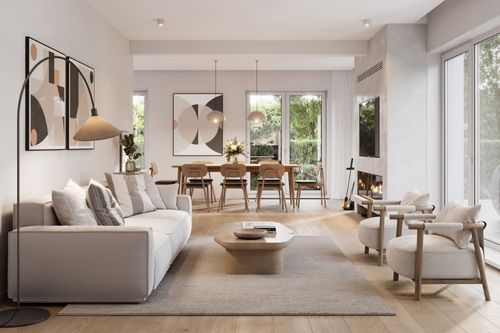
Image Source: Getty Images – Image Credit: alvarez
Contemporary vs. Modern Architecture & Design
The terms “contemporary” and “modern” are thrown around interchangeably. They do possess a certain degree of overlapping qualities, but specifically in the design world, “modern” refers to styles influenced by the early to mid-twentieth century movement, while contemporary design is what is popular in the present. Whatever interior design trends are at the forefront can be said to be contemporary, while modern interior design is still influenced by a specific period in the past.
For more information on home design, read about how to keep up with trends while decorating your home colorfully:
Colorful Modern Design Trends for Your Home
Featured Image Source: Getty Images – Image Credit: onurdongel


")


