
 Facebook
 X
X
 Pinterest
 Copy Link

The following analysis of select counties of the Northern California real estate market is provided by Windermere Real Estate Chief Economist Matthew Gardner. We hope that this information may assist you with making better-informed real estate decisions. For further information about the housing market in your area, please don’t hesitate to contact your Windermere Real Estate agent.
Regional Economic Overview
Over the past year, the Northern California markets covered by this report added 159,000 jobs. Given these solid job gains, it was no surprise that the unemployment rate fell from 5.6% to 2.9%. By county, the lowest jobless rate was in Santa Clara County (2.3%) and the highest rate was in Shasta County at 4.3%. The labor force continues to expand, which is a positive signal of the relative strength of the economy in Northern California. The region is only 17,000 jobs short of its pre-pandemic peak employment.
Northern California Home Sales
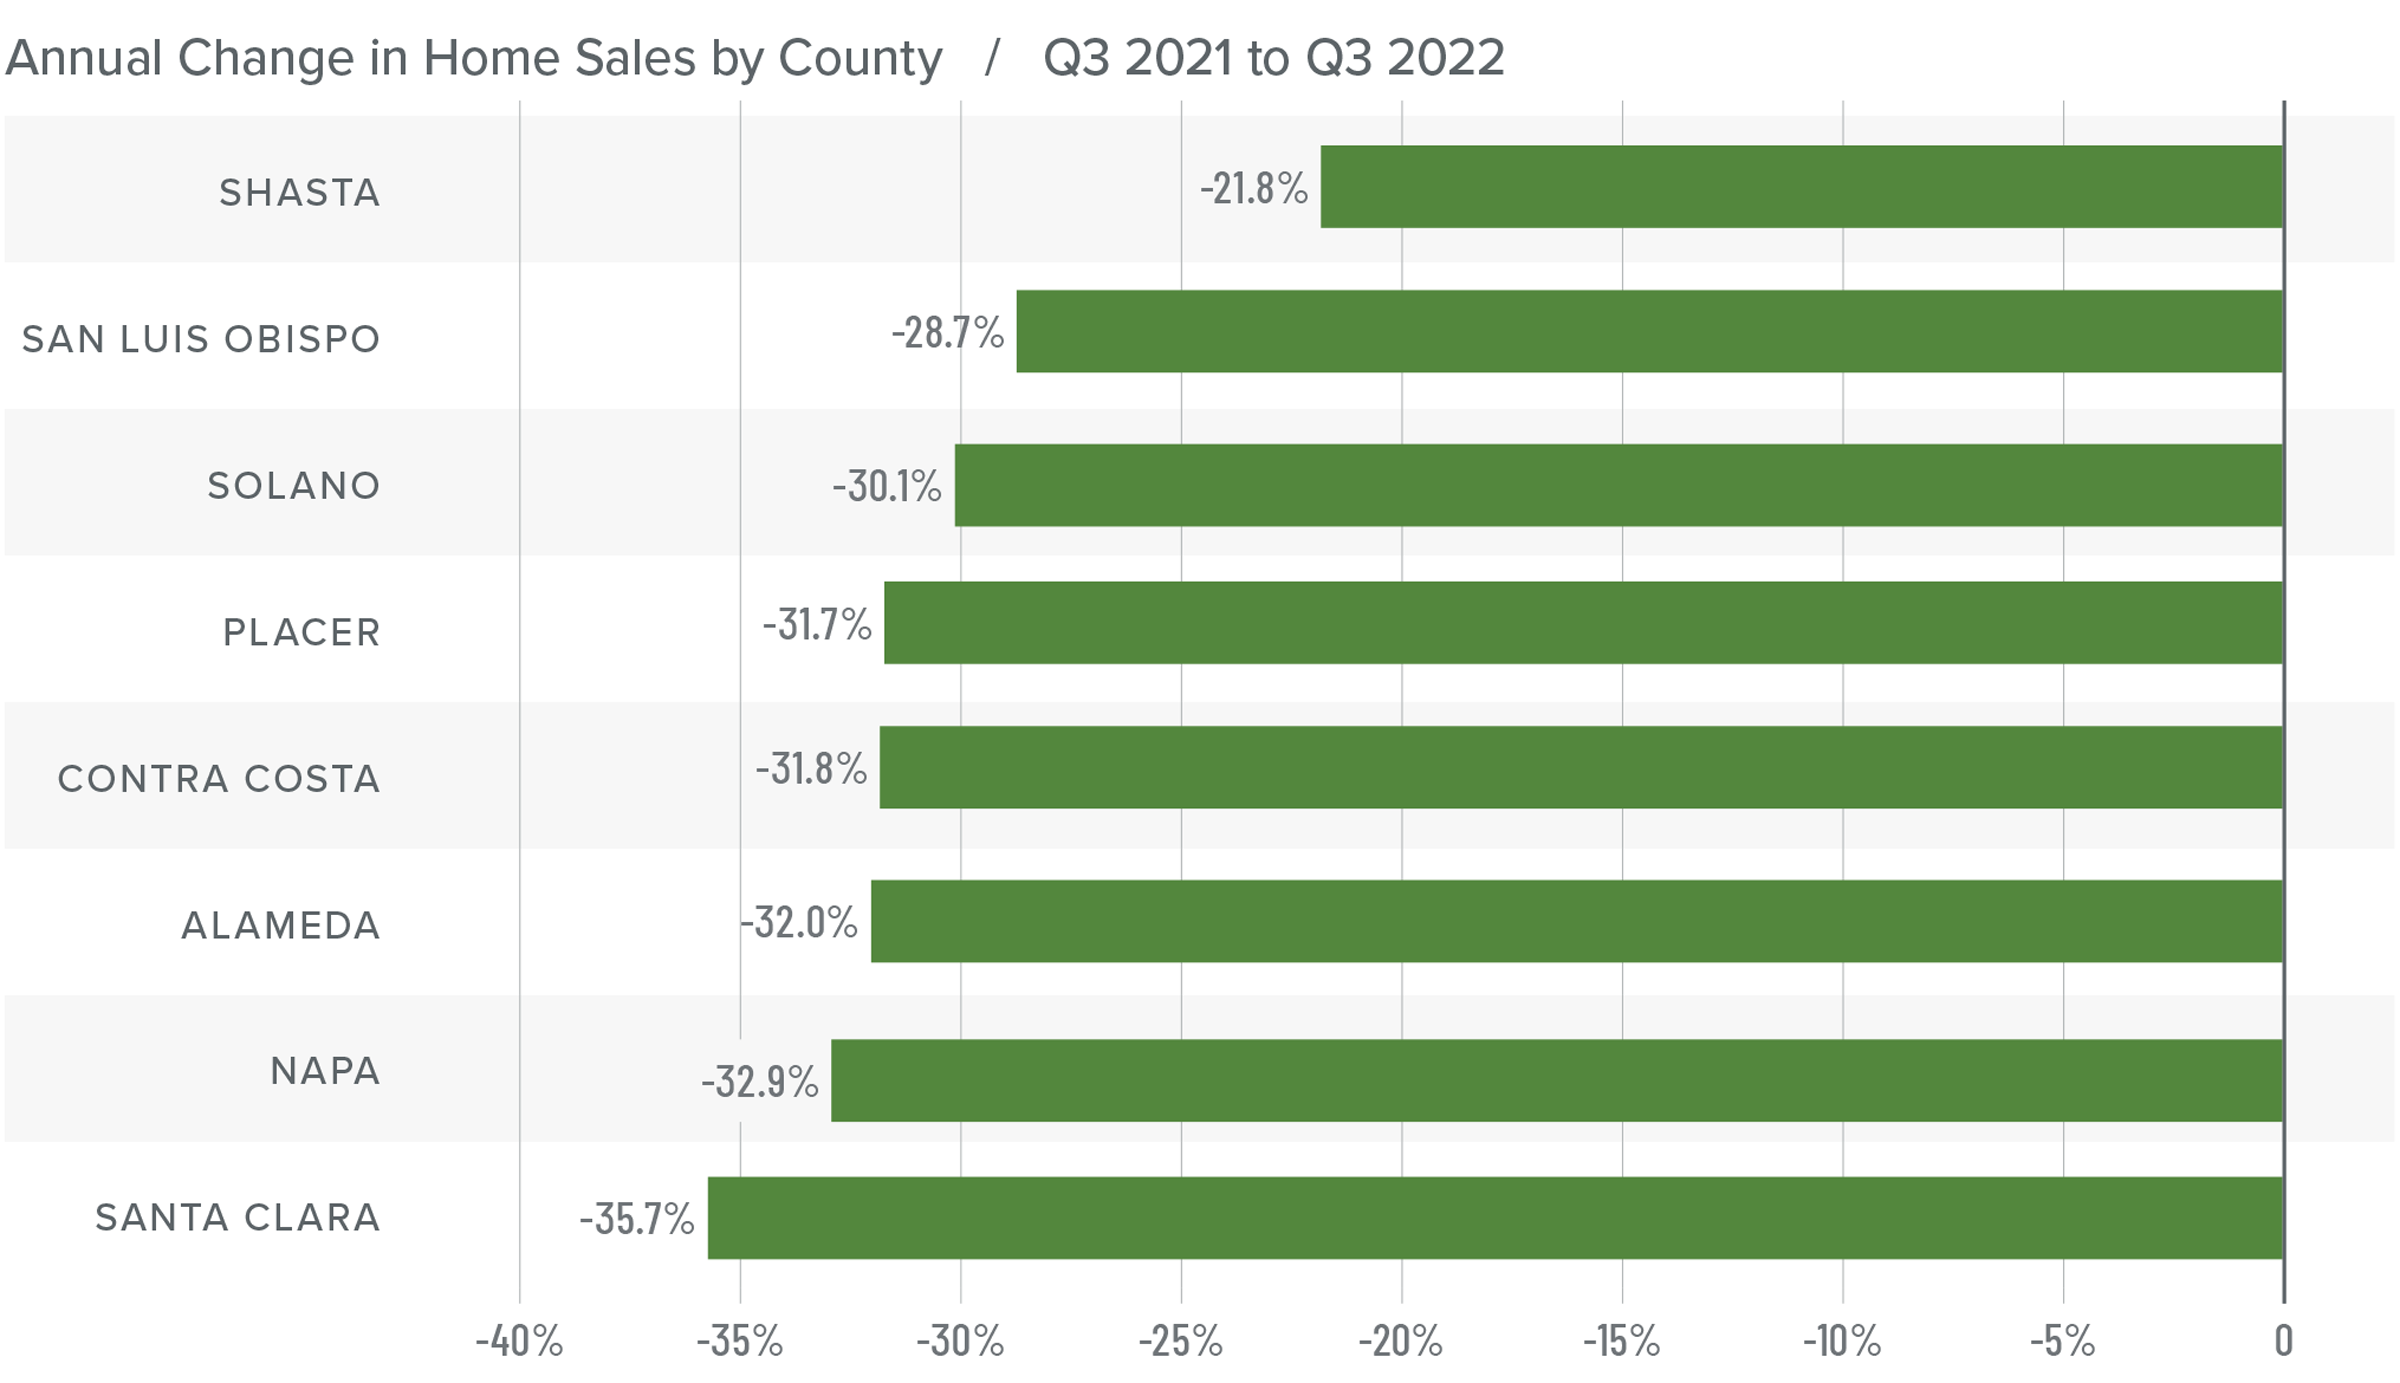
❱ In the third quarter of this year, 11,454 homes sold, which is down 32.5% from a year ago and down 19.5% from the second quarter.
❱ Year over year, sales fell across the board. Though the largest drop was in Santa Clara County, there were significant declines throughout the region.
❱ The number of homes for sale continues to grow, with total average listings in the quarter up 29.2% from a year ago. There were 25.5% more homes for sale than in the second quarter.
❱ Pending home sales fell 16.6% from the second quarter, suggesting that the market softened during the late summer months.
Northern California Home Prices
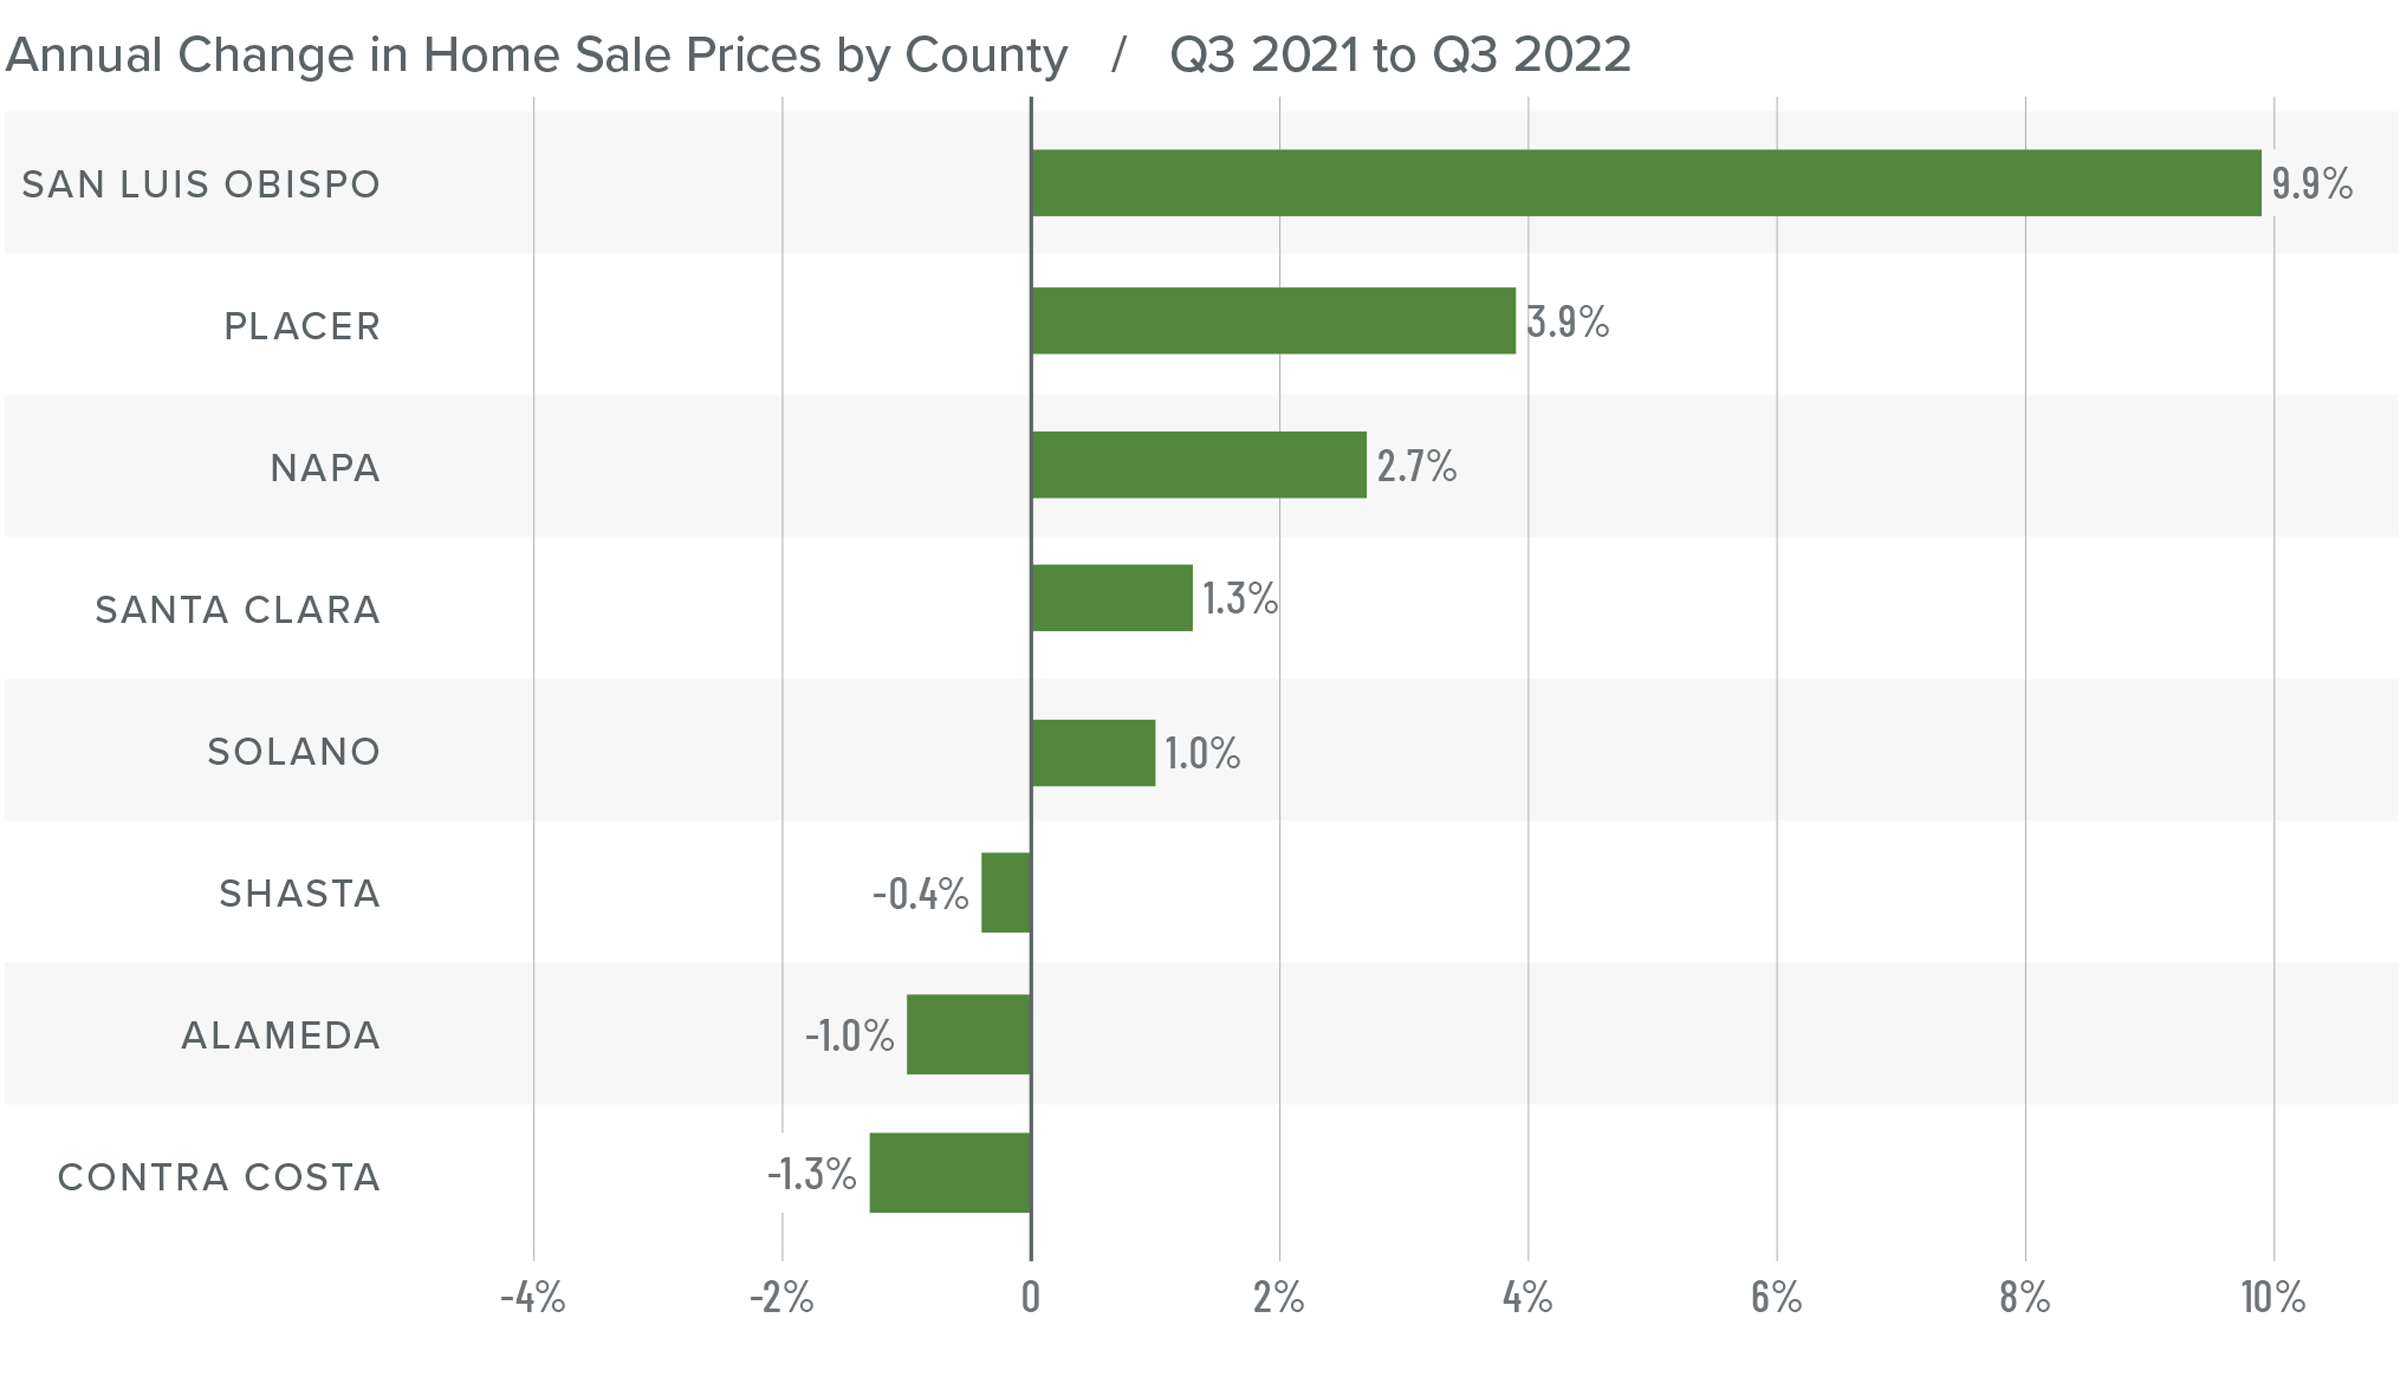
❱ The significant increase in mortgage rates has started to impact home prices. The average home sale price dropped .5% from a year ago and 12.6% from the second quarter of 2022.
❱ Median listing prices rose 1.6% from the second quarter, but the increase was not widespread. Although asking prices jumped 18.8% in San Luis Obispo County and rose modestly in Napa and Shasta counties, this was offset by lower asking prices in the balance of the markets.
❱ Prices rose in five of the counties contained in this report, while they fell in three. Compared to the second quarter of 2022, prices fell across the board, with double-digit drops in Alameda, Contra Costa, and Napa counties.
❱ Financing costs are negatively impacting home prices, which I anticipate will continue through the balance of the year and into 2023.
Mortgage Rates
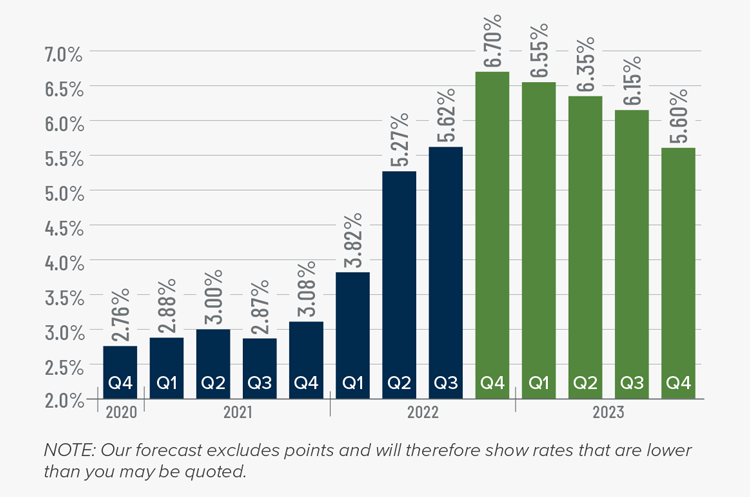
This remains an uncertain period for mortgage rates. When the Federal Reserve slowed bond purchases in 2013, investors were accused of having a “taper tantrum,” and we are seeing a similar reaction today. The Fed appears to be content to watch the housing market go through a period of pain as they throw all their tools at reducing inflation.
As a result, mortgage rates are out of sync with treasury yields, which not only continues to push rates much higher, but also creates violent swings in both directions. My current forecast calls for rates to peak in the fourth quarter of this year before starting to slowly pull back. That said, they will remain in the 6% range until the end of 2023.
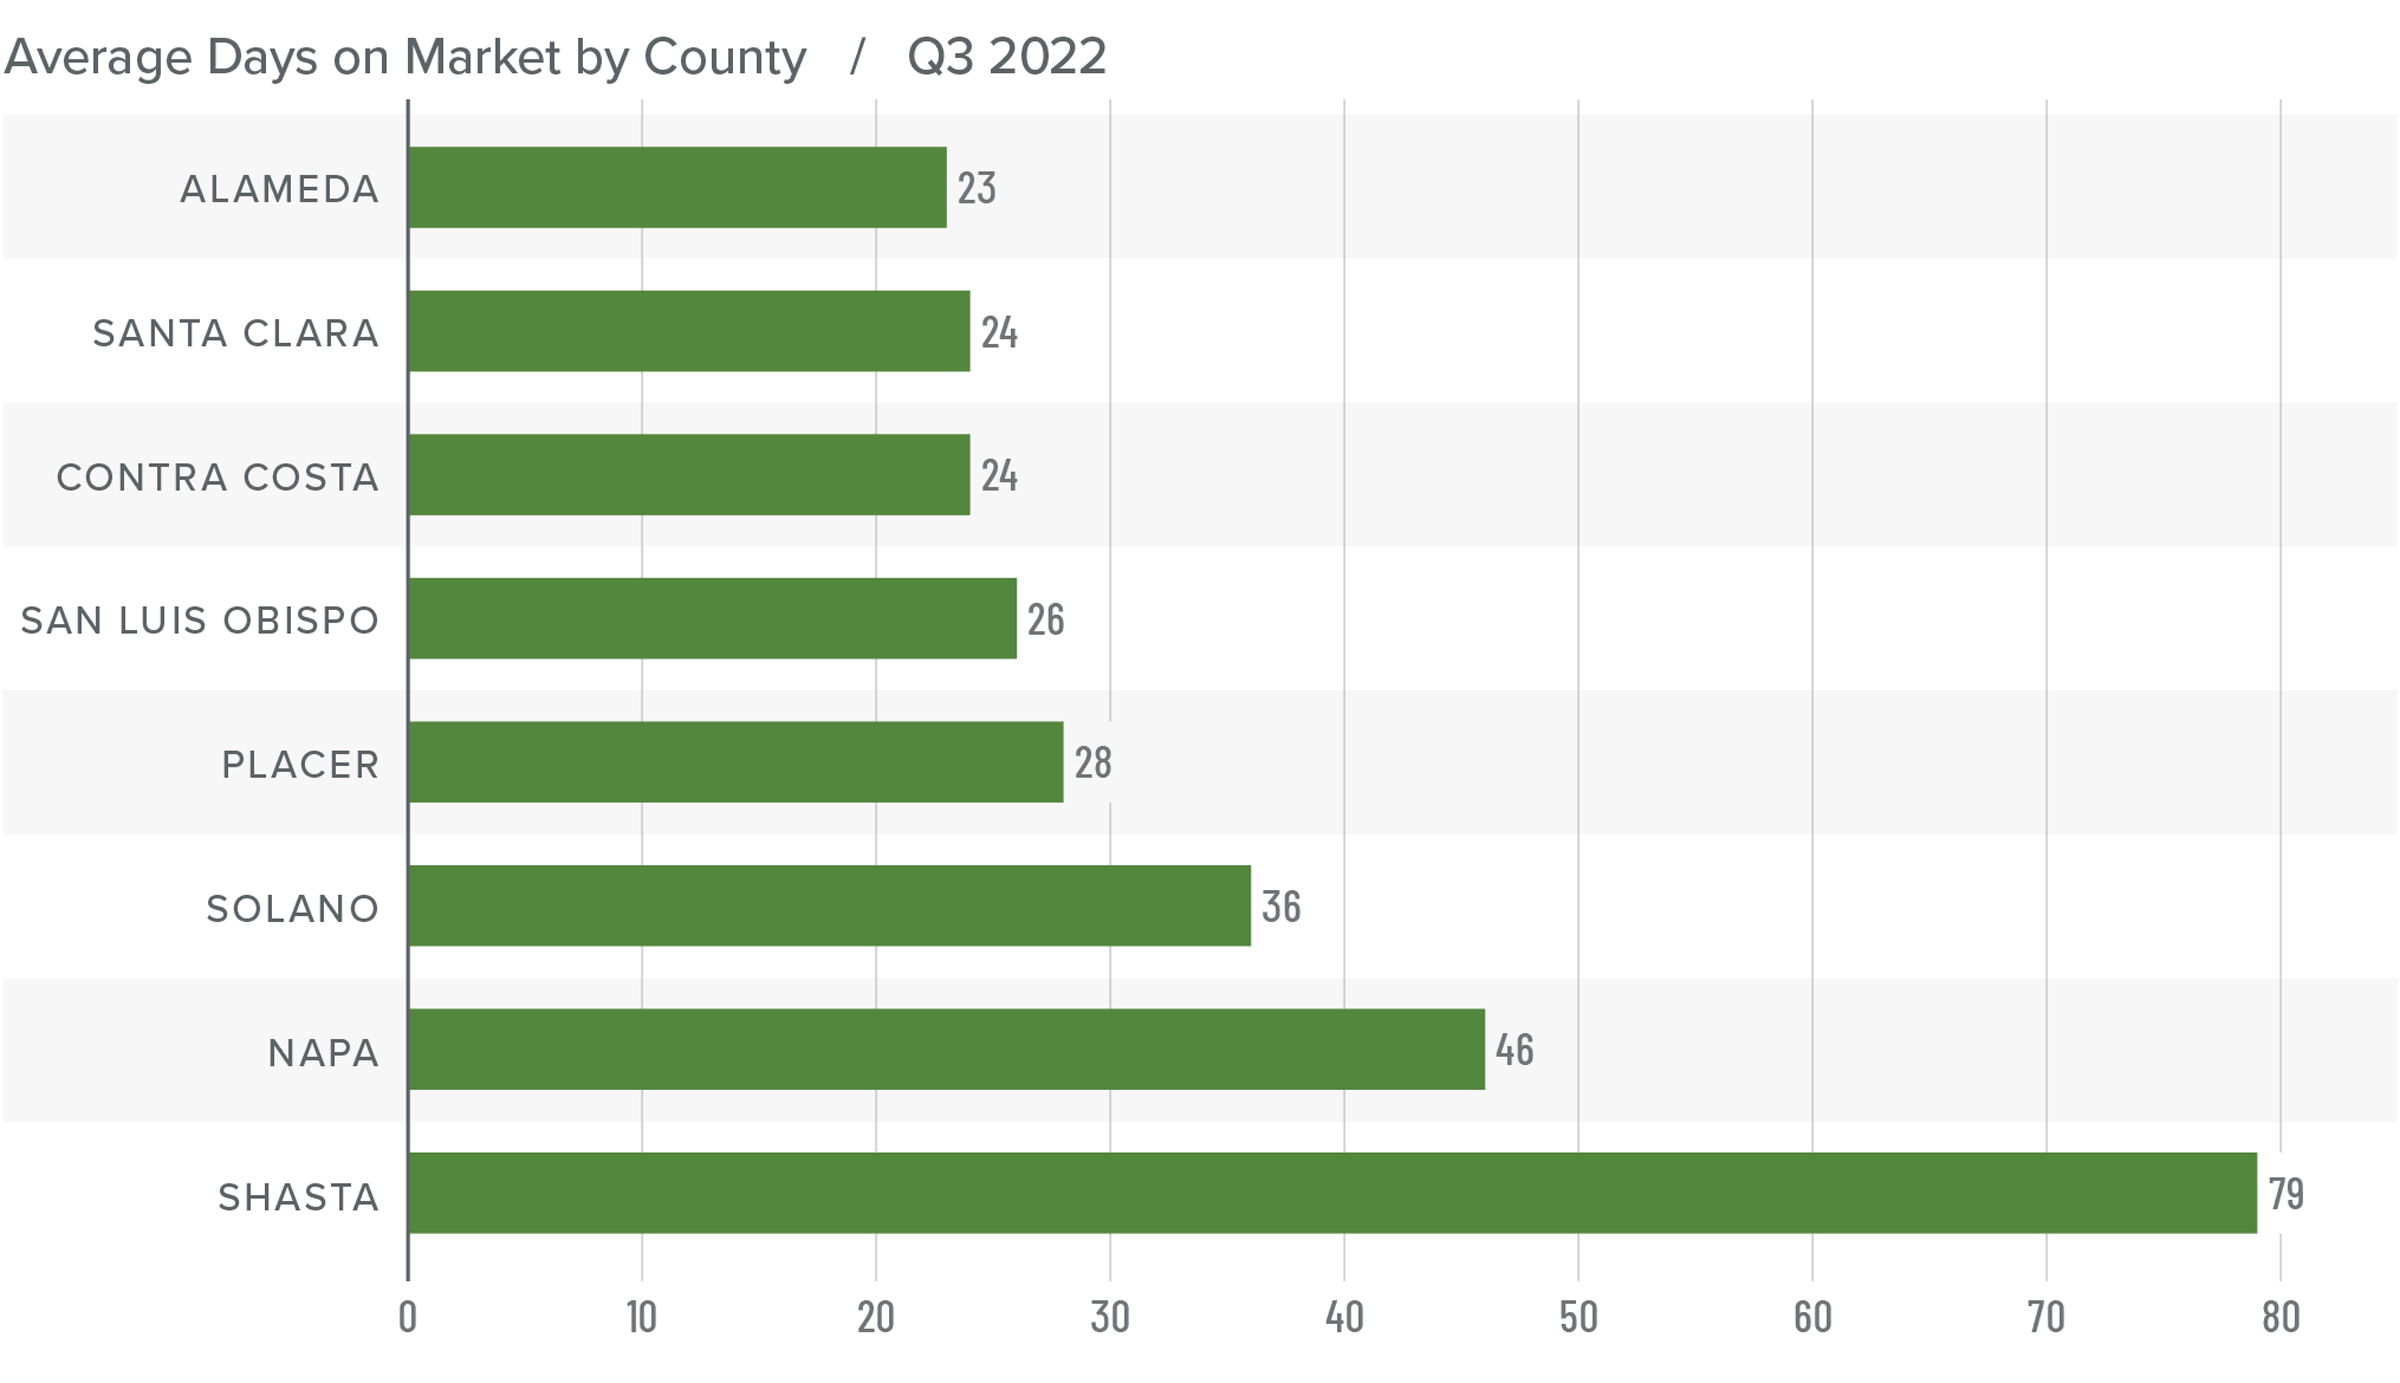
Northern California Days on Market
❱ The average time it took to sell a home in the Northern California counties in this report was seven days higher than it was in the third quarter of 2021.
❱ The length of time it took to sell a home fell in Napa County but rose across the rest of the region. Compared to the second quarter of 2022, market time rose across all counties except Placer, where it fell four days.
❱ During the third quarter, it took an average of 35 days to sell a home, which was 9 more days than in the second quarter of this year.
❱ The combination of more choice and very cautious buyers has led market time to increase.
Conclusions
This speedometer reflects the state of the region’s real estate market using housing inventory, price gains, home sales, interest rates, and larger economic factors.
Far higher financing costs in concert with very low affordability levels are now impacting the region’s housing market. Although there may be some pain as the market continues to revert to a normal pace of price growth and sales activity, I am not overly concerned about the long-term outlook. Home values are correcting, but the adjustment will not be severe, and certainly nothing like the plummet we saw following the bursting of the housing bubble.

I think there are more buyers than most people might expect who are waiting for prices to correct and, more importantly, for mortgage rates to stabilize. While the market is firmly in a period of transition, it still is not a traditional buyer’s market. That said, it’s also not one that gives sellers all the control. As such, I am moving the needle more in favor of buyers, but not so far as to suggest that the tide has completely turned.
About Matthew Gardner

As Chief Economist for Windermere Real Estate, Matthew Gardner is responsible for analyzing and interpreting economic data and its impact on the real estate market on both a local and national level. Matthew has over 30 years of professional experience both in the U.S. and U.K.
In addition to his day-to-day responsibilities, Matthew sits on the Washington State Governors Council of Economic Advisors; chairs the Board of Trustees at the Washington Center for Real Estate Research at the University of Washington; and is an Advisory Board Member at the Runstad Center for Real Estate Studies at the University of Washington where he also lectures in real estate economics.
")


