
 Facebook
 X
X
 Pinterest
 Copy Link

The following analysis of select counties of the Utah real estate market is provided by Windermere Real Estate Chief Economist Matthew Gardner. We hope that this information may assist you with making better-informed real estate decisions. For further information about the housing market in your area, please don’t hesitate to contact your Windermere Real Estate agent.
Regional Economic Overview
Utah’s economy continues to add jobs. The 53,600 jobs created statewide over the past year represent a growth rate of 3.3%. The counties covered by this report added more than 40,000 new jobs over the past year, which is a growth rate of 3%. The state’s unemployment rate in August was 2%, which is marginally above the all-time low of 1.9% reported in April of this year. The labor force continues to expand, suggesting that the region expects economic growth to remain strong. Even though the state has seen a modest decline in the pace of job growth, the numbers are still very impressive.
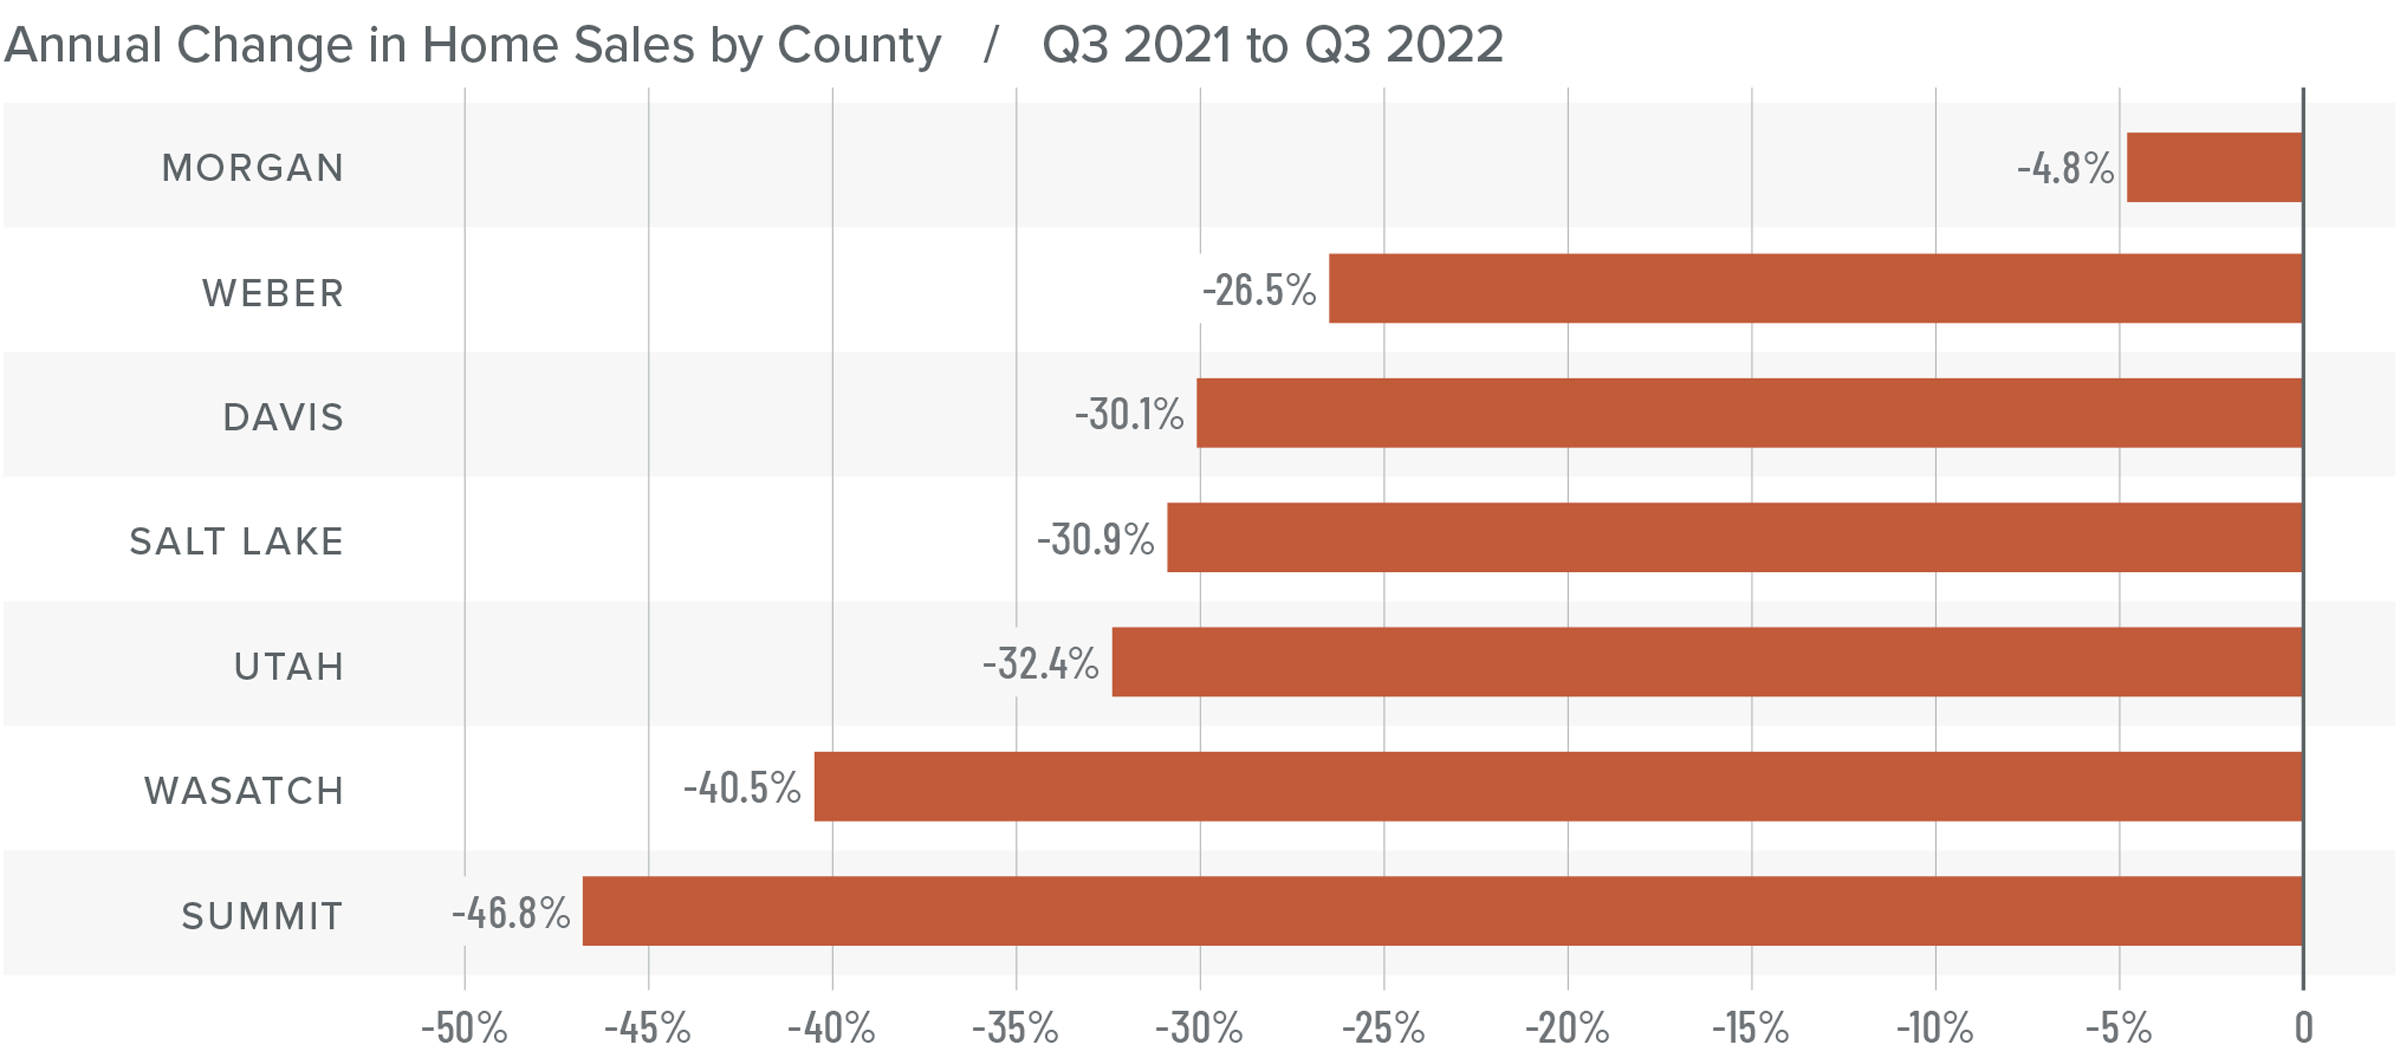
Utah Home Sales
❱ In the third quarter, 7,134 homes sold. This was 31.6% fewer sales than a year ago and down 16.1% compared to the second quarter of this year.
❱ Year over year, sales fell across the board. Sales in all markets covered by this report were lower than in the second quarter of 2022 as well.
❱ Inventory levels continue to grow, with the average number of homes for sale in the quarter 149% higher than a year ago and up 79% from the second quarter of this year.
❱ Buyers, who seemed to ignore rising mortgage rates in the second quarter, are now feeling the impact of higher financing costs and have taken a pause.
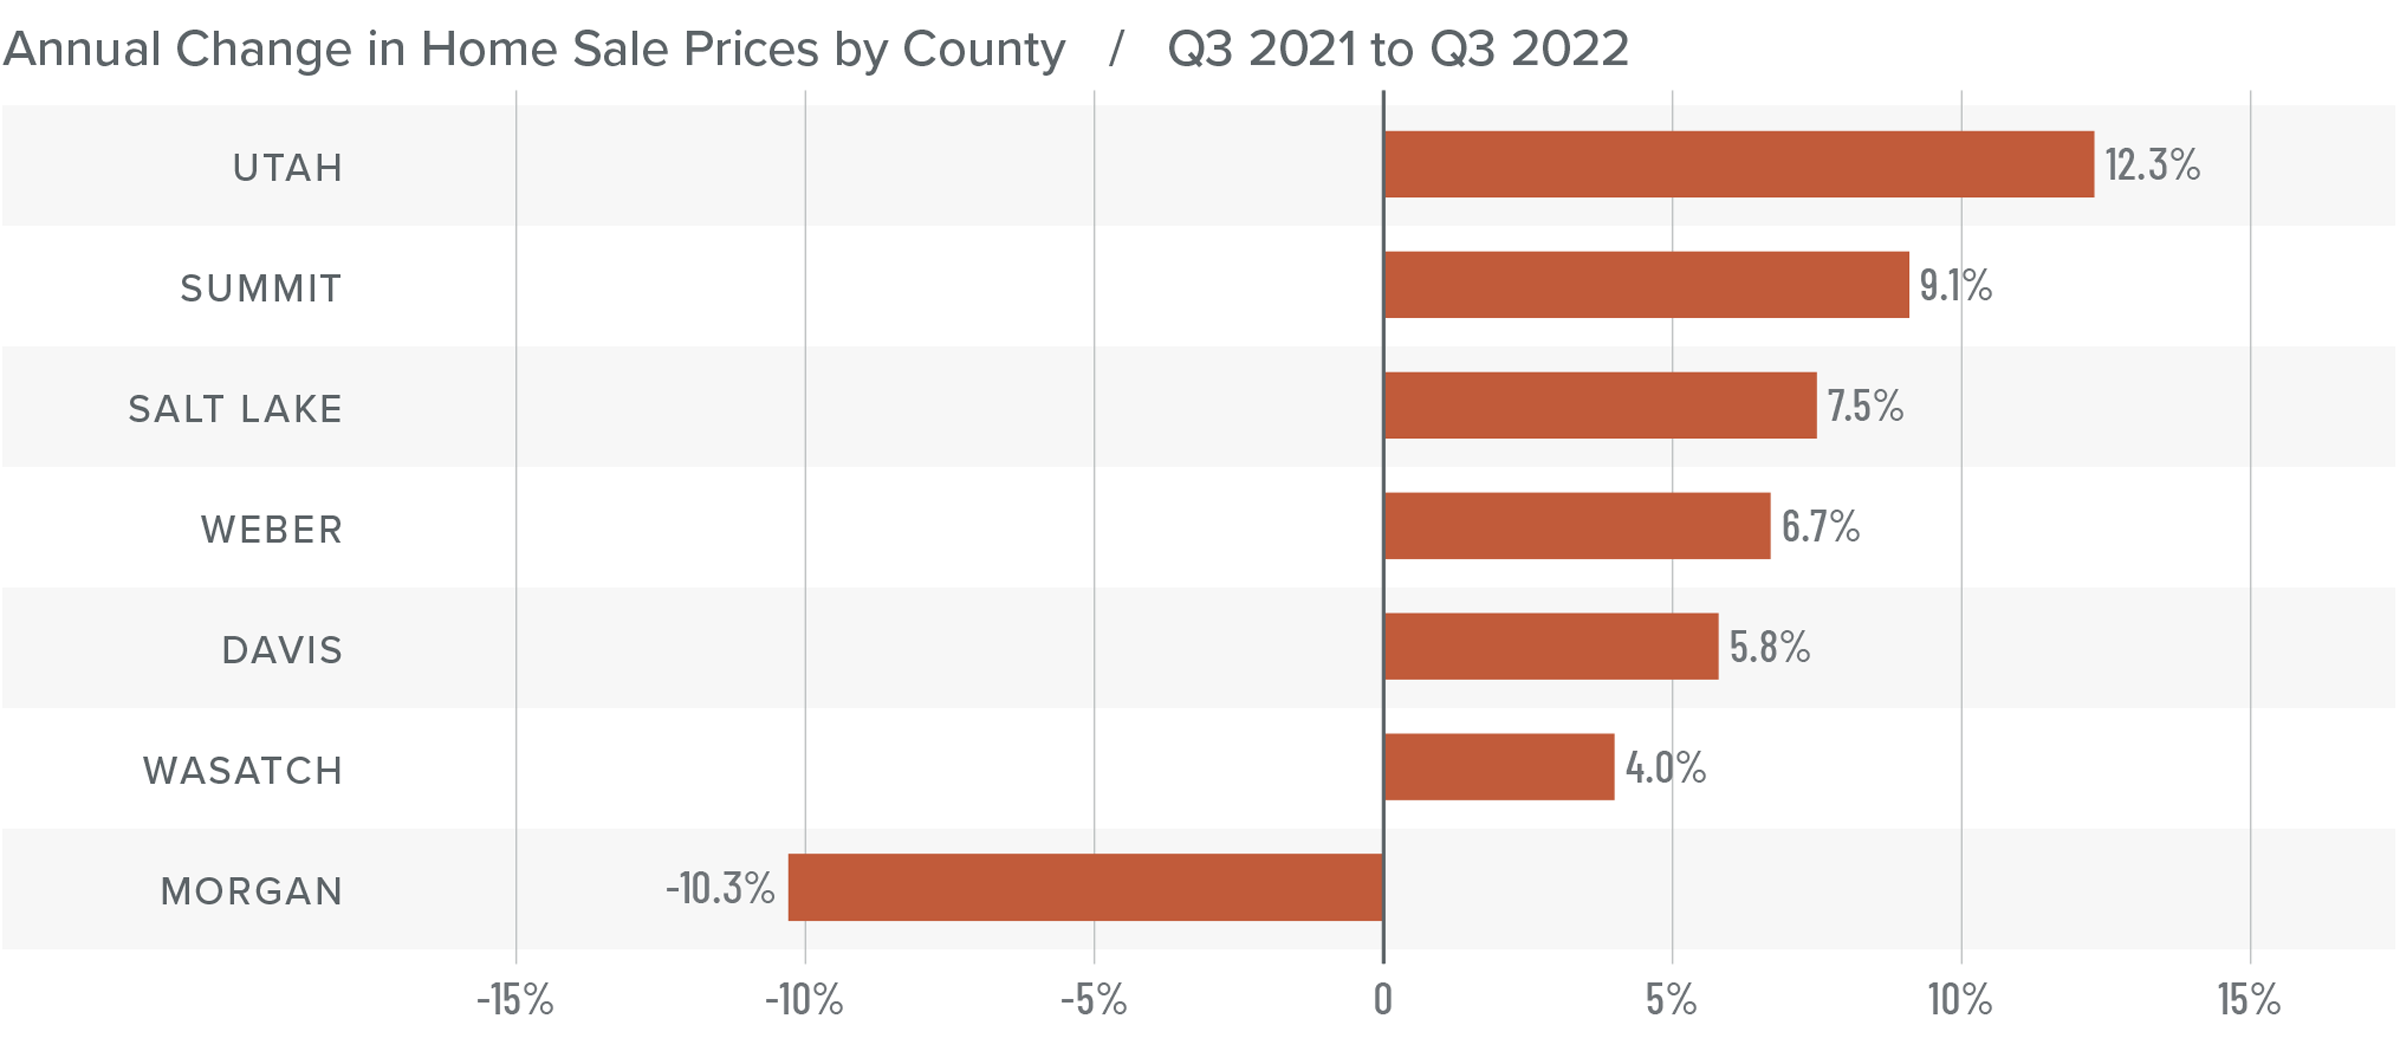
Utah Home Prices
❱ The average home sale price in the third quarter was up 5.9% from a year ago to $627,503. However, prices fell 5.7% compared to the second quarter of this year.
❱ Median listing prices in the third quarter were down across the board. Sellers appear to be coming to terms with the fact that the remarkably buoyant market we’ve experienced since the start of the pandemic has now ended.
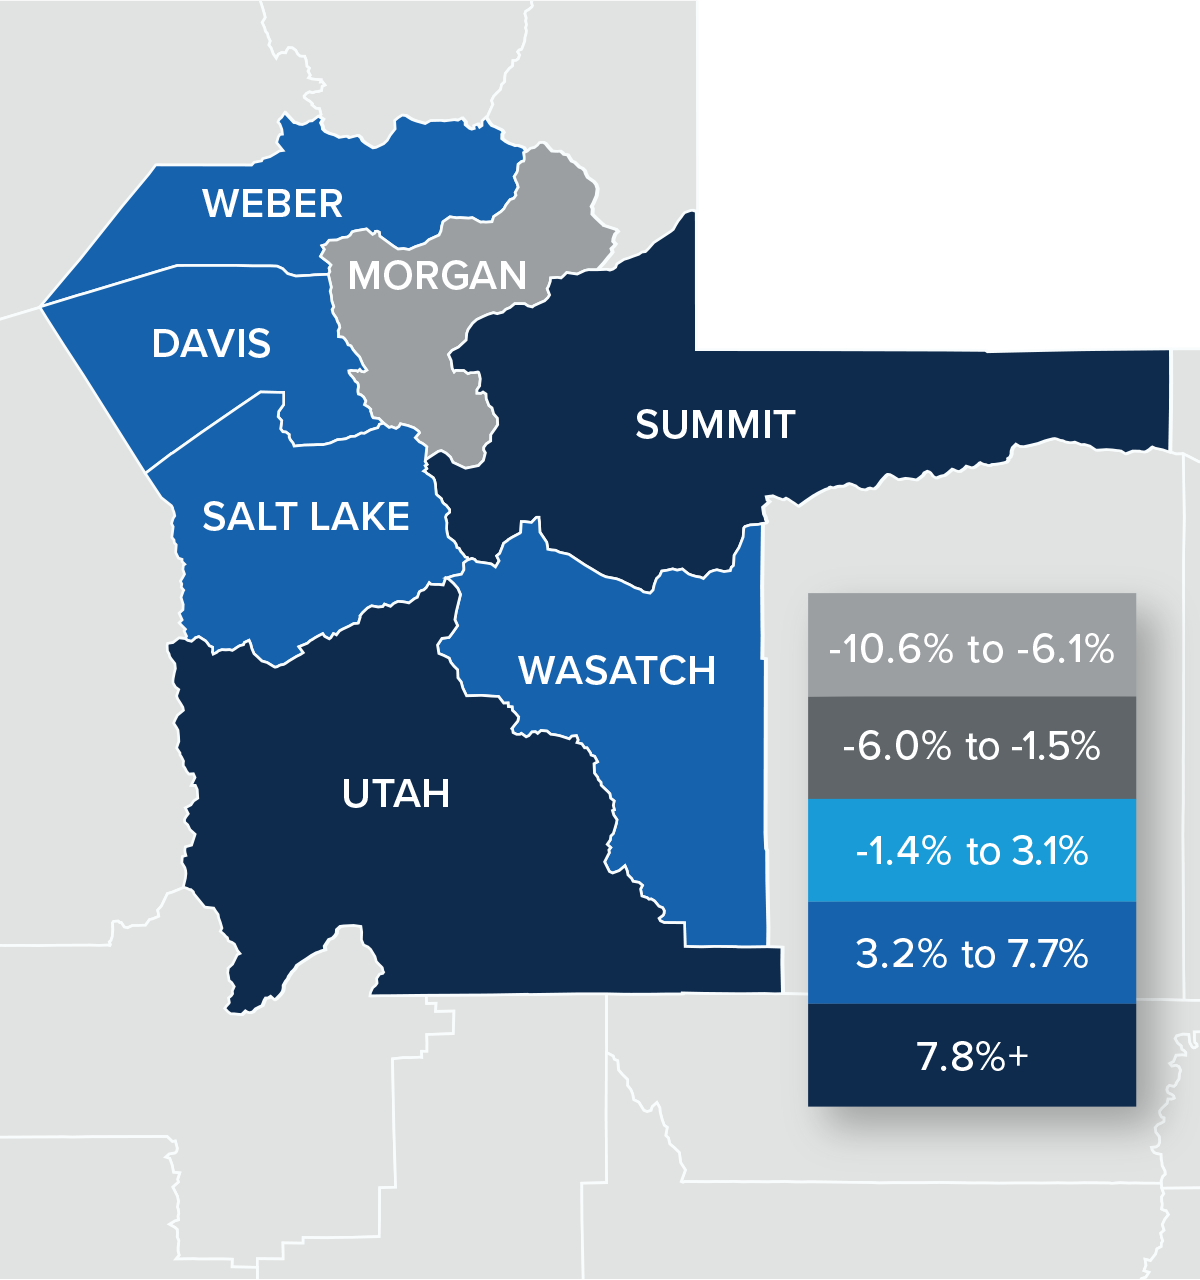
❱ All areas contained in this report except Morgan County had higher sale prices than a year ago. Compared to the second quarter of this year, only Wasatch County had higher sale prices.
❱ Although the data suggests that a market correction has started, I don’t find this terribly troubling. Homeowners have seen a remarkable run-up in home values over the past couple of years. It was only a matter of time before the market reverted back to a more sustainable pace of price growth.
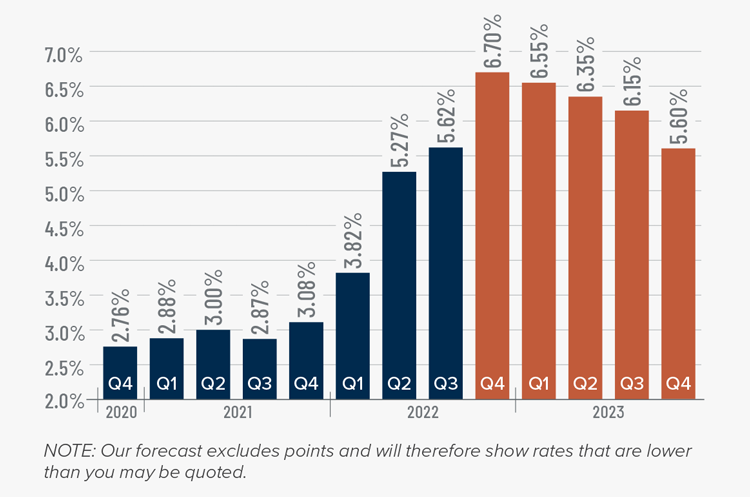
Mortgage Rates
This remains an uncertain period for mortgage rates. When the Federal Reserve slowed bond purchases in 2013, investors were accused of having a “taper tantrum,” and we are seeing a similar reaction today. The Fed appears to be content to watch the housing market go through a period of pain as they throw all their tools at reducing inflation.
As a result, mortgage rates are out of sync with treasury yields, which not only continues to push rates much higher, but also creates violent swings in both directions. My current forecast calls for rates to peak in the fourth quarter of this year before starting to slowly pull back. That said, they will remain in the 6% range until the end of 2023.
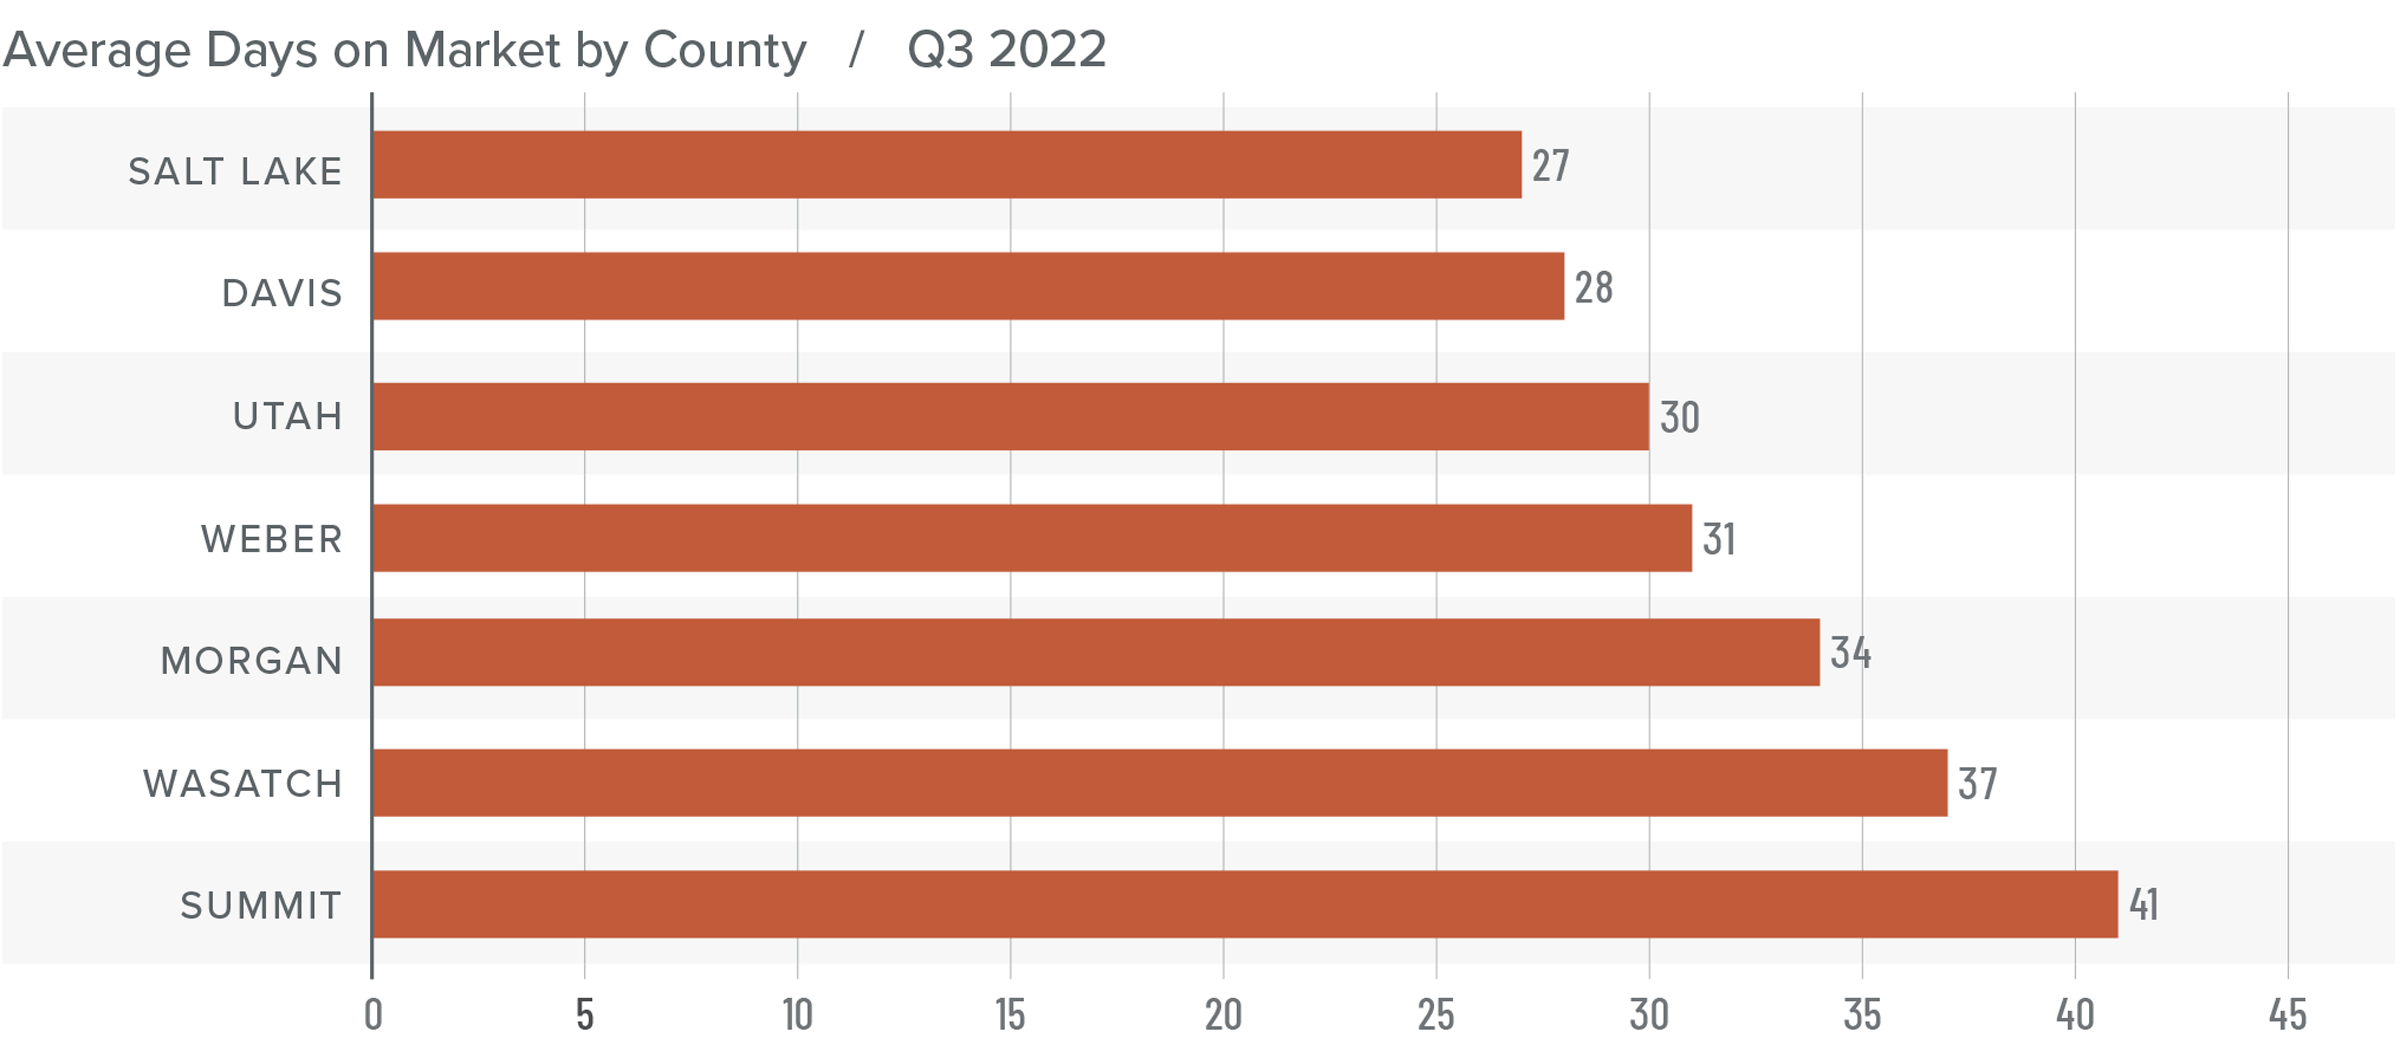
Utah Days on Market
❱ The average number of days it took to sell a home in the counties covered by this report rose ten days compared to the same period a year ago.
❱ Though homes sold fastest in Salt Lake County, average market time rose in all counties covered by this report year over year. Days on market was also higher in every county compared to the second quarter of this year.
❱ During the quarter, it took an average of 33 days to sell a home in the region. Market time rose 15 days compared to the second quarter of 2022.
❱ Rapidly rising inventory levels and mortgage rates have put the brakes on the Utah housing market.
Conclusions
This speedometer reflects the state of the region’s real estate market using housing inventory, price gains, home sales, interest rates, and larger economic factors.
Although Utah’s economy remains strong, the housing market is now feeling the effects of mortgage rates that were 2.7% higher than in the third quarter of 2021. With rates expected to rise even more in the fourth quarter before hopefully levelling off in early 2023, I anticipate that prices will decline further from their current levels. While this may seem like a dire situation to some, homeowners have seen their equity leap since the pandemic started. Though the expected drop in home values may be disconcerting for owners, it’s necessary for the market to return to more realistic conditions. I expect that some would-be sellers will decide to wait until the market stabilizes before listing their homes, while others will decide not to sell at all. This will limit how far inventory levels will rise. As such, I don’t see the market reaching saturation.
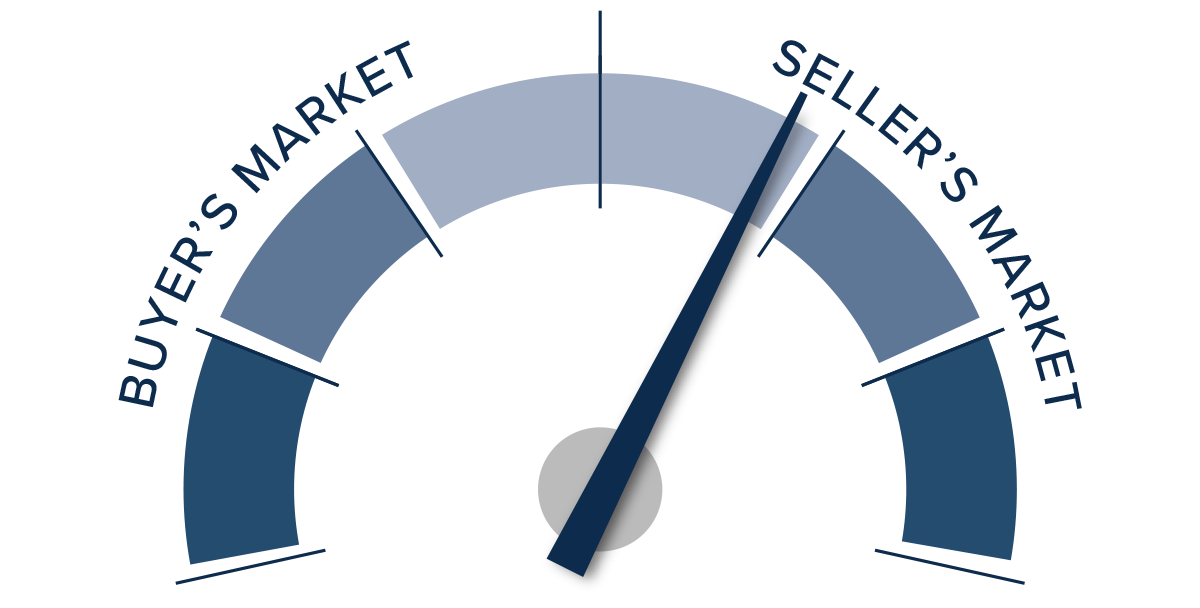
The Utah housing market is in a period of reversion that will bring it back to balance, which is actually positive for the long-term health of the market. Buyers have more choice, but many will wait until financing costs and the market start to stabilize before they resume their search for a home. We still aren’t in a buyer’s market, but we are certainly getting closer to balance. As such, I have moved the needle far closer to the middle.
About Matthew Gardner

As Chief Economist for Windermere Real Estate, Matthew Gardner is responsible for analyzing and interpreting economic data and its impact on the real estate market on both a local and national level. Matthew has over 30 years of professional experience both in the U.S. and U.K.
In addition to his day-to-day responsibilities, Matthew sits on the Washington State Governors Council of Economic Advisors; chairs the Board of Trustees at the Washington Center for Real Estate Research at the University of Washington; and is an Advisory Board Member at the Runstad Center for Real Estate Studies at the University of Washington where he also lectures in real estate economics.
")


