
 Facebook
 X
X
 Pinterest
 Copy Link

The following analysis of select counties of the Montana real estate market is provided by Windermere Real Estate Chief Economist Matthew Gardner. We hope that this information may assist you with making better-informed real estate decisions. For further information about the housing market in your area, please don’t hesitate to contact your Windermere Real Estate agent.
Regional Economic Overview
Though employment growth in Montana continues to taper, the addition of 11,500 new jobs over the past year is solid. All metro areas in the region continue to add jobs. Missoula was the standout, having added 1,900 new jobs during the past quarter. The state unemployment rate in August was 2.8%; this is up from 2.6% at the end of the second quarter and is mainly due to the growing labor force. In the metro areas covered in this report, the lowest jobless rate was in Billings at 2.6%, followed by Missoula at 2.7%, and Great Falls at 2.9%. The labor force participation rate (which is the civilian population divided by the labor force) has risen marginally to 62.7%, which is still very close to the all-time low. This means businesses will still have a difficult time finding workers.
Montana Home Sales
❱ In the third quarter of this year, 2,023 homes sold in the markets contained in this report, which is a 7.9% decline from a year ago. Sales activity fell 14.3% compared to the second quarter of this year.
❱ The number of homes for sale was 17.5% higher than a year ago and a remarkable 75.7% higher than in the second quarter. Sellers appear to still be confident in the market.
❱ Year over year, sales grew in Ravalli County but fell in the balance of the markets included in this report. Sales grew in Missoula, Ravalli, and Lake counties from the second quarter but fell in all other markets.
❱ Seller confidence was supported by the fact that pending sales rose 34.4% from the second quarter, which is a very significant improvement and is likely a result of there being considerably more choice in the market.

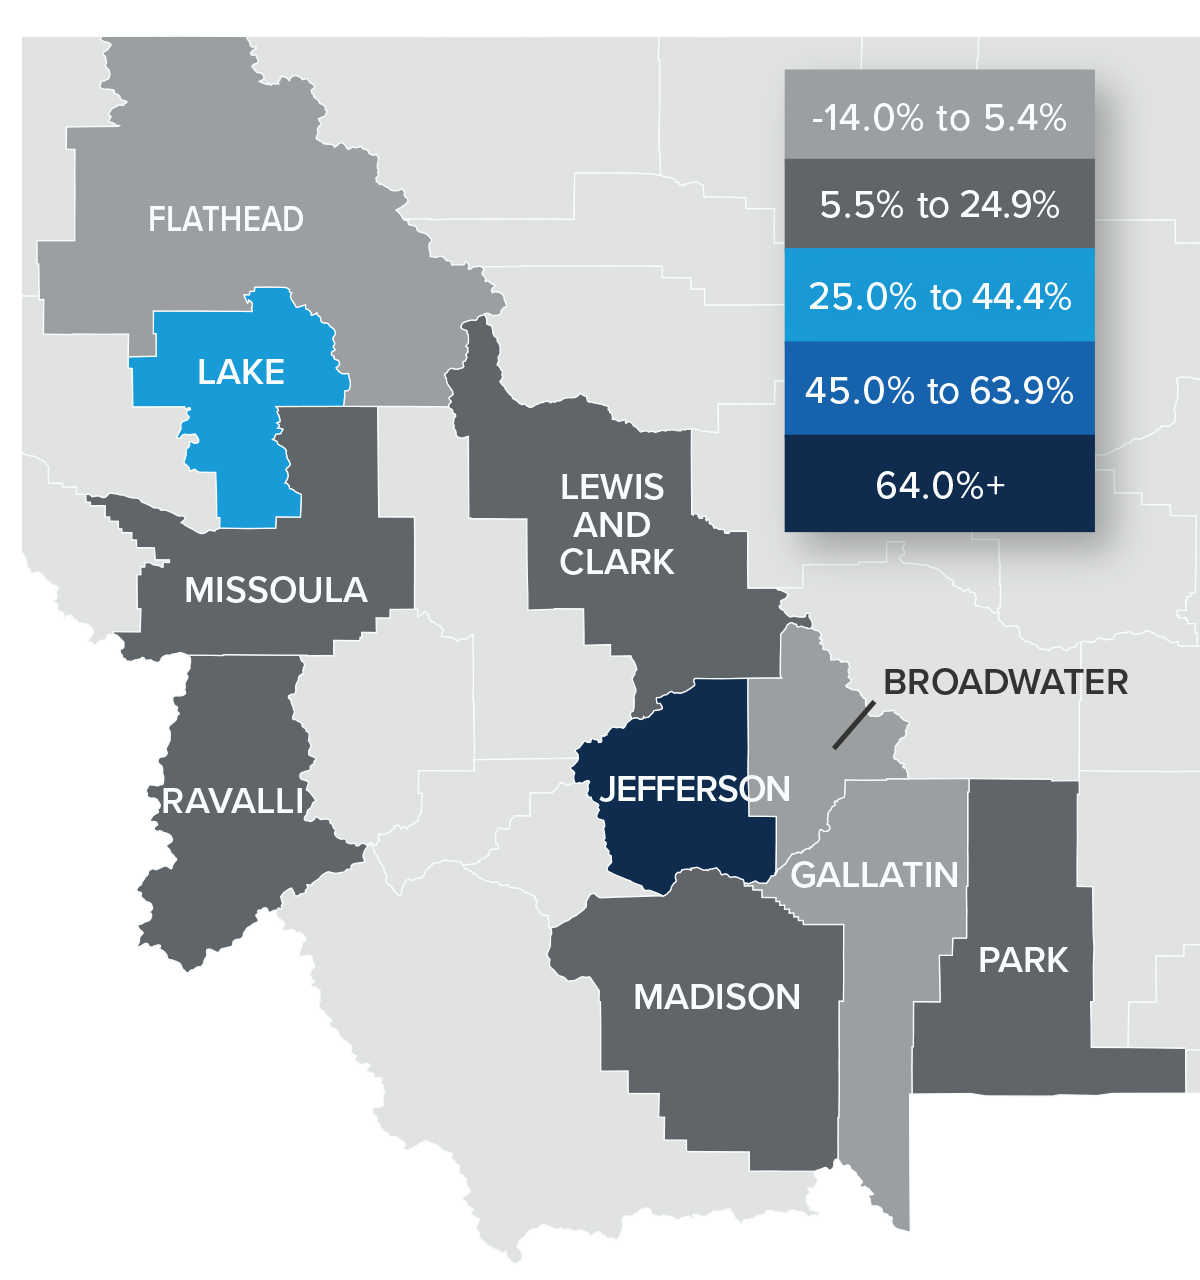
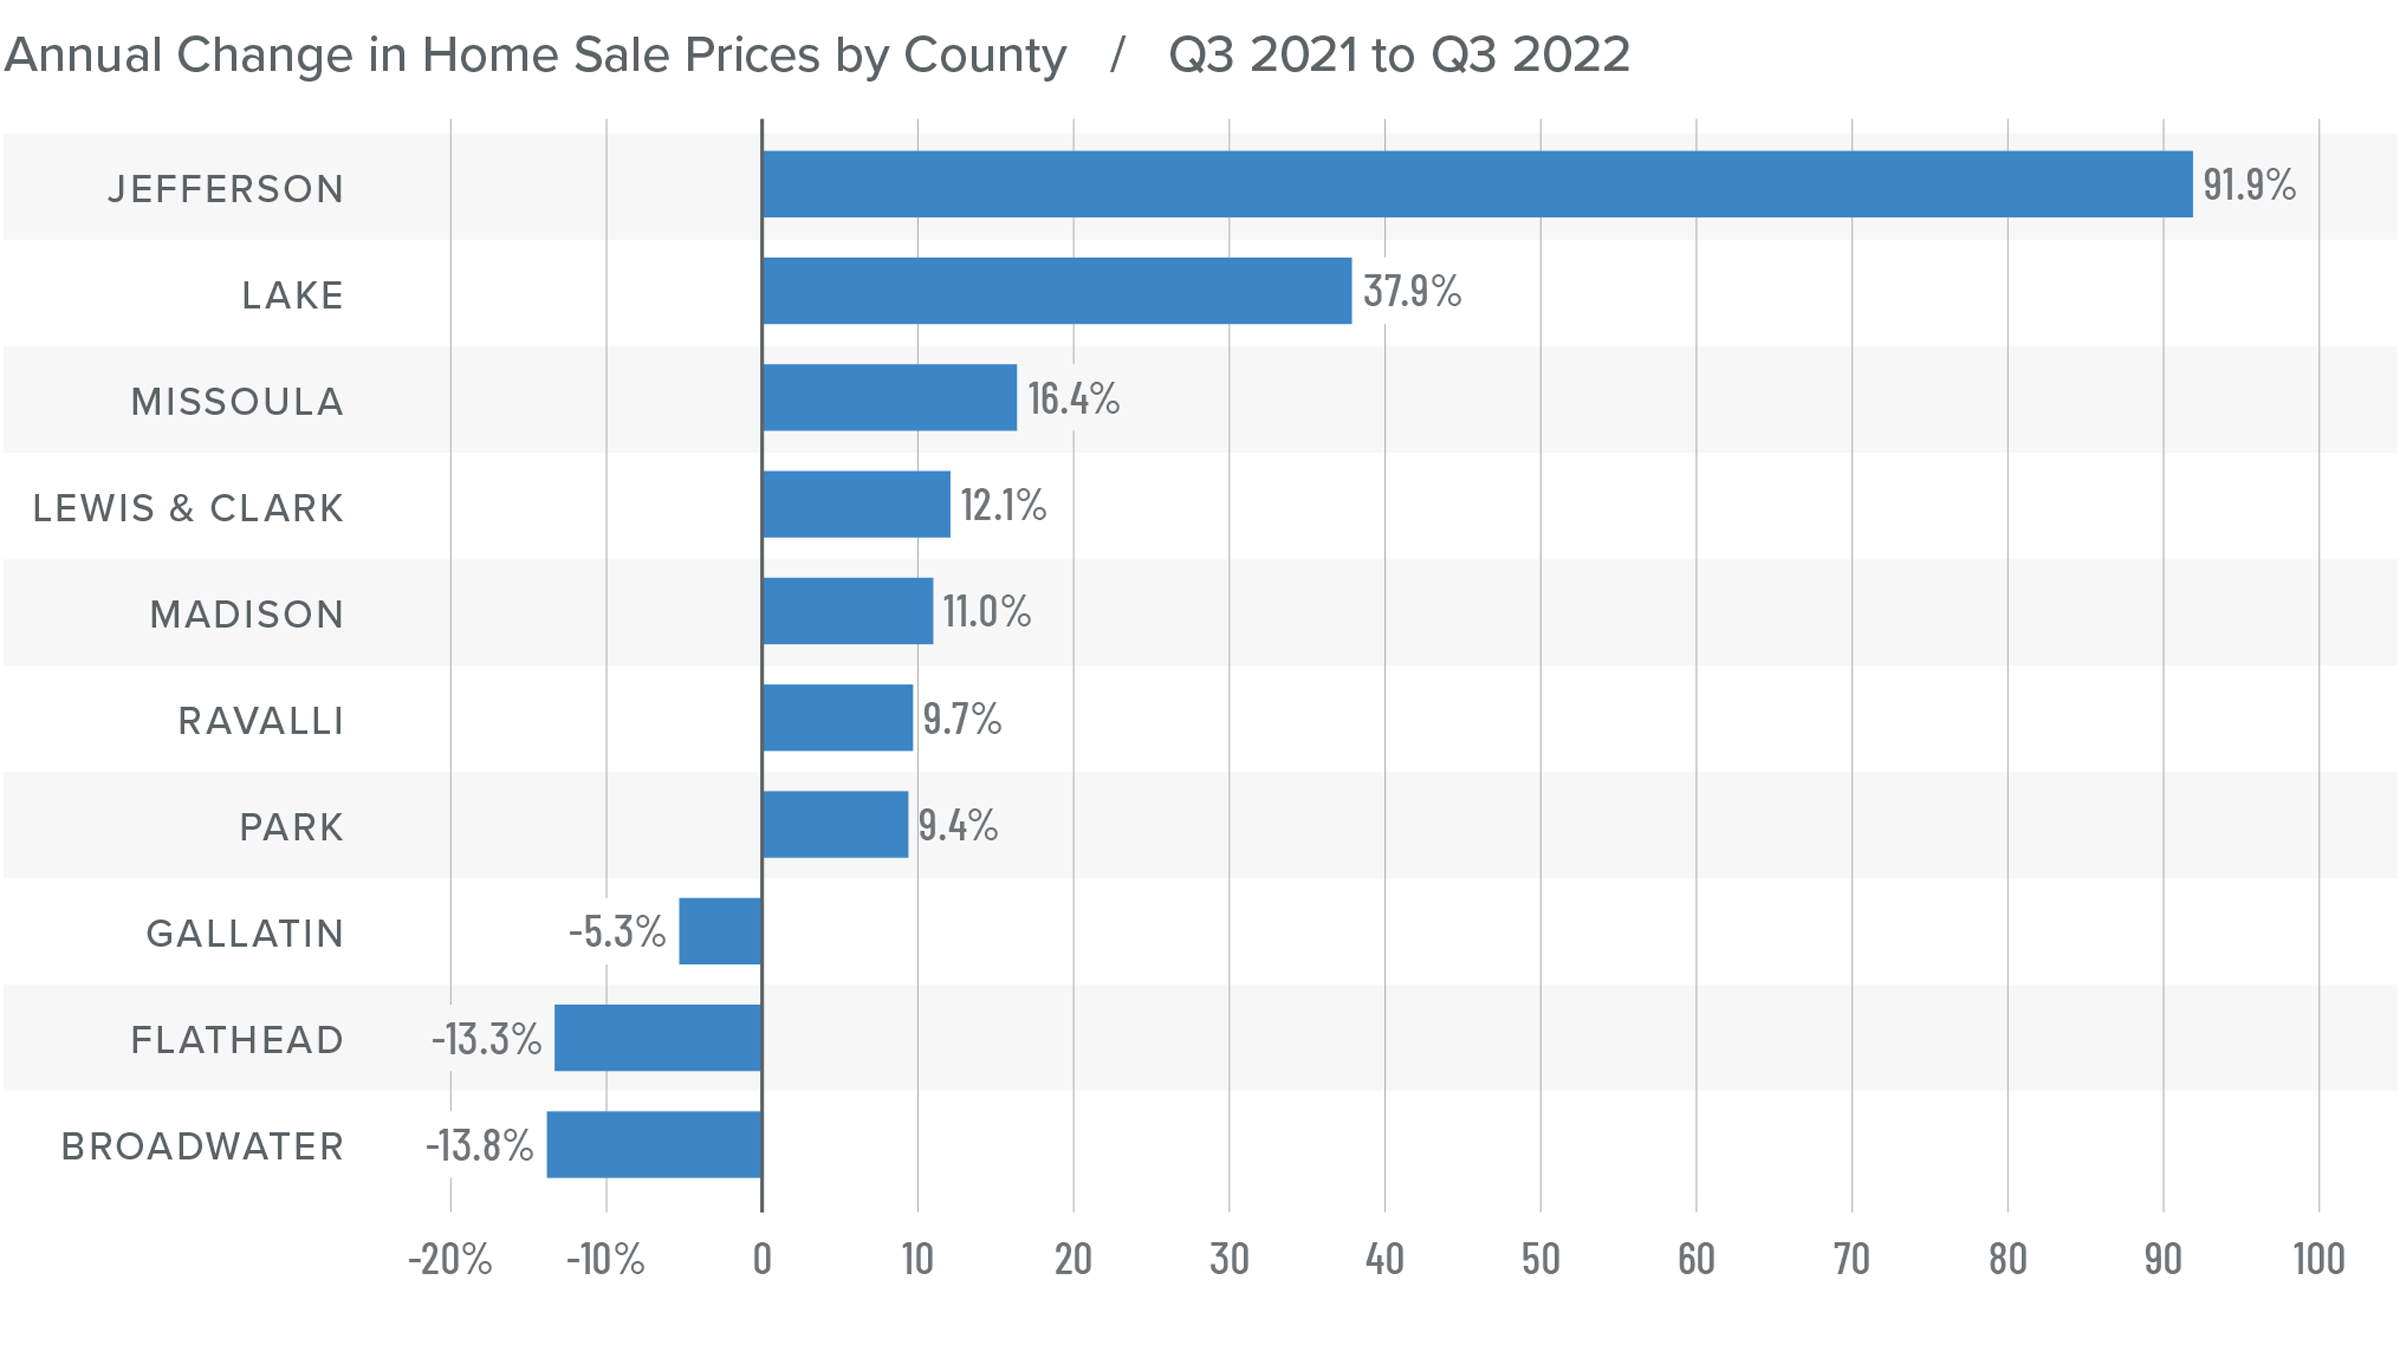
Montana Home Prices
❱ Home prices were flat year over year, with the average sale price coming in at $709,013. Prices were .2% lower than in the second quarter of 2021.
❱ Price growth will likely remain flat for the balance of 2022 and into 2023 as buyers and sellers react to mortgage rates that are higher than they’ve seen in a long time. That said, even with more expensive financing costs and higher inventory levels, I do not expect home prices in Montana to turn negative in 2023.
❱ With pending sales up significantly but home prices essentially flat, the numbers are somewhat unusual until you note that the median listing price fell .8% from the second quarter. Home sellers are reacting to a market with more competition and are now having to price their homes more competitively.
❱ Sellers who price their homes realistically are still finding buyers—even with more competition than they’ve seen in several years.
Mortgage Rates
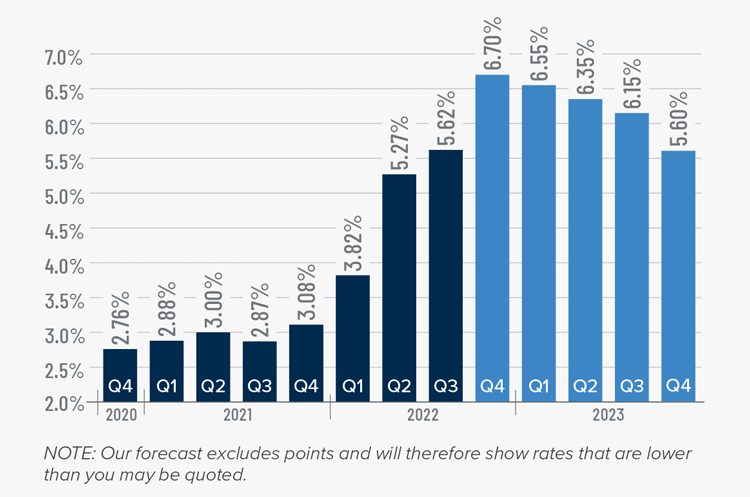
This remains an uncertain period for mortgage rates. When the Federal Reserve slowed bond purchases in 2013, investors were accused of having a “taper tantrum,” and we are seeing a similar reaction today. The Fed appears to be content to watch the housing market go through a period of pain as they throw all their tools at reducing inflation.
As a result, mortgage rates are out of sync with treasury yields, which not only continues to push rates much higher, but also creates violent swings in both directions. My current forecast calls for rates to peak in the fourth quarter of this year before starting to slowly pull back. That said, they will remain in the 6% range until the end of 2023.
Montana Days on Market
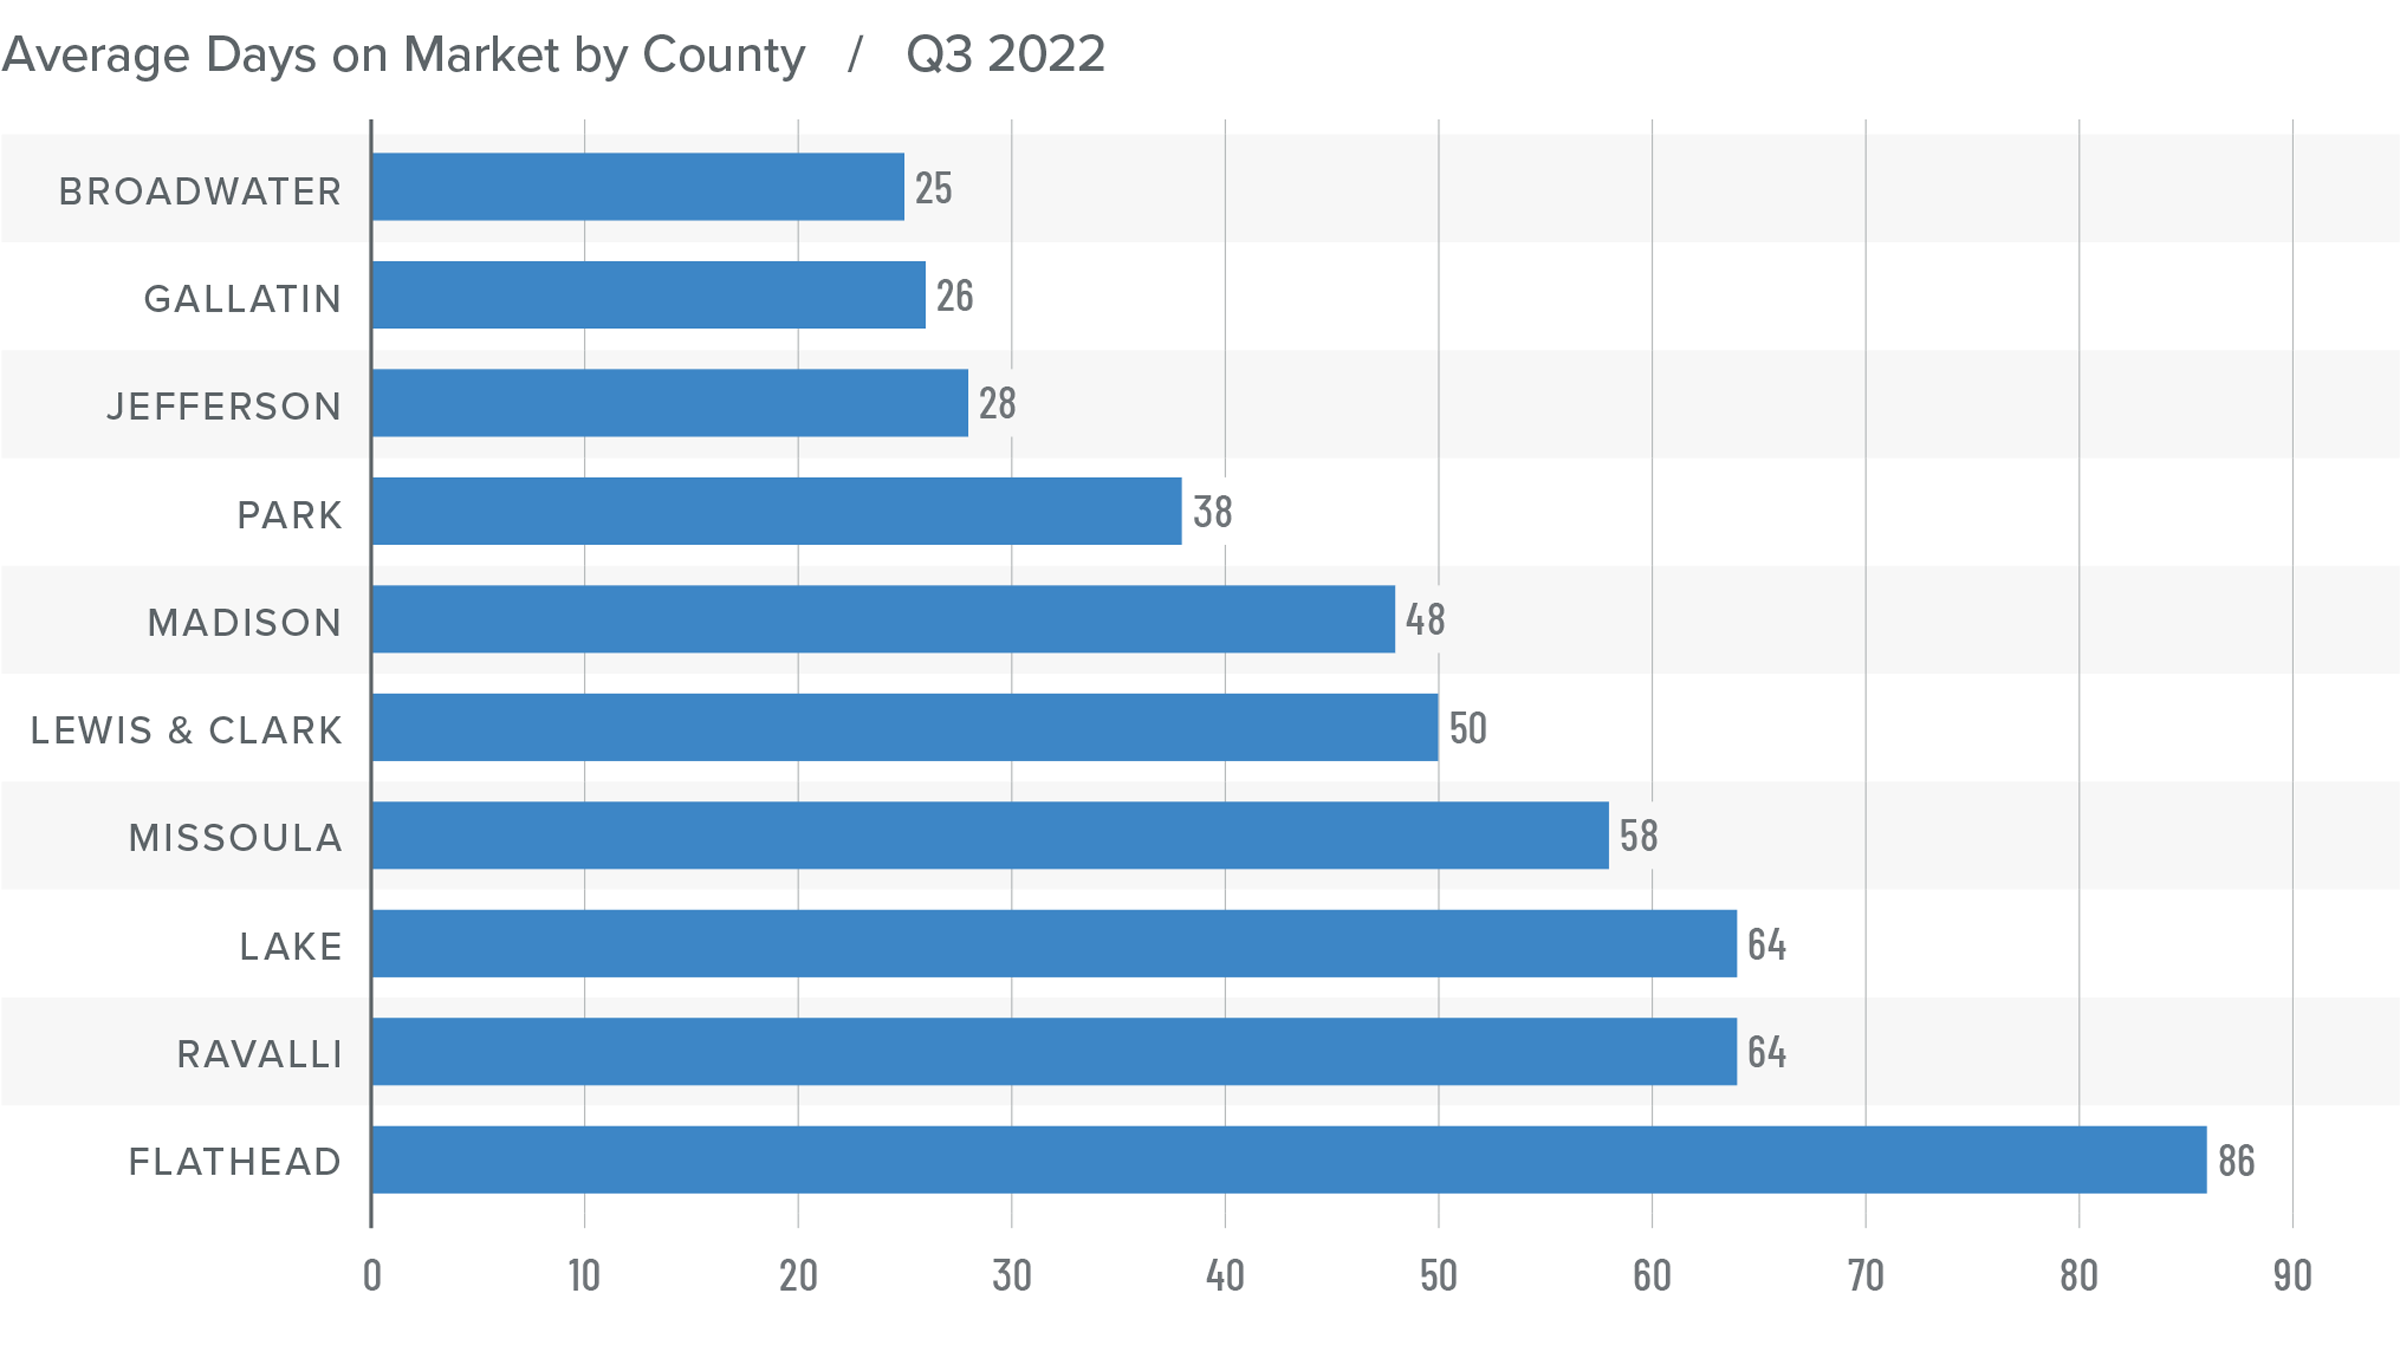
❱ The average time it took to sell a home fell eight days compared to the same period a year ago.
❱ Homes sold fastest in Broadwater County, while homes in Flathead County took the longest to sell. Jefferson, Gallatin, Park, and Madison counties saw market time rise compared to a year ago. Average market time in the rest of the region dropped.
❱ During the third quarter, it took an average of 49 days to sell a home in the markets covered by this report.
❱ In comparison to the second quarter of 2022, average market time fell in all counties other than Park (+17 days), Lake (+12 days), Gallatin (+11 days), and Madison (+6 days).
Conclusions
This speedometer reflects the state of the region’s real estate market using housing inventory, price gains, home sales, interest rates, and larger economic factors.
The Montana housing market has started to react to mortgage rates that have essentially doubled since the start of 2022. Sellers are having to adjust to higher inventory levels, more expensive financing costs, and increased competition by making sure their asking price is realistic. These adjustments should favor buyers—and they do. I see a trend back toward a more balanced market, but one that is still far from being a traditional buyer’s market.

Therefore, I am moving the needle more toward the middle, but not so much as to suggest that buyers are now in the driver’s seat.
About Matthew Gardner

As Chief Economist for Windermere Real Estate, Matthew Gardner is responsible for analyzing and interpreting economic data and its impact on the real estate market on both a local and national level. Matthew has over 30 years of professional experience both in the U.S. and U.K.
In addition to his day-to-day responsibilities, Matthew sits on the Washington State Governors Council of Economic Advisors; chairs the Board of Trustees at the Washington Center for Real Estate Research at the University of Washington; and is an Advisory Board Member at the Runstad Center for Real Estate Studies at the University of Washington where he also lectures in real estate economics.
")


