
 Facebook
 X
X
 Pinterest
 Copy Link

The following analysis of the greater Las Vegas real estate market is provided by Windermere Real Estate Chief Economist Matthew Gardner. We hope that this information may assist you with making better-informed real estate decisions. For further information about the housing market in your area, please don’t hesitate to contact your Windermere Real Estate agent.
Regional Economic Overview
After two long years, I can now announce that all the jobs in the Las Vegas metro area that were lost because of the pandemic have returned. Employment levels are now 7,800 jobs above the pre-pandemic peak. With the job market continuing to strengthen, the number of people who have started to look for work has increased. This has led the unemployment rate to rise to 5.7%.
Nevada Home Sales
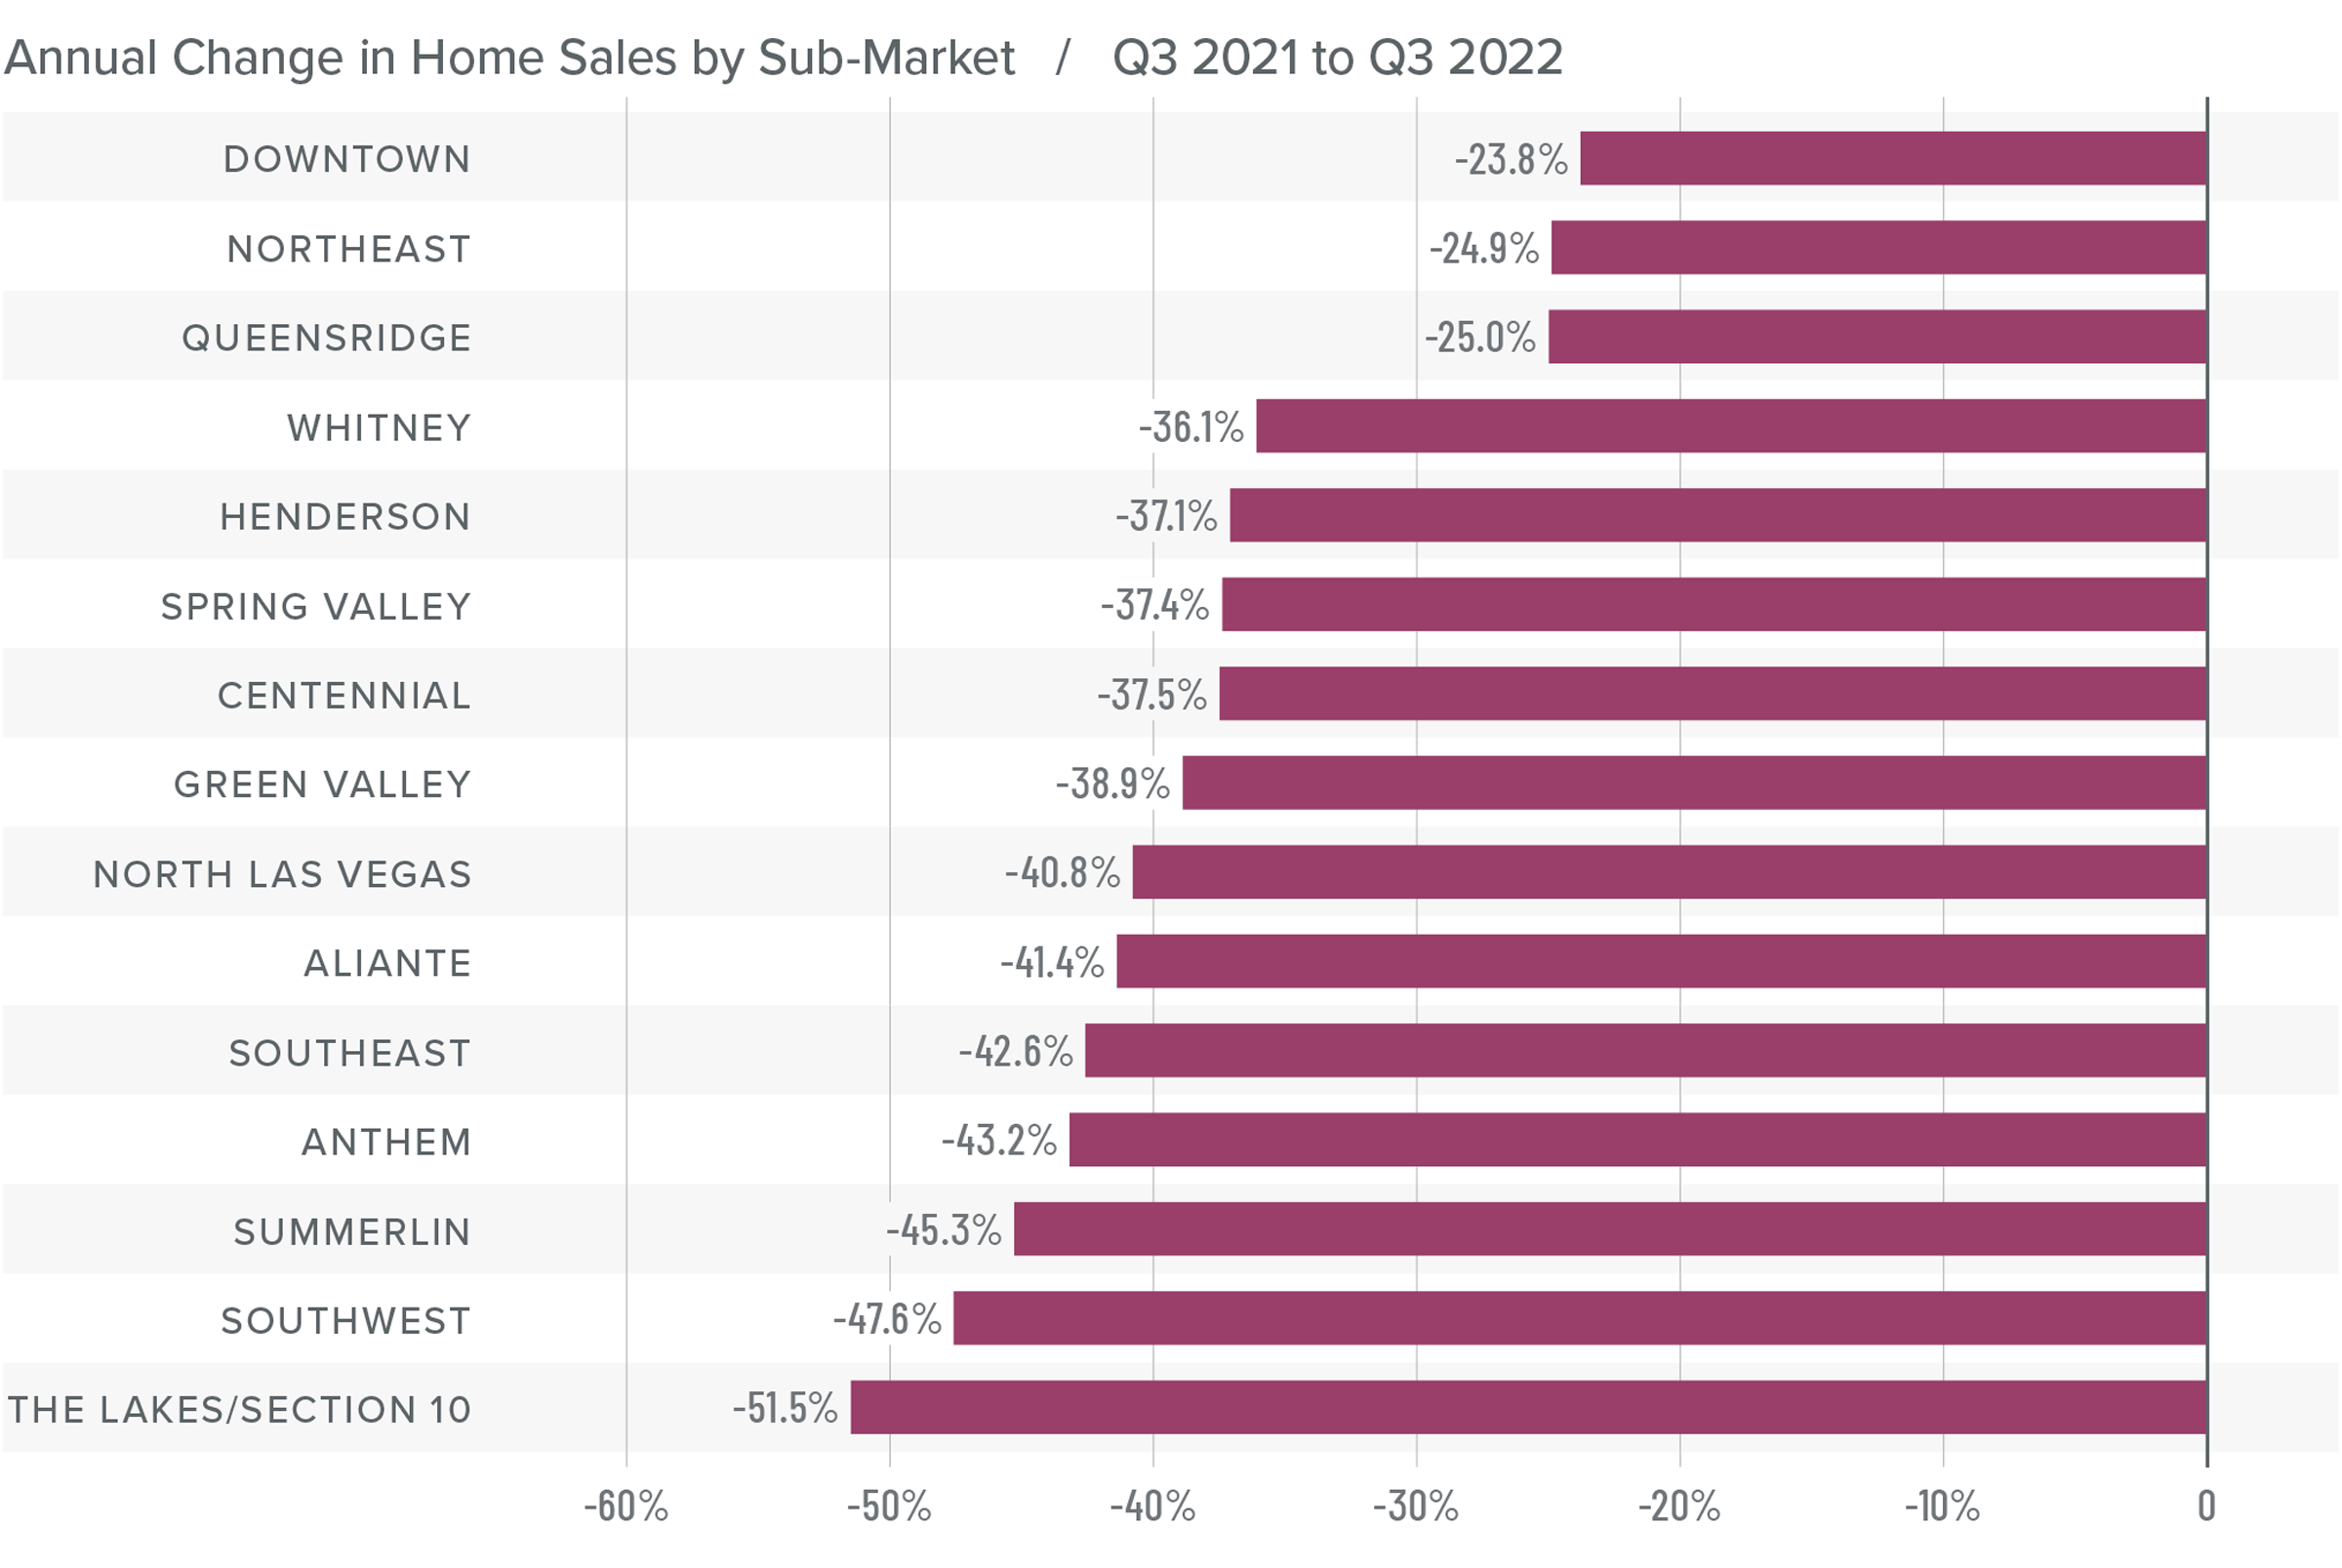
❱ A total of 6,533 homes sold in the third quarter, which was a drop of 39.8% compared to the same period a year ago, and 30.2% lower than in the second quarter of this year.
❱ Sales fell in every neighborhood covered by this report compared to a year ago, and all areas reported fewer sales than in the second quarter of 2022.
❱ Listing activity continues to grow significantly, with the number of homes for sale up 130% year over year and up 97.2% from the second quarter.
❱ Pending sales, which are an indicator of future closings, fell 27.6% compared to the second quarter, suggesting that the market may see sales fall further in the final quarter of this year.
Nevada Home Prices
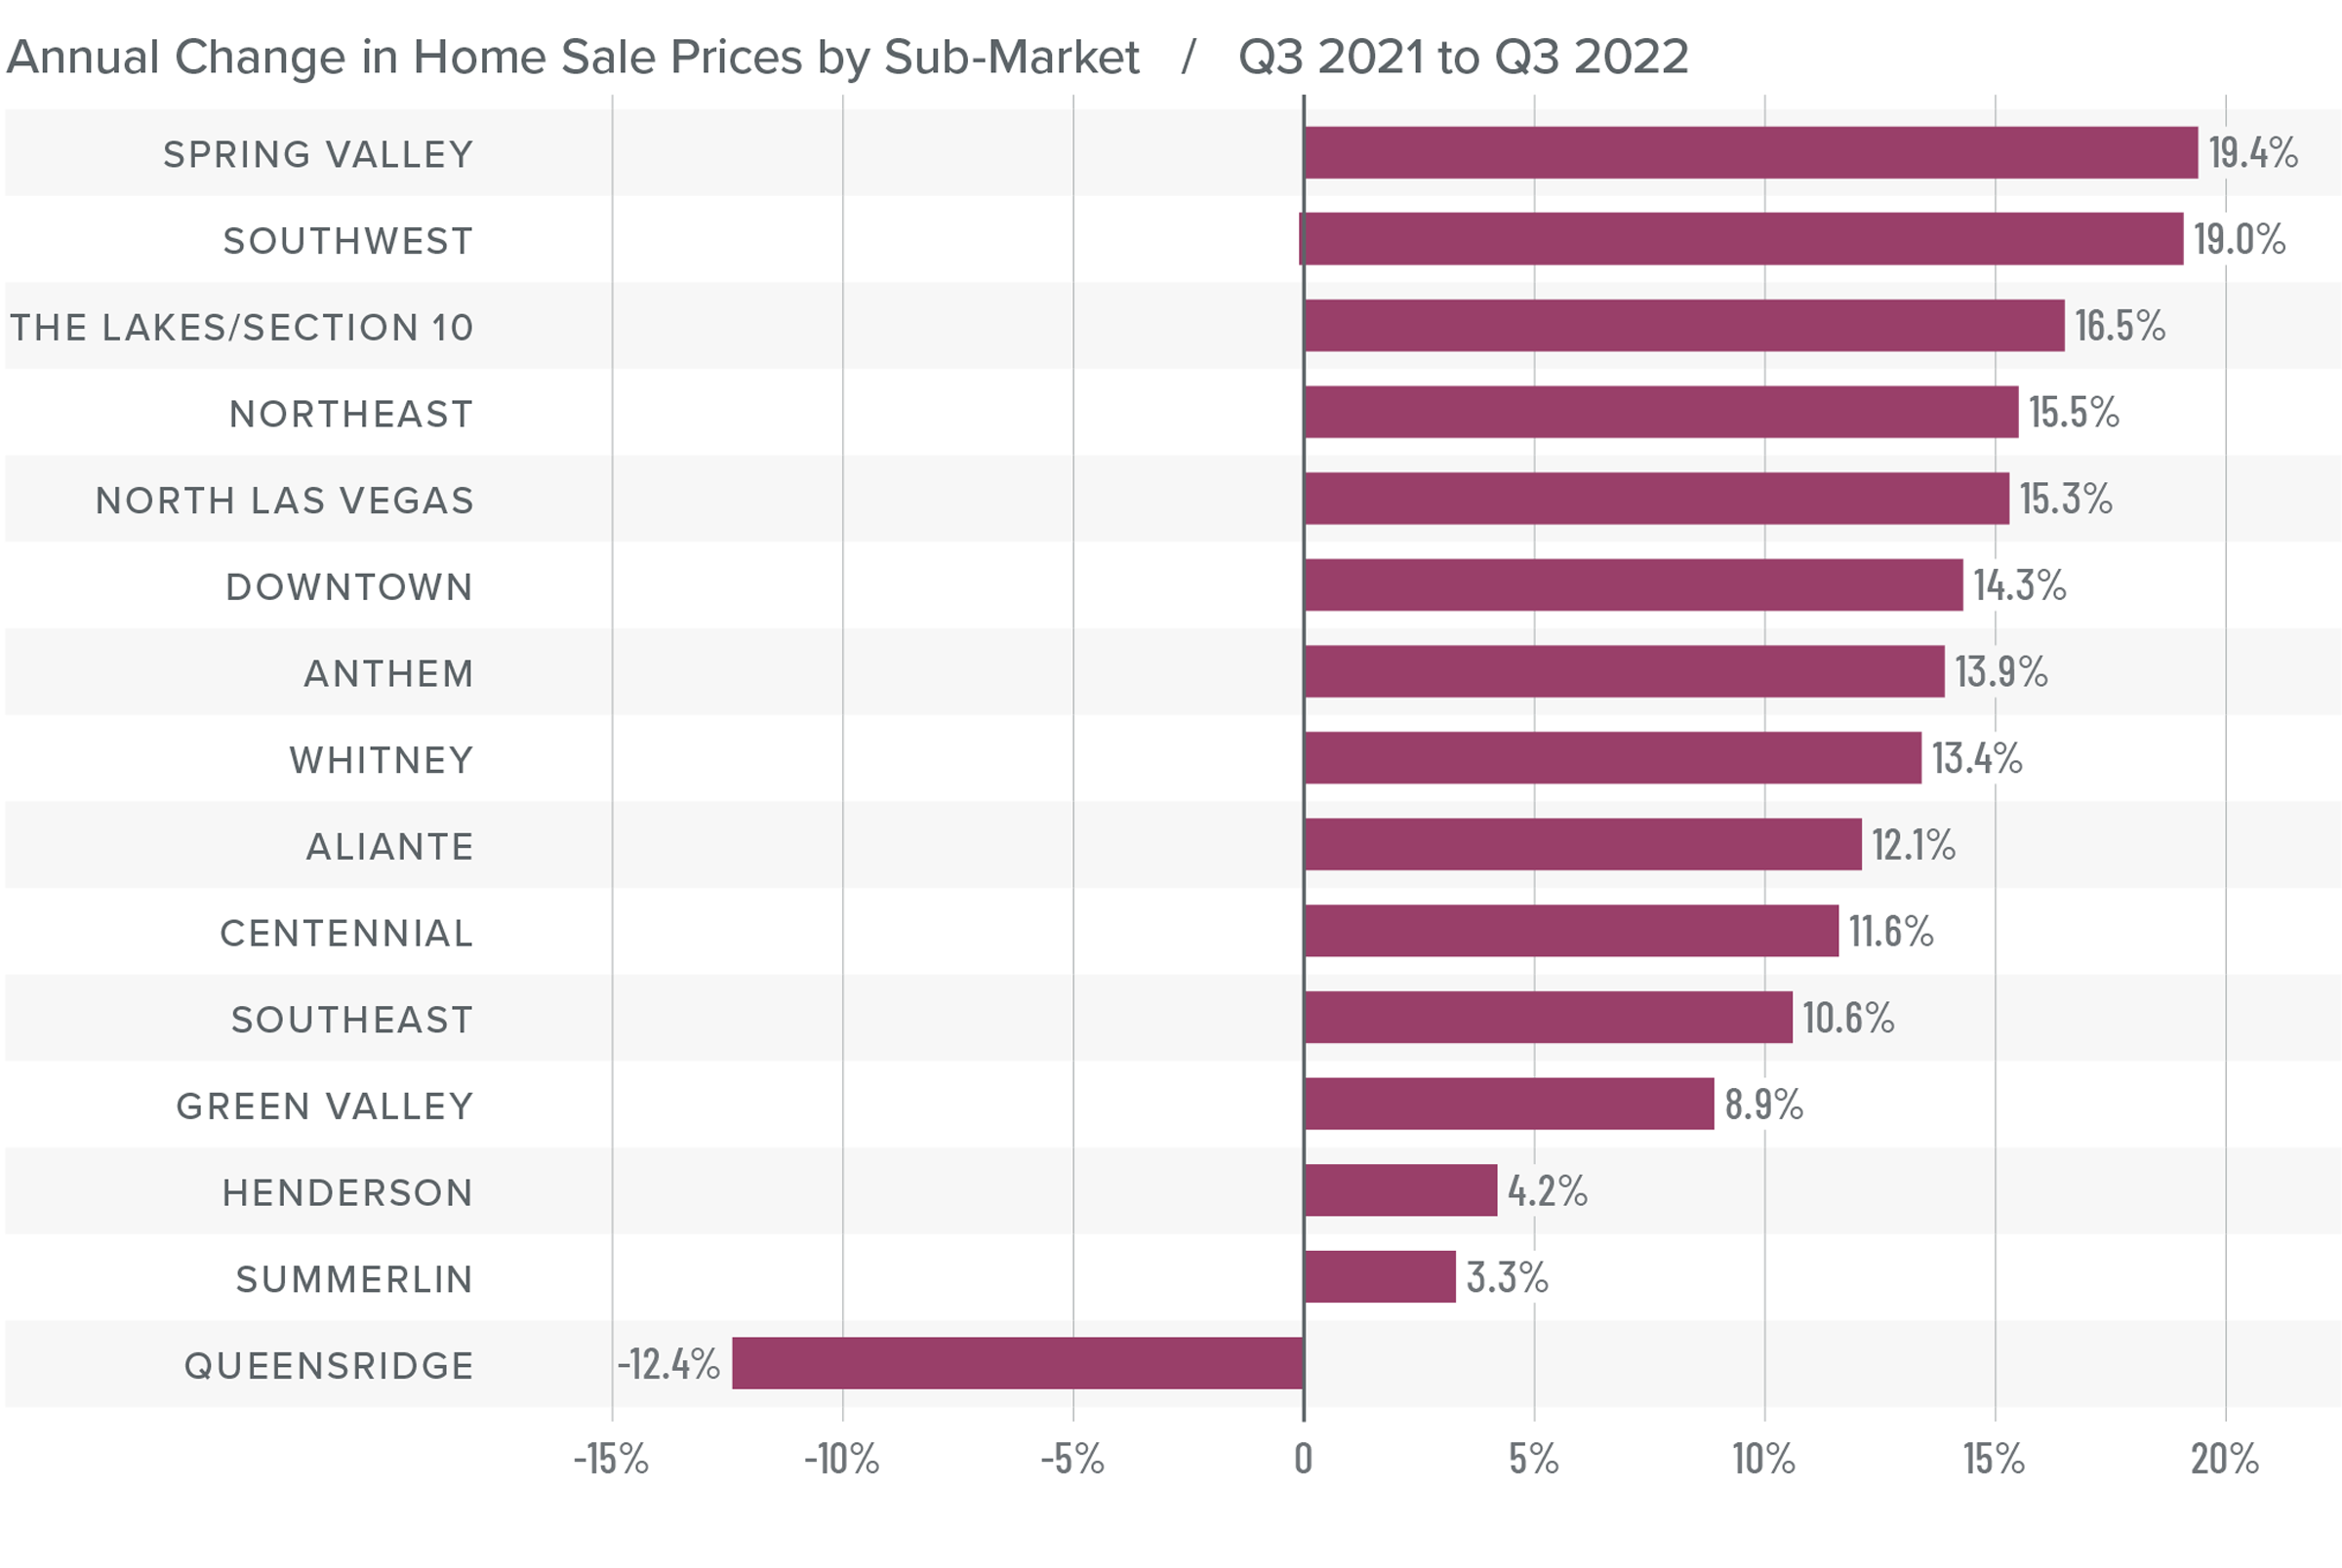
❱ Even with slower sales, home prices still rose 9.4% from a year ago to an average of $479,046. They were 9% lower than in the second quarter of 2022.
❱ The impact of higher mortgage rates has now started to affect both sales and prices. Median listing prices are down from the second quarter in all markets except Spring Valley (+0.3%) and Anthem (+1.4%).
❱ Year over year, prices rose in every neighborhood other than Queens Ridge. They fell in every area compared to the second quarter of 2022.
❱ The market has entered a period of reversion. The impact of mortgage rates rising 2.7% between the third quarter of 2021 and the current quarter has clearly started to have a dampening effect on the market.
Mortgage Rates
This remains an uncertain period for mortgage rates. When the Federal Reserve slowed bond purchases in 2013, investors were accused of having a “taper tantrum,” and we are seeing a similar reaction today. The Fed appears to be content to watch the housing market go through a period of pain as they throw all their tools at reducing inflation.
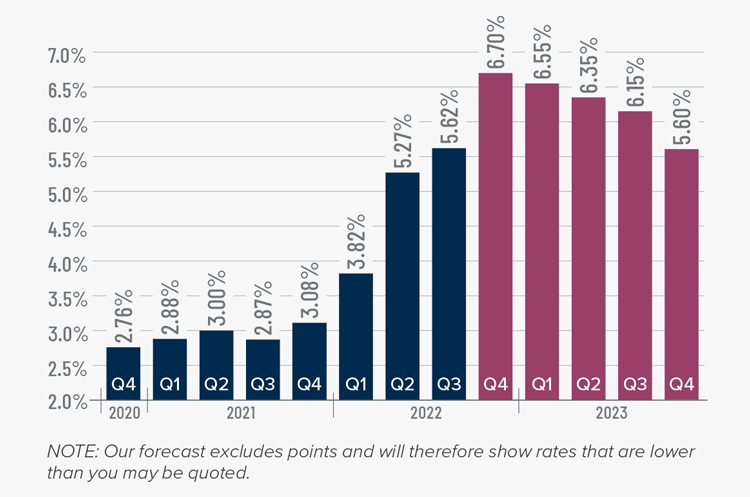
As a result, mortgage rates are out of sync with treasury yields, which not only continues to push rates much higher, but also creates violent swings in both directions. My current forecast calls for rates to peak in the fourth quarter of this year before starting to slowly pull back. That said, they will remain in the 6% range until the end of 2023.
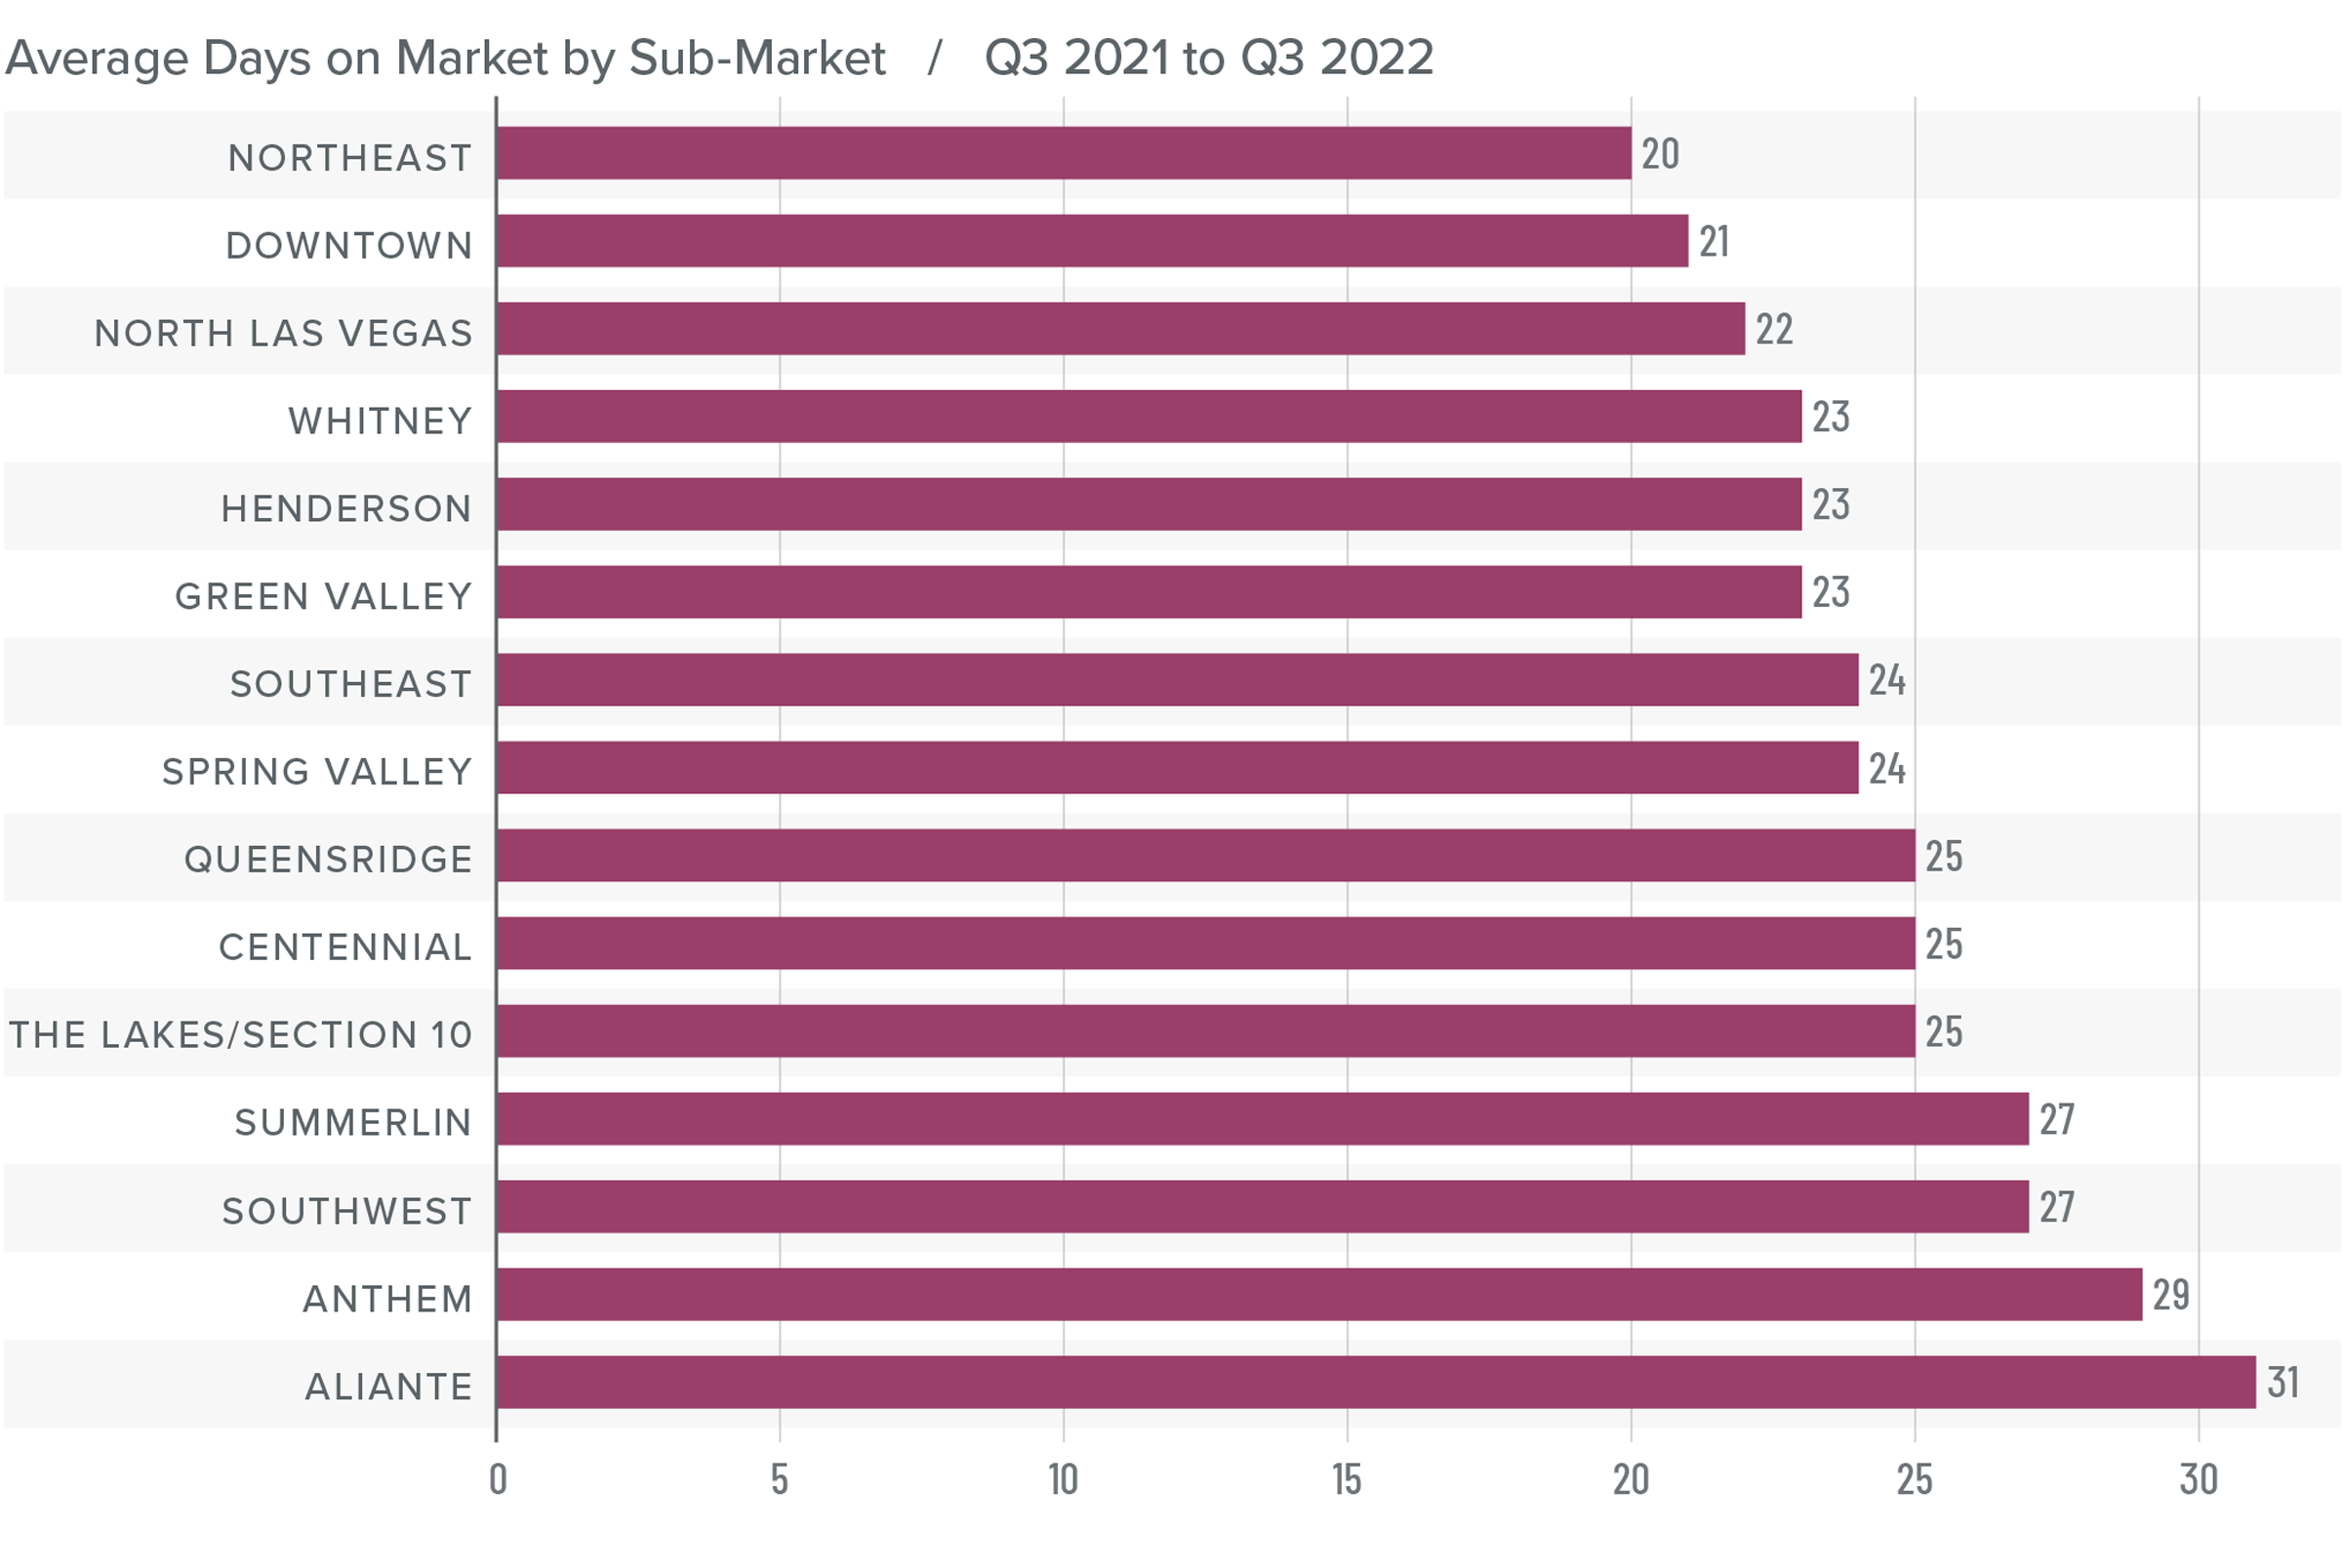
Nevada Days on Market
❱ The average time it took to sell a home in the region rose seven days compared to the third quarter of 2021.
❱ It took an average of 25 days to sell a home in the quarter, which is nine days longer than it took in the second quarter of this year.
❱ Days on market rose in all neighborhoods compared to the same period a year ago. Market time also rose in all neighborhoods compared to the second quarter of 2022.
❱ Although these numbers may appear to be very bleak, it is worth remembering that the average days on market in the current quarter was 19 fewer than in the same quarter in 2019.
Conclusions
This speedometer reflects the state of the region’s real estate market using housing inventory, price gains, home sales, interest rates, and larger economic factors.
The third quarter was one of transition as the market started to feel the impact of higher financing costs and more homes for sale. I expect the market to continue underperforming through the end of this year. However, as we enter 2023 mortgage rates should start stabilizing and moving modestly lower, leading to a more sustainable pace of sales and price growth. Although sellers may feel that the value of their homes is collapsing, that is not the case. Over 56% of Clark County homeowners with a mortgage have over 50% equity in their homes. Though any price correction might be painful to watch, it will not cause a major jump in foreclosure activity. Owners will see values return, but only after this period of reversion is complete, which will occur in 2023.
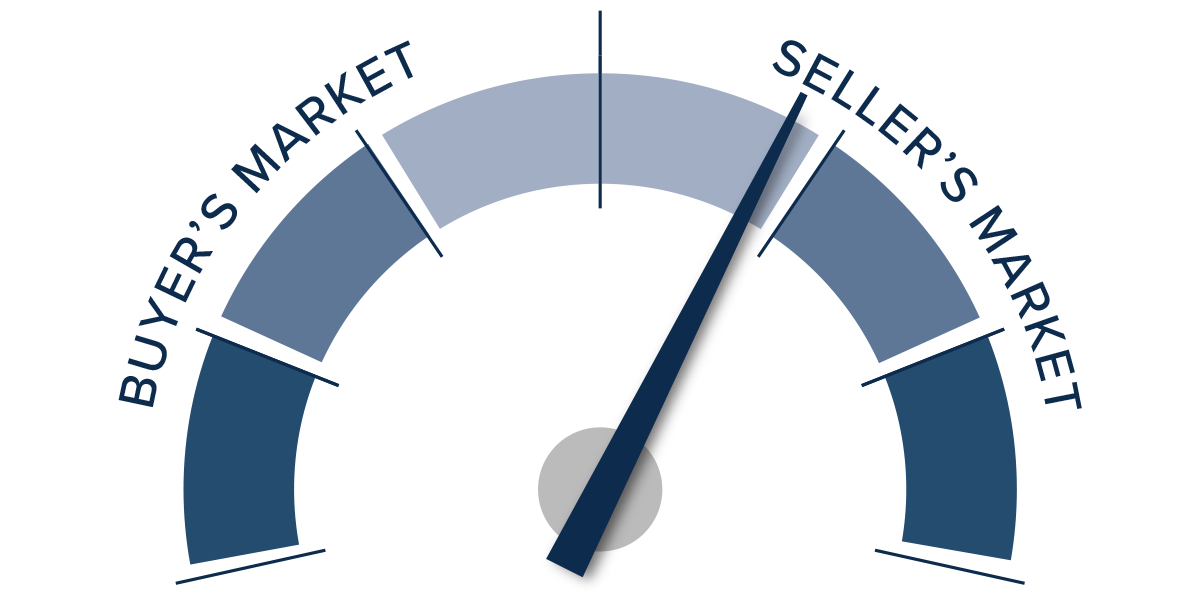
Given all the data discussed here, I have moved the needle more in favor of home buyers. However, they still do not have the upper hand.
About Matthew Gardner

As Chief Economist for Windermere Real Estate, Matthew Gardner is responsible for analyzing and interpreting economic data and its impact on the real estate market on both a local and national level. Matthew has over 30 years of professional experience both in the U.S. and U.K.
In addition to his day-to-day responsibilities, Matthew sits on the Washington State Governors Council of Economic Advisors; chairs the Board of Trustees at the Washington Center for Real Estate Research at the University of Washington; and is an Advisory Board Member at the Runstad Center for Real Estate Studies at the University of Washington where he also lectures in real estate economics.
")


