Living August 22, 2022

Windermere Living: Closet Curation

This article originally appeared in the Summer/Fall 2022 issue of Windermere Living

By Amanda Zurita | Photography by Victoria Kovios
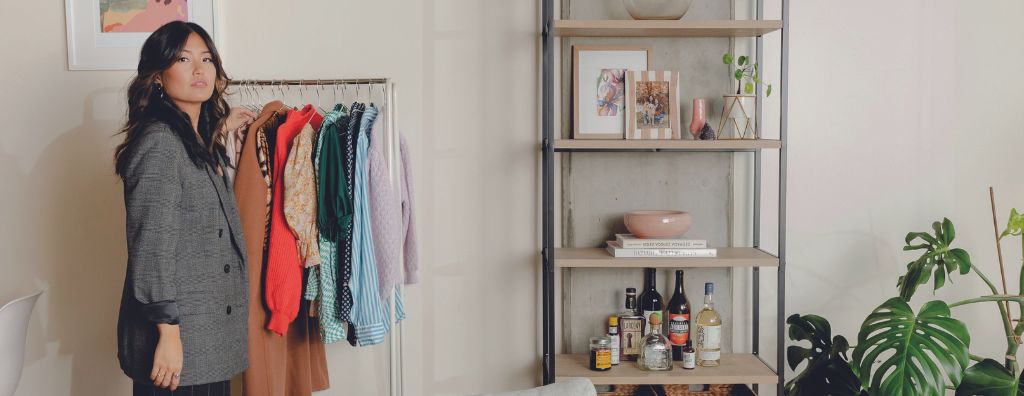

Closet Curation

Turn your wardrobe into your personal boutique with these professional “editing” tips.

Iris Miyasaki was born an organizer. Growing up in Hawaii in a Japanese American family, minimalism was part of her life. “In school, my binders were always very organized and color coded,” she says. “People found it amusing, but it was just how I functioned.” Today, she puts that passion for order and organization to use as a professional wardrobe curator and stylist under her Seattle-based brand Wardrobe by Saki (wardrobebysaki.com). Here are her tips for curating a captivating closet and finding ease through editing.

How does editing your closet differ from other decluttering trends?

Decluttering is the first step of purging, more of a first run-through to get rid of things you truly don’t need. Editing and curating, however, is where I bring in a styling aspect to organization and understand how my clients are using the pieces in their closets.

For example, perhaps a client has a sweatsuit that they wear all the time. In the decluttering phase, they’re not going to get rid of it. But, when it comes to editing, I ask questions like, “Does this outfit make you happy? Do you want to put this on every day?” If no, then we’ll work to find something better. Oftentimes, once you’ve relived the story of a piece, you’ll realize that the memory is in your heart and not solely attached to an item—so it’s easier to let go of.

What goes into making an “Instagram worthy” closet?

When you can see all your clothes, shoes, and accessories, you’ll want to use them more. I focus on creating a visual palette for my clients, whether that means organizing by color, silhouette, or types of items. The idea is to create a closet they’ll want to “shop” in.

Your closet is your personal store. If you don’t love it, if you wouldn’t shop in that store, you aren’t going to pull things from it. From a technical standpoint, it’s important to be consistent with your storage colors and textures. And you don’t have to fill every single space. In fact, negative space opens up breathing room for your things.

Aside from the visual aspect, what kind of emotional impact can editing a wardrobe have?

You interact with your closet every day, so when you’re able to utilize that space in the most efficient way, it just takes a weight off your shoulders. Rather than combing through clutter, you can have peace of mind knowing, “OK, all my things are right here and I love each one of them.” That kind of foundation helps you to feel at ease going through the rest of the world. A curated closet offers a sense of calm and contentment.

What’s your advice for parting with meaningful items that you may not be using frequently?

I like to ask my clients: Have you used this within the past year or year and a half? Fashion trends change, and what you like changes. Your body changes. So, if you haven’t worn something in the past year, maybe it’s time to part. When it comes to sentimental pieces, I find it helps to talk about the memories associated with them.


Read the full issue here: Windermere Living Summer/Fall 2022


­­­­­Windermere Living is one of the top real estate magazines on the West Coast, offering carefully curated editorial that reflects our passion for community, connection, and inspired living alongside exceptional homes on the market. Windermere Living is the exclusive listings magazine published by Windermere Real Estate in partnership with SagaCity Media.

Featured Image Credit: Victoria Kovios

Selling August 17, 2022

Moving Checklist: A Step-by-Step Guide to the Moving Process

Once you and your agent work through the process of selling your home, there comes a point when it’s time to switch gears and get ready to move. It can be difficult to juggle the various steps of the moving process, especially if you’re Buying and Selling a Home at the Same Time. Using a moving checklist will help you stay organized and on schedule throughout your moving timeline.

Moving Checklist: A Step-by-Step Guide to the Moving Process

We’ve included a comprehensive checklist below of all the steps you’ll need to complete to ensure a smooth, successful move. This list is also available as an interactive web page and downloadable PDF here: Moving Checklist

Twelve Weeks Before:

  • Get estimates from professional movers or truck rental companies if needed.
  • Once you’ve selected a mover, discuss insurance, packing, loading and delivery, and the claims procedure.

Six to Eight Weeks Before:

  • Use up things that may be difficult to move, such as frozen food.
  • Sort through your possessions. Decide what you want to keep, what you want to sell, and what you wish to donate to charity.
  • Record serial numbers on electronic equipment, take photos (or video) of all your belongings and create an inventory list.
  • If you are moving yourself, use your inventory list to determine how many boxes you will need. Stock up on the items you’ll need from our “Moving Essentials” list.
  • Obtain a change of address packet from the post office and send it to creditors, magazine subscription offices, and catalog vendors.
  • Discuss tax-deductible moving expenses with your accountant and begin keeping accurate records.
  • If you’re moving to a new community, contact the Chamber of Commerce and school district and request information about services.
  • Make reservations with airlines, hotels, and car rental agencies, if needed.
  • Begin packing nonessential items.

Two to Four Weeks Before:

  • Arrange for storage, if needed.
  • If you have items you don’t want to pack and move, hold a yard sale.
  • Update the address listed on your car registration, license, and insurance.
  • Transfer your bank accounts and safe-deposit box items to new branch locations if needed. Cancel or redirect any direct deposit or automatic payments from your accounts.
  • Make special arrangements to move your pets and consult your veterinarian about ways to make travel comfortable for them.
  • Have your car checked and serviced if you’ll need to drive it a long distance.
  • Change your utilities, including phone, power, and water, from your old address to your new address.

Week of Moving Day:

  • Defrost your refrigerator and freezer.
  • Have movers pack your belongings.
  • Label each box with the contents and the room where you want it to be delivered.
  • If you’re using a moving company, arrange to pay for their services in full, or the remainder of what you owe, upon delivery.
  • Set aside legal documents and valuables that you do not want packed.
  • Pack clothing and toiletries, along with extra clothes in case the moving company is delayed.
  • Give your travel itinerary to a close friend or relative so they can reach you as needed.
  • Pack a first-day box with items that you’ll want accessible before other boxes are unpacked. See our list of suggested items on the right and add any others you’ll want to include.

Moving Day: 

Old Home

  • Pick up the truck as early as possible if you are moving yourself.
  • Make a list of every item and box loaded on the truck.
  • Let the mover know how to reach you.
  • Double-check your closets, cupboards, attic, basement, yard, and garage for any left-behind items.

New Home

  • Be on hand at the new home to answer questions and give instructions to the mover.
  • Check off boxes and items as they come off the truck.
  • Install new locks.
  • Confirm that the utilities have been turned on and are ready for use.
  • Unpack your first-day box.
  • Unpack your children’s toys and find a safe place for them to play.
  • Examine your goods for damage.


Our Moving Checklist page has all the information above, plus helpful lists for Moving Essentials and which items to pack in your First-Day Box available as a downloadable PDF.

For additional information on the selling process from start to finish, tips on working with an agent, and more, visit our Home Selling Guide:


­­­­­­Featured Image Source: Getty Images – Image Credit: JohnnyGreig

Design August 15, 2022

What is Colonial Style Architecture?

With its grand stature and signature look, Colonial architecture hearkens back to the nascent days of British settlement on American soil. Since then, the classic home style has seen waves of renewed interest, giving rise to multiple variations on the colonial theme. Today, they remain a popular choice for homeowners throughout the Eastern and Southern United States.

History of Colonial Style Architecture

Like the Cape Cod home style, the roots of Colonial architecture took shape as European settlers made their way to American shores and began to develop their homesteads. A century later amid the country’s centennial celebrations, a new wave of interest in colonial homes took hold. This gave way to the Colonial Revival period, which saw architects and home builders molding the settlers’ early home designs into something more suited for the needs of modern life. Several variations were born during this time, including Georgian, Dutch, French, and others.


A profile shot of a turquoise and white American Colonial home with a brick chimney

Image Source: Getty Images – Image Credit: korisbo


What is Colonial Style Architecture?

Colonial homes are easily identifiable, with symmetric and traditional exteriors that allow their signature characteristics to stand out. Their spacious interiors prioritize comfort, with common living areas and bedrooms typically located on different stories. Here are some common elements of colonial home design.

  • Symmetrical façades and windows with a central door
  • Shuttered windows for protection against the elements
  • Rectangular shape with either a central or double chimney
  • Built of brick, wood, or stone, depending on the region and era of construction
  • Pitched roofs with side gables
  • Front porch columns, typically framing the door
  • Grand entryways
  • Living spaces on ground floor, bedrooms located throughout second or third stories
  • Hardwood floors
  • Decorative moldings

To learn more about the various home styles from A-Frame to Victorian, head to our Architectural Styles page.


­­­­­­Featured Image Source: Getty Images – Image Credit: lillisphotography

Buying August 10, 2022

What Is a Homeowners Association and How Much Are HOA Fees?

Becoming a homeowner comes with many responsibilities, but if the home you’re purchasing requires you to be part of a Homeowners Association (HOA), you’ll have to follow additional guidelines and pay additional fees. As you’re looking for homes, talk to your agent about whether purchasing a home that’s part of an HOA is right for you.

What is a Homeowners Association (HOA)?

A Homeowners Association is an organization that governs a community of homes. Homeowners within the governed community must follow certain guidelines for property upkeep and maintenance and will face restrictions on their ability to make additions and/or changes to the property. These rules exist to maintain a standard level of quality amongst the community to maximize property value. 

Different HOAs may have different stipulations based on the type of housing they govern. For example, an HOA may oversee a community of detached single-family homes, but they are commonly found in communities of condo or townhome housing styles where there is a shared, communal living style. Each HOA has a Board of Directors in charge of enforcing rules, collecting fees, and managing the funds, and certain associations may hire a third-party management company to help the Board of Directors carry out their operations. The members of an HOA are the residents who live in that community. Here are some examples of typical HOA property restrictions:

  • Exterior paint color choices must be submitted for approval
  • Grass must be mowed regularly
  • Flower beds must be kept weed-free
  • Noise regulations and/or noise curfew
  • Pet restrictions (type of animal and/or number of pets per household)

Homeowners Association (HOA) Pros and Cons

Living in an HOA community means your property will maintain its curb appeal and you can live with the knowledge that systems are in place to protect property values. However, the benefits come with additional restrictions on your freedoms as a homeowner while increasing your monthly payments.


Overhead view of a miniature model house sitting on tax paperwork next to a calculator

Image Source: Getty Images – Image Credit: mphillips007


How much are HOA fees?

If you buy in a development governed by a Homeowners Association, you will be required to pay HOA fees on top of your monthly mortgage payment. Typically paid monthly, HOA fees go toward the neighborhood’s shared spaces, property maintenance, and amenities. Homeowners Association fees vary greatly depending on the particulars of that community’s agreement. These fees often cover landscaping costs, parking, community security, garbage pickup, maintenance and repair, insurance, and other amenities, such as a shared pool or gym. If the home is your primary residence, your HOA fees are not tax-deductible.

HOA fees are an additional expense you’ll have to budget for when buying a home. To get an idea of what you can afford, use our free Home Monthly Payment Calculator by clicking the button below. With current rates based on national averages and customizable mortgage terms, you can experiment with different values to get an estimate of your monthly payment for any listing price, accounting for any HOA fees you may incur.


­­­­­­Featured Image Source: Getty Images – Image Credit: RichVintage

Living August 8, 2022

Decorating with House Plants to Match Your Décor Style

Interior design solutions come in all shapes and sizes. After all your furniture items, art, and other physical items are all in their right place, decorating with house plants can provide the perfect final touch. The best plants for your home are the ones that will thrive in your local climate while complementing your existing décor. Here are a few common house plants and their corresponding interior design styles to aid your decorating efforts.

Decorating with House Plants to Match Your Décor Style

Mid-Century Modern

Mid-century modern interior design is ubiquitous, and for good reason. Its simple concepts, open spacing, and emphasis on natural elements make it one of the premier interior design styles for homeowners and design experts alike. A Split-Leaf Philodendron, or “Swiss cheese plant,” is ideally suited for these interior spaces, and its signature leaf holes make it a visual focal point. Swiss cheese plants will thrive in open spaces with access to natural light, climbing toward the ceiling as space allows. For the same reasons, Fiddle-Leaf Figs feel at home in a mid-century modern aesthetic.


Woman watering a Swiss cheese plant from a watering can in her living room

Image Source: Getty Images – Image Credit: funebre


Industrial

There’s an inherent give and take with industrial interior design in that it foregoes traditional elements that we associate with comfort for stylistic choices that create a strict-yet-visually appealing environment. Decorating with house plants can add vibrance to an industrial backdrop of wood, steel, brick, stone, and copper without compromising the edginess of the style. Both Snake Plants and Cast Iron Plants will harmonize with an Industrial space. Both are low-maintenance plants that mesh well with materials that evoke toughness and durability. 

Minimalist

The combination of minimalism and house plants is a match made in heaven. Given minimalism’s focus on the reduction of waste and clutter and the importance of bringing the outdoors in, all signs point toward decorating with house plants. Being selective about which plants you include will keep everything in line with the fundamental concepts of minimalism—too many plants and things would easily feel off balance. Large-leaf plants are a perfect solution for minimalist decorators, such as Rubber Plants, Bird of Paradise, and Silver Evergreen.


Comfortable chic living room with Traditional interior design style features, like neutral color pallet with wood and wicker accents, is expertly designed with large houseplants next to the couch

Image Source: Getty Images – Image Credit: Liudmila Chernetska


Farmhouse

The Farmhouse interior style prioritizes cleanliness and an inviting spirit. Its white-washed backdrop of whites, grays, and beiges makes it a fitting canvas for the lush green additions that a selection of house plants can provide. Spider Plants work well to fill shelf space, which come in both solid green and white-striped varieties. These plants are easy to take care of and thrive in partial sun or shade. Aloe Vera plants in the kitchen can refresh the look of your shelving or counter space.


Modern farmhouse living room with a large grey couch, a coffee table, a fireplace, and big windows, with large wooden beams across the ceiling

Image Source: Getty Images – Image Credit: xavierarnau


Traditional

Homeowners with traditionally styled interiors have a whole host of options to choose from. Any classic plant species will complement its traditional surroundings, but more specific choices can bring out the uniqueness in your home. If your decorations are rife with patterns and geometric shapes, perhaps a fern or Amazon Lily would help to balance the room. Bamboo may be a natural fit for your home depending on your existing décor. If you’re looking for a hanging display to fill empty wall space, consider Devil’s Ivy.


As always, research the watering and sunlight needs of a house plant before bringing it into your home. For more on decorating with house plants, be sure to read our room-by-room guide:

The Best Indoor Plants for Every Room


­­­­­­Featured Image Source: Getty Images – Image Credit: Tanya Paton

Market News August 4, 2022

Q2 2022 Northern California Real Estate Market Update

The following analysis of select counties of the Northern California real estate market is provided by Windermere Real Estate Chief Economist Matthew Gardner. We hope that this information may assist you with making better-informed real estate decisions. For further information about the housing market in your area, please don’t hesitate to contact your Windermere Real Estate agent.


Regional Economic Overview

Over the past 12 months, the Northern California markets covered in this report added 184,600 jobs. With decent job growth, the unemployment rate fell to 2.4%, which is a significant drop from the 5.8% rate we saw a year ago. The lowest jobless rate was in Santa Clara County (1.8%), and the highest rate was in Solano County, where 3.5% of the workforce remains unemployed.

Northern California Home Sales

In the second quarter of 2022, 14,235 homes sold, which is a drop of 21.1% compared to a year ago. Sales rose an impressive 37.6% compared to the first quarter of this year.

Year over year, sales fell across the board. The largest drop was in San Luis Obispo County. Solano and Shasta counties had fairly modest declines.

The number of homes for sale jumped more than 67% compared to the first quarter of the year. This growth in inventory has caused an impressive rise in sales.

Pending home sales ticked up from the first quarter of 2022, suggesting that we may see some growth in closings in the third quarter of this year.

A bar graph showing the annual change in home sales for various counties in Northern California from Q2 2021 to Q2 2022. All counties listed showed a negative year-over-year percentage change. Solano County had a -11.6%% change, followed by Shasta at -12%, Placer at -18.8%, Alameda at -19.5%, Napa at -20.8%, Santa Clara at -23.5%, Contra Costa at -24.1%, and San Luis Obispo at -24.5%.

Northern California Home Prices

The average home price in the region rose 10.6% from this time last year to $1.35 million. Compared to the final quarter of 2021, prices rose by 11%.

I have started watching list prices, as they will be a leading indicator of whether the market is starting to feel the impacts of declining affordability due to rising financing costs. In the second quarter, the median list price in the region rose an average of 13%. We did see a small drop in Placer County, but I am not overly concerned as it is a fairly small area that can experience unusual swings in both list and sale prices.

Sale prices rose by double digits in all counties other than Shasta compared to a year ago; they were also higher across the region compared to the first quarter of the year.

Even with rising inventory levels and higher financing costs, the market appears to still be buoyant. However, the pace of price growth has slowed, which will likely continue as the area starts to move toward a more balanced market.

A map showing the real estate home prices percentage changes for various counties in Northern California. Different colors correspond to different tiers of percentage change. Shasta County is the the only county with a percentage change in the 5% to 8.9% range, while Placer, Solano, Contra Costa, Alameda, and Santa Clara are in the 9% to 12.9% change range. San Luis Obispo is in the 17% to 20.9% change range, and Napa County is the only county in the 21% + change range.

A bar graph showing the annual change in home sale prices for various counties in Northern California from Q2 2021 to Q2 2022. Napa County tops the list at 24.2%, followed by San Luis Obispo at 17.6%, Alameda at 12.8%, Solano at 11.2%, Santa Clara and Placer at 11%, Contra Costa at 10.1%, and Shasta at 5.8%.

Mortgage Rates

Although mortgage rates did drop in June, the quarterly trend was still moving higher. Inflation—the bane of bonds and, therefore, mortgage rates—has yet to slow, which is putting upward pressure on financing costs.

That said, there are some signs that inflation is starting to soften and if this starts to show in upcoming Consumer Price Index numbers then rates will likely find a ceiling. I am hopeful this will be the case at some point in the third quarter, which is reflected in my forecast.

A bar graph showing the mortgage rates from 2020 to the present, as well as Matthew Gardner's forecasted mortgage rates through Q2 2023. He forecasts mortgage rates continuing to climb to 5.9% in Q4 2022, then tapering off to 5.58% in Q1 2023 and 5.53% in Q2 2023.

Northern California Days on Market

The average time it took to sell a home in the Northern California counties in this report dropped two days compared to the second quarter of 2021.

The amount of time it took to sell a home fell in Napa, Santa Clara, San Luis Obispo, and Shasta counties, remained static in Alameda and Solano, and rose modestly in Contra Costa and Placer counties. Average market time fell in all counties other than Solano and Shasta compared to the first quarter of 2022.

In the second quarter, it took an average of 26 days to sell a home, which was seven fewer days than in the first quarter of this year.

The greatest drop in market time from a year ago was in Shasta County, where it took seven fewer days to sell a home.

A bar graph showing the average days on market for homes in various counties in Northern California for Q2 2022. Santa Clara County has the lowest DOM at 11, followed by Alameda at 12, Contra Costa at 13, Placer at 14, San Luis Obispo at 21, Solano at 23, Napa at 44, and Shasta at 71.

Conclusions

This speedometer reflects the state of the region’s real estate market using housing inventory, price gains, home sales, interest rates, and larger economic factors.

Positive job growth and a growing economy continue to stimulate the housing market, which has led home sales and prices to rise even as mortgage rates and supply levels jumped. Although affordability continues to be a significant issue, there are no indications that a major correction is imminent. However, we are seeing the speed that homes sell starting to slow, as is the pace of price growth. This suggests to me that the market is starting to cool. That said, with average list prices in most counties continuing to rise, sellers remain confident.

A speedometer graph indicating a medium seller's market in Northern California for Q2 2022.

All things considered, I have left the needle in the same position as in the first quarter of the year. The market still favors home sellers, but rising inventory levels and slowing price growth suggest they are not in a better position now than they were at the start of the year.

About Matthew Gardner

Matthew Gardner - Chief Economist for Windermere Real Estate

As Chief Economist for Windermere Real Estate, Matthew Gardner is responsible for analyzing and interpreting economic data and its impact on the real estate market on both a local and national level. Matthew has over 30 years of professional experience both in the U.S. and U.K.

In addition to his day-to-day responsibilities, Matthew sits on the Washington State Governors Council of Economic Advisors; chairs the Board of Trustees at the Washington Center for Real Estate Research at the University of Washington; and is an Advisory Board Member at the Runstad Center for Real Estate Studies at the University of Washington where he also lectures in real estate economics.

Selling August 3, 2022

Understanding the Value of Your Home: Market Value vs. Assessed Value and More

The math of a home sale is relatively straightforward. Sellers list their home at a certain price, a buyer makes an offer, and eventually the two parties reach a final, agreed-upon price. However, between these two points in the selling process, there are several other figures that go into to setting a home’s value that you should be aware of. Your real estate agent will be your best resource in interpreting the different values associated with your home and what they mean as you prepare to sell.

Understanding the Value of Your Home

Listed Price (Asking Price)

Also known as an asking price, the listing price of a home is the price at which a seller lists their property when it goes on the market. The listing price is a gross price, meaning the costs associated with selling the home are not included. A real estate agent’s Comparative Market Analysis (CMA) will accurately set your home’s listing price, accounting for the various factors that influence home prices including location, condition, seasonality, local market conditions, and more.

The listing price is a starting point for negotiations with buyers. You may receive an offer that matches your asking price, but it’s common for buyers to make offers at other price points. You can either accept, reject, or make a counteroffer in response until you and the buyer reach an agreement.

Whether you’re selling in a buyer’s market or a seller’s market may determine you and your agent’s approach to the listing price of your home. There may be certain pricing tactics you can employ to either drive buyer attention or increase competition, but if your home’s listing price strays too far from its market value (see below), it could stay on the market for longer than you expected.

Market Value

As a seller, you’re interested in what buyers are willing to pay for your home. By taking into account a home’s condition, size, curb appeal, and features, as well as local market conditions and what comparable homes are selling for, a home’s market value reflects the price buyers will pay for a property.


Man sitting at his computer at home talks to his real estate agent on the phone

Image Source: Getty Images – Image Credit: damircudic


Appraised Value

A home’s appraised value is determined by a professional appraiser to ensure that the lender is loaning the correct amount of money for the home. Appraisers assess the home’s layout and features, square footage, gross living area (GLA), overall condition inside and out, home updates and remodels, and more. If the appraised value comes in too low or too high, the buyer and seller must renegotiate for the deal to go through. In competitive markets, buyers may include an appraisal gap guarantee in their offer, which states that the buyer will cover the difference between the price of the home and the appraised value.

Sale Price (Purchase Price)

Also known as the purchase price, your home’s sale price is what it ultimately ends up selling for. Once you and the buyer have reached an agreement on the terms of the transaction, the buyer will have the home inspected and final negotiations may occur based on the findings of the inspection. Familiarize yourself with the Common Real Estate Contingencies buyers may include in their offer and what they mean when selling your home.

Net Proceeds

So, how much do you actually make on the sale of your home? After subtracting the total costs of selling from your home’s sale price, you’ll arrive at your net proceeds. This is the amount you walk away with from the transaction.

Assessed Value

Your agent’s CMA is a reliable method of determining your home’s value for its eventual sale, but its assessed value is used for taxation purposes. Employed by local municipal or county entities, an assessor will conduct a review of your property to determine its assessed value. The assessor’s findings are passed to local tax officials, who use that number to calculate the home’s property taxes.


For answers to all your home selling questions, connect with a local, experienced Windermere agent today by clicking on the button below.


Featured Image Source: Getty Images – Image Credit: kupicoo

Market News August 3, 2022

Q2 2022 Utah Real Estate Market Update

The following analysis of select counties of the Utah real estate market is provided by Windermere Real Estate Chief Economist Matthew Gardner. We hope that this information may assist you with making better-informed real estate decisions. For further information about the housing market in your area, please don’t hesitate to contact your Windermere Real Estate agent.


Regional Economic Overview

The Utah economy remains buoyant. Although the pace of job growth has tapered somewhat from 2021, jobs continue to be added faster than the long-term average. Over the past 12 months, the state has added 55,400 jobs, representing a growth rate of 3.4%. The counties covered in this report added almost 53,000 new jobs over the past year, representing a growth rate of 4%. The state’s unemployment rate in May was 2%, which is marginally above the all-time low of 1.9% in April of this year. The labor force continues to expand, suggesting that the region expects economic growth to remain strong. All in all, a very impressive situation.

Utah Home Sales

In the second quarter of 2022, 8,501 homes sold, which was a drop of 14.4% year over year. Sales were 30.9% higher than in first quarter of the year.

Year over year, sales rose in the small Morgan County area but fell in the rest of the markets included in this report. Conversely, sales rose across the board compared to the first quarter, with impressive growth in Morgan, Davis, Utah, and Salt Lake counties.

Inventory levels, which had been remarkably low, rose 206.2% from the first quarter of the year. This clearly had a positive effect on the market as more choice for buyers led to more sales.

Buyers appeared to shrug off the fact that mortgage rates rose more than 1.5% in the quarter, which suggests they still believe owning a home is a solid investment.

A bar graph showing the annual change in home sales for various counties in Utah from Q2 2021 to Q2 2022. All counties listed showed a negative year-over-year percentage change, except for Morgan County, which showed a positive 40% change. Weber County had a -7.1% change, followed by Davis at -7.5%, Utah at -13.9%, Salt Lake at -17.5%, Wasatch at -21.3%, and Summit at -23.9%.

Utah Home Prices

Even with more homes on the market, prices continued to rise. Home prices rose 15.4% year over year to an average of $665,697, and they were 4.2% higher than in the first quarter of 2021.

I have started watching list prices, as they will be a leading indicator of whether the market is starting to feel the impacts of declining affordability due to rising financing costs. In the second quarter, the median list price in the region dropped 2.2%, but it rose in Morgan, Davis, and Salt Lake counties.

All areas contained in the report except for Wasatch County saw sale prices increase by double digits compared to a year ago. Compared to the first quarter of this year, prices were higher in every county other than Summit.

Higher financing costs combined with declining affordability may have started to slow the rapid pace of appreciation we’ve seen over the past two years. This is nothing to be concerned about; rather it suggests that the market is starting to return to some sense of normalcy.

A map showing the real estate home prices percentage changes for various counties in Utah. Different colors correspond to different tiers of percentage change. Wasatch County is the the only county with a percentage change in the 6.5% to 9.4% range, while Weber, Davis, Salt Lake, Utah, and Summit are in the 15.5% to 18.4% change range. Morgan County is the only county in the 18.5% + change range.

A bar graph showing the annual change in home sale prices for various counties in Utah from Q2 2021 to Q2 2022. Morgna County tops the list at 18.7%, followed by Weber at 18.4%, Salt Lake at 18%, Utah at 16.8%, Davis at 16.4%, Summit at 16%, and Wasatch at 6.7%.

Mortgage Rates

Although mortgage rates did drop in June, the quarterly trend was still moving higher. Inflation—the bane of bonds and, therefore, mortgage rates—has yet to slow, which is putting upward pressure on financing costs.

That said, there are some signs that inflation is starting to soften and if this starts to show in upcoming Consumer Price Index numbers then rates will likely find a ceiling. I am hopeful this will be the case at some point in the third quarter, which is reflected in my forecast.

A bar graph showing the mortgage rates from 2020 to the present, as well as Matthew Gardner's forecasted mortgage rates through Q2 2023. He forecasts mortgage rates continuing to climb to 5.9% in Q4 2022, then tapering off to 5.58% in Q1 2023 and 5.53% in Q2 2023.

Utah Days on Market

The average time it took to sell a home in the counties covered by this report dropped two days compared to the same period a year ago.

Homes again sold fastest in Davis County, and every county except Summit and Wasatch saw average time on market rise compared to a year ago. The greatest drop in market time was in Summit County, where it took 19 fewer days to sell a home.

During the second quarter, it took an average of 17 days to sell a home in the region. Not only did market time fall year over year, but it took 8 fewer days for homes to sell compared to first quarter.

The market remains very competitive and, as mentioned earlier, appears to not yet be impacted by higher mortgage rates.

A bar graph showing the average days on market for homes in various counties in Utah for Q2 2022. Davis County has the lowest DOM at 11, followed by Salt Lake at 12, Utah and Weber at 14, Morgan at 22, Summit at 23, and Wasatch at 25.

Conclusions

This speedometer reflects the state of the region’s real estate market using housing inventory, price gains, home sales, interest rates, and larger economic factors.

The number of homes for sale in Utah has risen significantly and buyers are absorbing the additional supply. That said, higher inventory levels are forcing sellers to be a little more competitive than they were, as demonstrated by declining median list prices in several areas. I would contend that the market is not headed for any sort of correction; rather it has started to trend back to some sense of normalcy. This may be concerning to those who have become accustomed to the frenetic pace the market has experienced since the start of the pandemic, but it really is nothing to worry about.

A speedometer graph indicating a medium seller's market in Utah for Q2 2022.

Sellers still have the upper hand and well-positioned, appropriately-priced homes continue to attract significant interest from buyers. Given all the data discussed in this report, I have left the needle in the same position as the last quarter. Although the market still favors sellers, a shift may be on the way that would lead us toward a more balanced market.

About Matthew Gardner

Matthew Gardner - Chief Economist for Windermere Real Estate

As Chief Economist for Windermere Real Estate, Matthew Gardner is responsible for analyzing and interpreting economic data and its impact on the real estate market on both a local and national level. Matthew has over 30 years of professional experience both in the U.S. and U.K.

In addition to his day-to-day responsibilities, Matthew sits on the Washington State Governors Council of Economic Advisors; chairs the Board of Trustees at the Washington Center for Real Estate Research at the University of Washington; and is an Advisory Board Member at the Runstad Center for Real Estate Studies at the University of Washington where he also lectures in real estate economics.

Market News August 3, 2022

Q2 2022 Nevada Real Estate Market Update

The following analysis of the greater Las Vegas real estate market is provided by Windermere Real Estate Chief Economist Matthew Gardner. We hope that this information may assist you with making better-informed real estate decisions. For further information about the housing market in your area, please don’t hesitate to contact your Windermere Real Estate agent.


Regional Economic Overview

Though employment growth in the Las Vegas area continues, the pace has been frenetic. The average monthly growth so far in 2022 has been about half as fast as 2021’s pace. That said, the market has recovered all but 6,800 of the 287,000 jobs that were lost during the pandemic. In the first quarter Gardner Report, I predicted that the area would return to pre-COVID employment levels by the spring. I am optimistic that when the June data is released, the region will have seen a full recovery. With rising employment, more residents started to look for work, which has grown the labor force quite significantly. That said, even though the unemployment rate remains higher than the U.S., it was still measured at a respectable 5.2%.

Nevada Home Sales

A total of 9,365 homes sold in the second quarter, which was a drop of 17.4% compared to the same period a year ago. Sales rose 2.7% compared to the first quarter of this year.

Year over year, fewer transactions occurred in every neighborhood contained in this report, but rose in all but five areas compared to the first quarter of 2022. The Aliante, Queens Ridge, and Centennial areas all saw solid growth.

Supply constraints have subsided, with the average number of listings almost doubling between the first and second quarters. This is good news for prospective home buyers.

Pending sales, which are an indicator of future closings, fell 11.2% compared to the prior quarter, suggesting that growth in closings in the third quarter may be modest.

A bar graph showing the annual change in home sales for various sub-market areas in Greater Las Vegas from Q2 2021 to Q2 2022. All sub-market areas listed showed a negative year-over-year percentage change, except for Aliante, which showed a 0% change. Queensridge had a -7.5% change, followed by Centennial at -7.8%, North Las Vegas at -8.5%, Whitney at -10%, Northeast at -10.7%, Henderson at -15.1%, Green Valley at -17.9%, Anthem at -18.8%, Downtown and Southwest at -21.9%, Summerlin at -23.6%, Spring Valley at -26.8%, Southeast at -28.1%, and The Lakes / Section 10 at -31.4%.

Nevada Home Prices

Home prices rose 22.8% from a year ago to an average of $526,289. They were 8.3% higher than in the first quarter of 2022.

With the jump in interest rates, I have been closely monitoring list prices to see if higher financing costs are having an impact on them. So far, they appear not to be. Median list prices rose by more than 13% compared to the first quarter. Only Spring Valley saw list prices fall.

Year over year, prices rose by double digits in every neighborhood other than Anthem, and rose in all markets other than Spring Valley compared to the first quarter of this year.

The market appears to still be fairly bullish, but I sense that it will start to move back toward equilibrium as financing costs and affordability become greater headwinds.

A chart showing the sub-market areas and their corresponding zip codes in the Greater Las Vegas, Nevada area.

A bar graph showing the annual change in home sale prices for various sub-market areas in Greater Las Vegas from Q2 2021 to Q2 2022. Queensridge tops the list with a 32.2% change, followed by The Lakes / Section 10 at 31.4%, Spring Valley at 31.2%, North Las Vegas at 30.2%, Summerlin and Green Valley at 28.6%, Whitney at 27.8%, Northeast at 27.1%, Southeast at 26.2%, Aliante at 25.8%, Centennial at 23.4%, Southwest at 23%, Downtown at 22%, Henderson at 16.4%, and Anthem at 8.3%.

Mortgage Rates

Although mortgage rates did drop in June, the quarterly trend was still moving higher. Inflation—the bane of bonds and, therefore, mortgage rates—has yet to slow, which is putting upward pressure on financing costs.

That said, there are some signs that inflation is starting to soften and if this starts to show in upcoming Consumer Price Index numbers then rates will likely find a ceiling. I am hopeful this will be the case at some point in the third quarter, which is reflected in my forecast.

A bar graph showing the mortgage rates from 2020 to the present, as well as Matthew Gardner's forecasted mortgage rates through Q2 2023. He forecasts mortgage rates continuing to climb to 5.9% in Q4 2022, then tapering off to 5.58% in Q1 2023 and 5.53% in Q2 2023.

Nevada Days on Market

The average time it took to sell a home in the region dropped seven days compared to the second quarter of 2021.

It took an average of 16 days to sell a home in the quarter, which was down 7 days compared to the first quarter of this year.

Days on market dropped in all neighborhoods except Anthem compared to the same period a year ago. Market time dropped in all neighborhoods other than Northeast Las Vegas (where it remained static) compared to the first quarter of the year.

The greatest drop in market time was in the Spring Valley neighborhood, where the length of time it took to sell a home fell 15 days compared to a year ago.

A bar graph showing the average days on market for homes in various sub-market areas of Greater Las Vegas from Q2 2021 to Q2 2022. Queensridge and North Las Vegas have the lowest DOM at 12, followed by Green Valley at 13, Southeast at 14, Summerlin, Southwest, and Centennial at 15, Whitney, The Lakes / Section 10, and Anthem at 16, Henderson and Downtown at 17, Northeast and Aliante at 19, and Spring Valley at 20.

Conclusions

This speedometer reflects the state of the region’s real estate market using housing inventory, price gains, home sales, interest rates, and larger economic factors.

Although listing activity and financing costs have risen, this has yet to negatively impact home sales or price growth. The growing number of homes for sale would normally cause asking prices to settle, which would favor home buyers, but so far this is not the case.

A speedometer graph indicating a medium-to-strong seller's market in the Greater Las Vegas, Nevada area for Q2 2022.

I expect the market to start moving somewhat toward balance, but for the time being sellers are still in the driver’s seat. Given all the data discussed here, I have left the needle in the same position as the last quarter. There are still too many unknowns preventing me from moving it one way or another. Hopefully, I will get more clarity once the summer winds down.

About Matthew Gardner

Matthew Gardner - Chief Economist for Windermere Real Estate

As Chief Economist for Windermere Real Estate, Matthew Gardner is responsible for analyzing and interpreting economic data and its impact on the real estate market on both a local and national level. Matthew has over 30 years of professional experience both in the U.S. and U.K.

In addition to his day-to-day responsibilities, Matthew sits on the Washington State Governors Council of Economic Advisors; chairs the Board of Trustees at the Washington Center for Real Estate Research at the University of Washington; and is an Advisory Board Member at the Runstad Center for Real Estate Studies at the University of Washington where he also lectures in real estate economics.

Market News August 2, 2022

Q2 2022 Montana Real Estate Market Update

The following analysis of select counties of the Montana real estate market is provided by Windermere Real Estate Chief Economist Matthew Gardner. We hope that this information may assist you with making better-informed real estate decisions. For further information about the housing market in your area, please don’t hesitate to contact your Windermere Real Estate agent.


Regional Economic Overview

Though the pace of job growth continues to taper, Montana still added 15,800 new jobs over the past year, which is impressive when compared to historic averages. All of Montana’s metro areas have recovered the jobs lost due to the pandemic. The unemployment rate in Montana in June was 2.6%, an increase from the all-time low of 2.3% in April. In the metro areas contained in this report, the lowest jobless rate was in Billings at 2.5%, followed by Missoula at 2.7% and Great Falls at 2.8%. I continue to be worried about the lack of workers in the state. The labor force participation rate (which is the civilian population divided by the labor force) stands at only 62.6%, close to a historic low and making it difficult for employers to find workers.

Montana Home Sales

In the second quarter, 2,359 homes sold in the markets contained in this report. This was a 2.9% increase from a year ago and more than double the number of closings in the first quarter of the year.

Higher home sales can be attributed to the 124% increase in the number of homes that came to market in the quarter.

Year over year, sales rose in four of the counties included in this report but fell in the rest of the markets. Compared to the first quarter, however, sales were up in every county other than Madison.

With significantly more homes to choose from, pending sales rose 11.7% from first quarter, suggesting that third quarter numbers may also be strong.

A bar graph showing the annual change in home sales for various counties in Montana from Q2 2021 to Q2 2022. Gallatin County came out on top with a 40.5% change, followed by Flathead at 36.6%, Jefferson at 12.5%, Park at 6.8%, Lewis & Clark at -8.9%, Ravalli at -18.8%, Lake at -19.3%, Missoula at -21.7%, Madison at -23.2%, and Broadwater -31.5%.

Montana Home Prices

Home prices rose 17.8% year over year to an average of $710,428 but were 12.9% lower than in the first quarter of 2022.

I have started watching list prices more closely, as they are a leading indicator of the health of the housing market. Thus far, despite rising mortgage rates and inventory levels, sellers remain confident. This is evident in the median list price going up in every county other than Gallatin compared to the prior quarter.

Although the quarterly drop may concern some, the average sale price used in this report is weighted to account for market size. If we use simple averages, prices in the second quarter were 11.9% higher than in the first quarter.

Price growth has yet to slow but, given the changing market conditions, it’s only a matter of time before it does.

AA map showing the real estate home prices percentage changes for various counties in Montana. Different colors correspond to different tiers of percentage change. Madison and Gallatin Counties are the only counties with a percentage change in the -11% to -0.1% range, while Park and Lake are in the 0% to 9.9% change range. Jefferson and Flathead Counties are in the 10% to 19.9% change range, Missoula County is in the 20% to 29.9% change range, and Lewis & Clark, Broadwater, and Ravalli are in the 30% + change range.

A bar graph showing the annual change in home sale prices for various counties in Montana from Q2 2021 to Q2 2022. Broadwater County tops the list at 50.9%, followed by Lewis & Clark at 32.7%, Ravalli at 31%, Missoula at 29%, Flathead at 17.4%, Jefferson at 10.1%, Park at 3.3%, Lake at 2.8%, Madison at -4%, and Gallatin at -11.4%.

Mortgage Rates

Although mortgage rates did drop in June, the quarterly trend was still moving higher. Inflation—the bane of bonds and, therefore, mortgage rates—has yet to slow, which is putting upward pressure on financing costs.

That said, there are some signs that inflation is starting to soften and if this starts to show in upcoming Consumer Price Index numbers then rates will likely find a ceiling. I am hopeful this will be the case at some point in the third quarter, which is reflected in my forecast.

A bar graph showing the mortgage rates from 2020 to the present, as well as Matthew Gardner's forecasted mortgage rates through Q2 2023. He forecasts mortgage rates continuing to climb to 5.9% in Q4 2022, then tapering off to 5.58% in Q1 2023 and 5.53% in Q2 2023.

Montana Days on Market

The average time it took to sell a home dropped 31 days compared to the second quarter of 2021.

Homes sold fastest in Gallatin County. Flathead County homes took the longest time to find a buyer. All counties saw market time drop compared to a year ago.

During the quarter, it took an average of 57 days to sell a home in the region.

In comparison to the first quarter of the year, average market time fell in every market other than Jefferson (+17 days) and Broadwater (+45 days).

A bar graph showing the average days on market for homes in various counties in Montana for Q2 2022. Gallatin County has the lowest DOM at 15, followed by Park at 21, Madison at 42, Lake at 52, Lewis & Clark at 60, Jefferson and Missoula at 64, Broadwater at 76, Ravalli at 86, and Flathead at 88.

Conclusions

This speedometer reflects the state of the region’s real estate market using housing inventory, price gains, home sales, interest rates, and larger economic factors.

Even with a shortage of workers, the economy remains buoyant, which is an important factor when it comes to the regional housing market, particularly for buyers. Even though the number of homes for sale has grown significantly, which normally favors buyers, demand is strong and the market remains competitive. List prices continue to rise, demonstrating that sellers remain confident even in the face of higher financing costs, which is likely discouraging for home buyers. Sellers are clearly still in control.

A speedometer graph indicating a medium-to-strong seller's market in Montana for Q2 2022.

As such, I have moved the needle a little more in the direction of sellers. Until we see list-price growth and transactional velocities slow significantly, we will not approach a balanced market.

About Matthew Gardner

Matthew Gardner - Chief Economist for Windermere Real Estate

As Chief Economist for Windermere Real Estate, Matthew Gardner is responsible for analyzing and interpreting economic data and its impact on the real estate market on both a local and national level. Matthew has over 30 years of professional experience both in the U.S. and U.K.

In addition to his day-to-day responsibilities, Matthew sits on the Washington State Governors Council of Economic Advisors; chairs the Board of Trustees at the Washington Center for Real Estate Research at the University of Washington; and is an Advisory Board Member at the Runstad Center for Real Estate Studies at the University of Washington where he also lectures in real estate economics.