
 Facebook
 X
X
 Pinterest
 Copy Link

The following analysis of select counties of the Northern California real estate market is provided by Windermere Real Estate Chief Economist Matthew Gardner. We hope that this information may assist you with making better-informed real estate decisions. For further information about the housing market in your area, please don’t hesitate to contact your Windermere Real Estate agent.
Regional Economic Overview
Over the past 12 months, the Northern California markets covered in this report added 184,600 jobs. With decent job growth, the unemployment rate fell to 2.4%, which is a significant drop from the 5.8% rate we saw a year ago. The lowest jobless rate was in Santa Clara County (1.8%), and the highest rate was in Solano County, where 3.5% of the workforce remains unemployed.
Northern California Home Sales
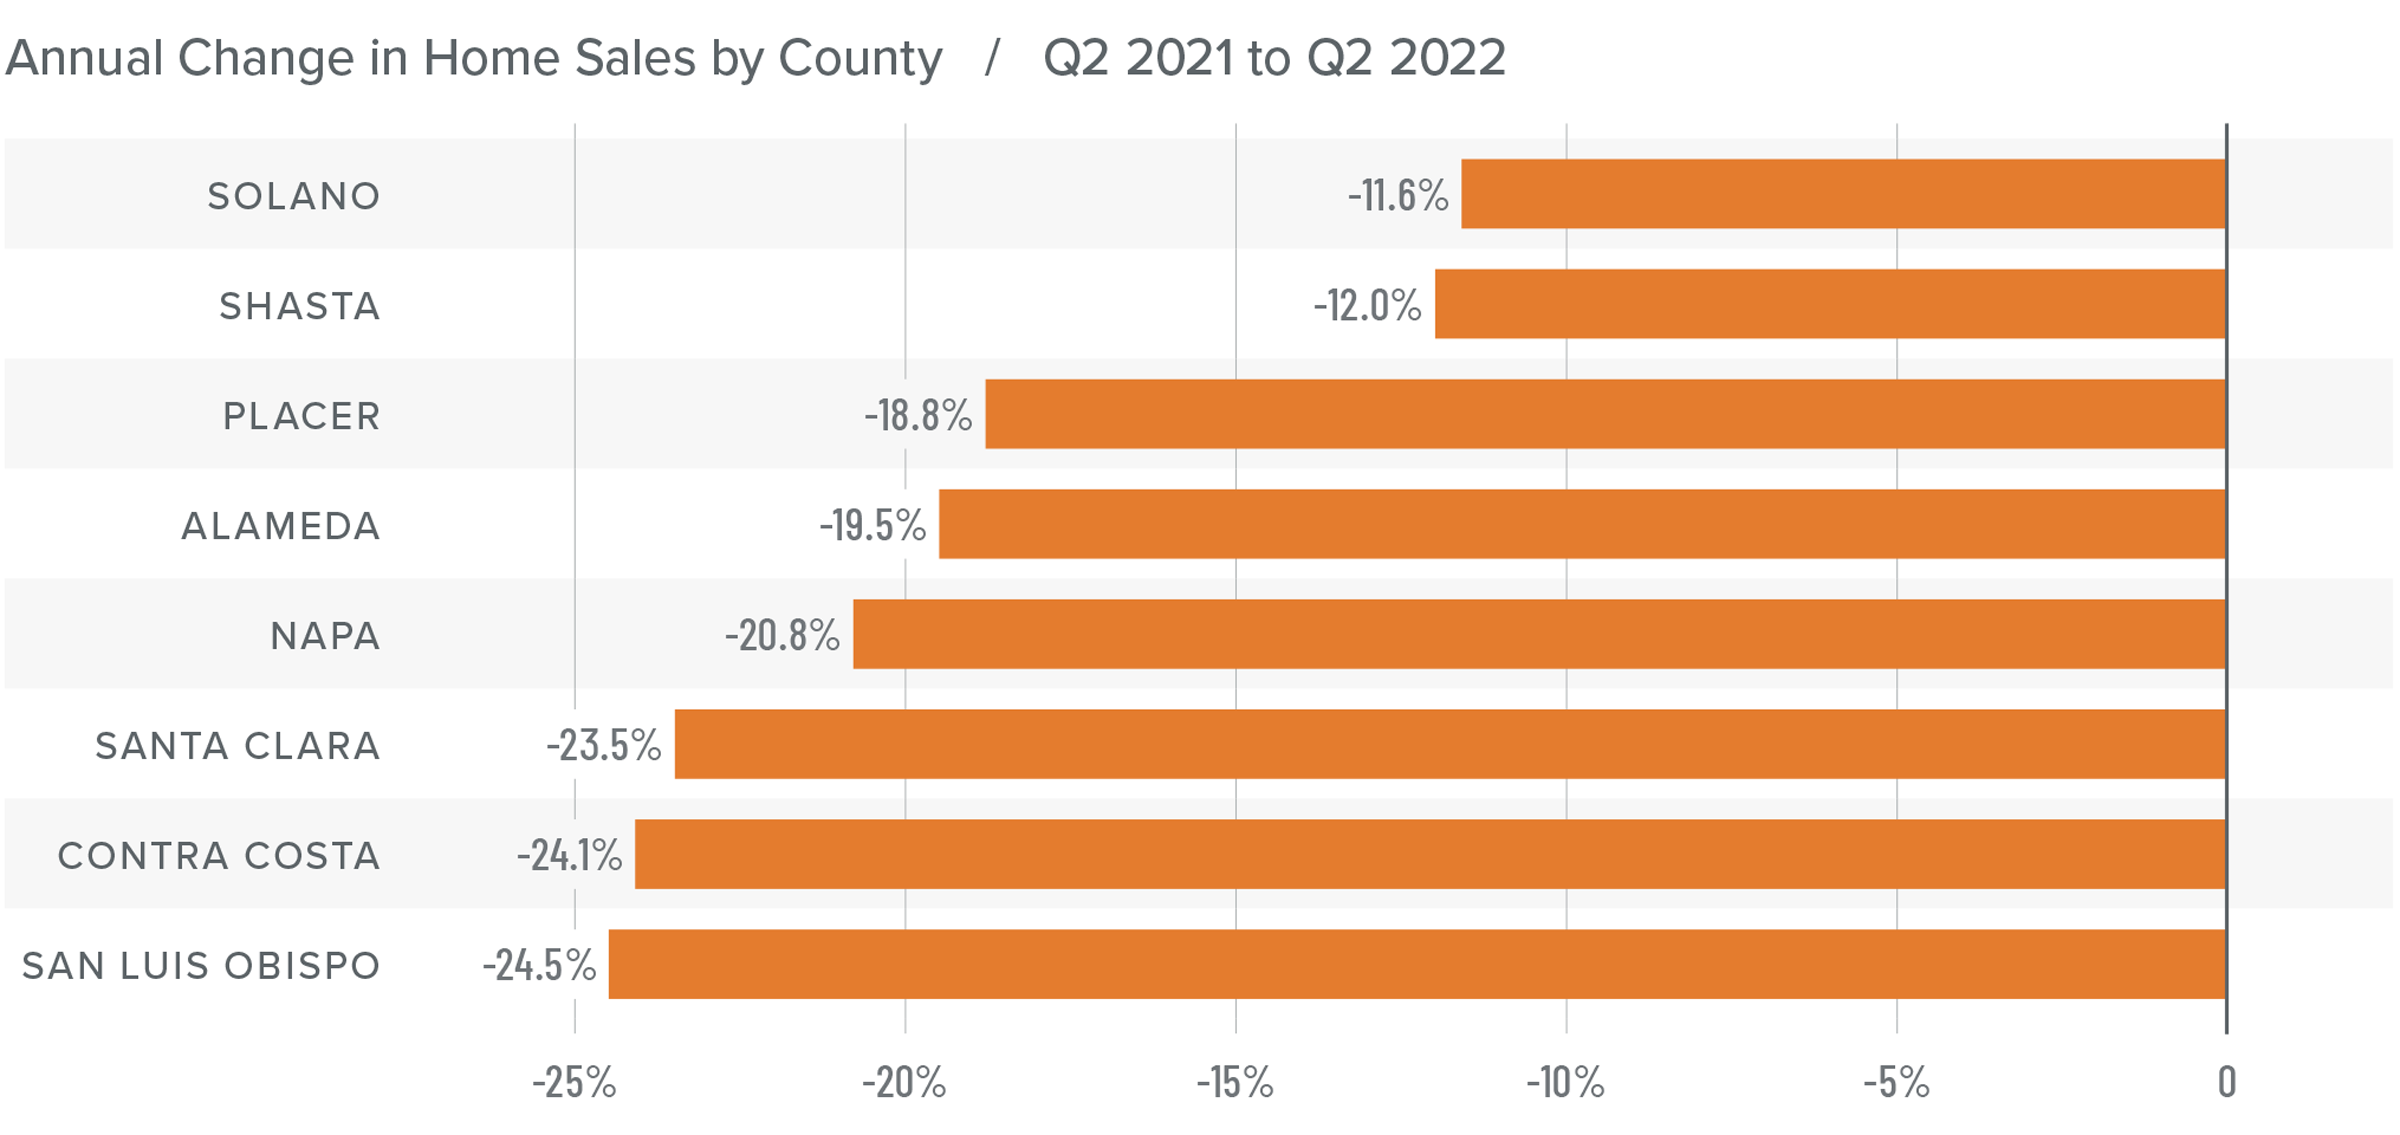
❱ In the second quarter of 2022, 14,235 homes sold, which is a drop of 21.1% compared to a year ago. Sales rose an impressive 37.6% compared to the first quarter of this year.
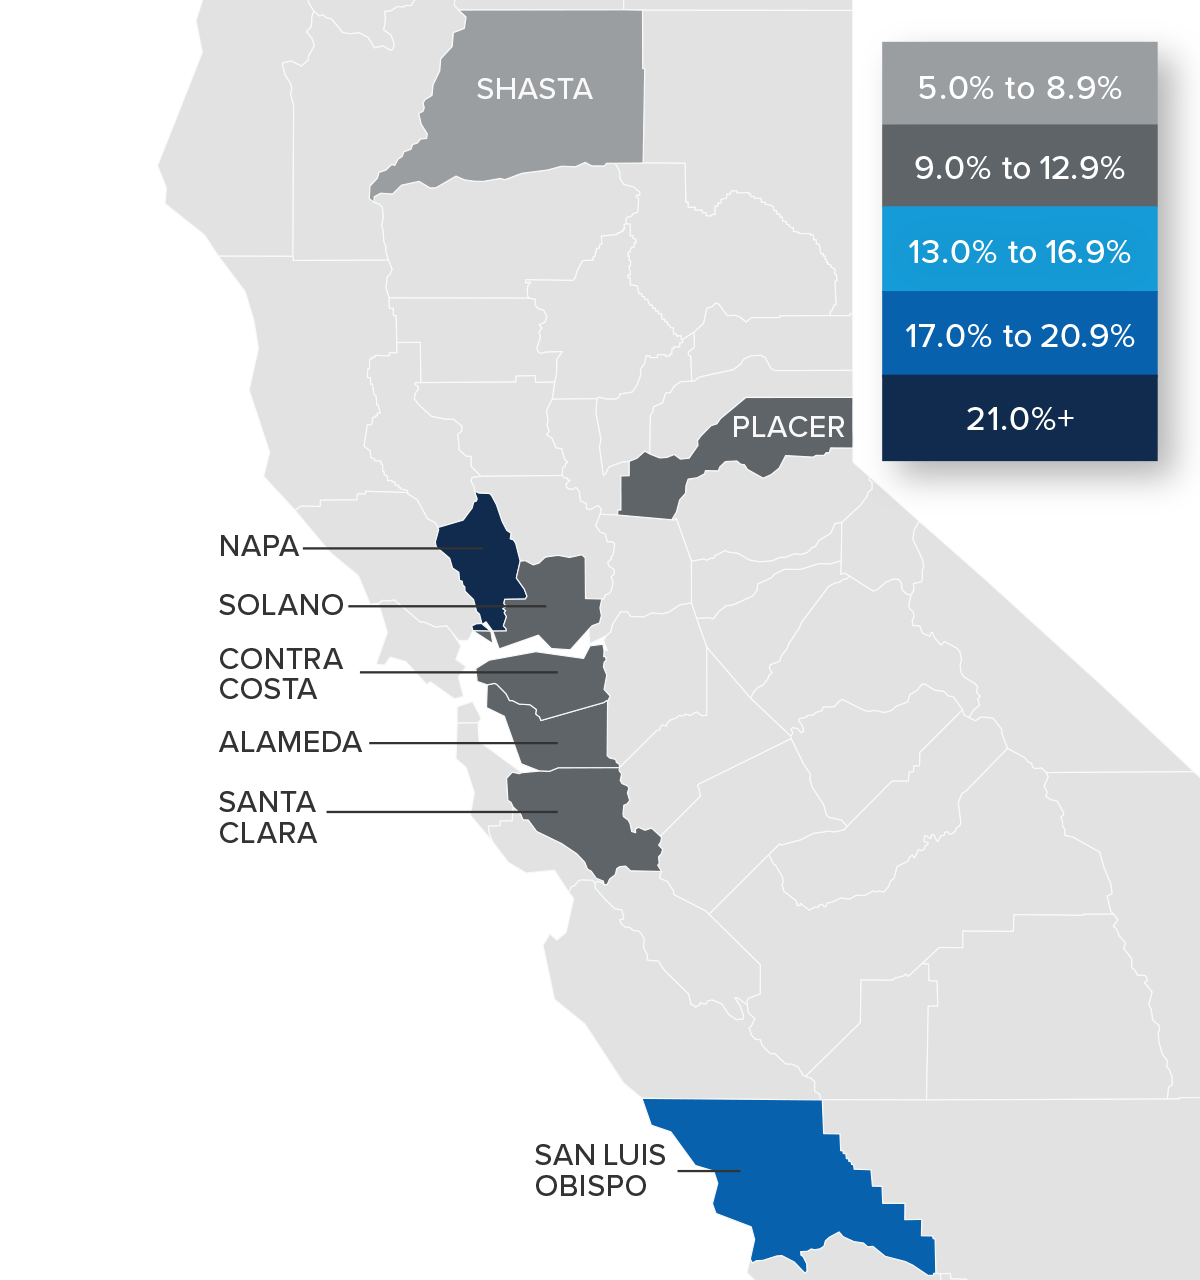
❱ Year over year, sales fell across the board. The largest drop was in San Luis Obispo County. Solano and Shasta counties had fairly modest declines.
❱ The number of homes for sale jumped more than 67% compared to the first quarter of the year. This growth in inventory has caused an impressive rise in sales.
❱ Pending home sales ticked up from the first quarter of 2022, suggesting that we may see some growth in closings in the third quarter of this year.
Northern California Home Prices
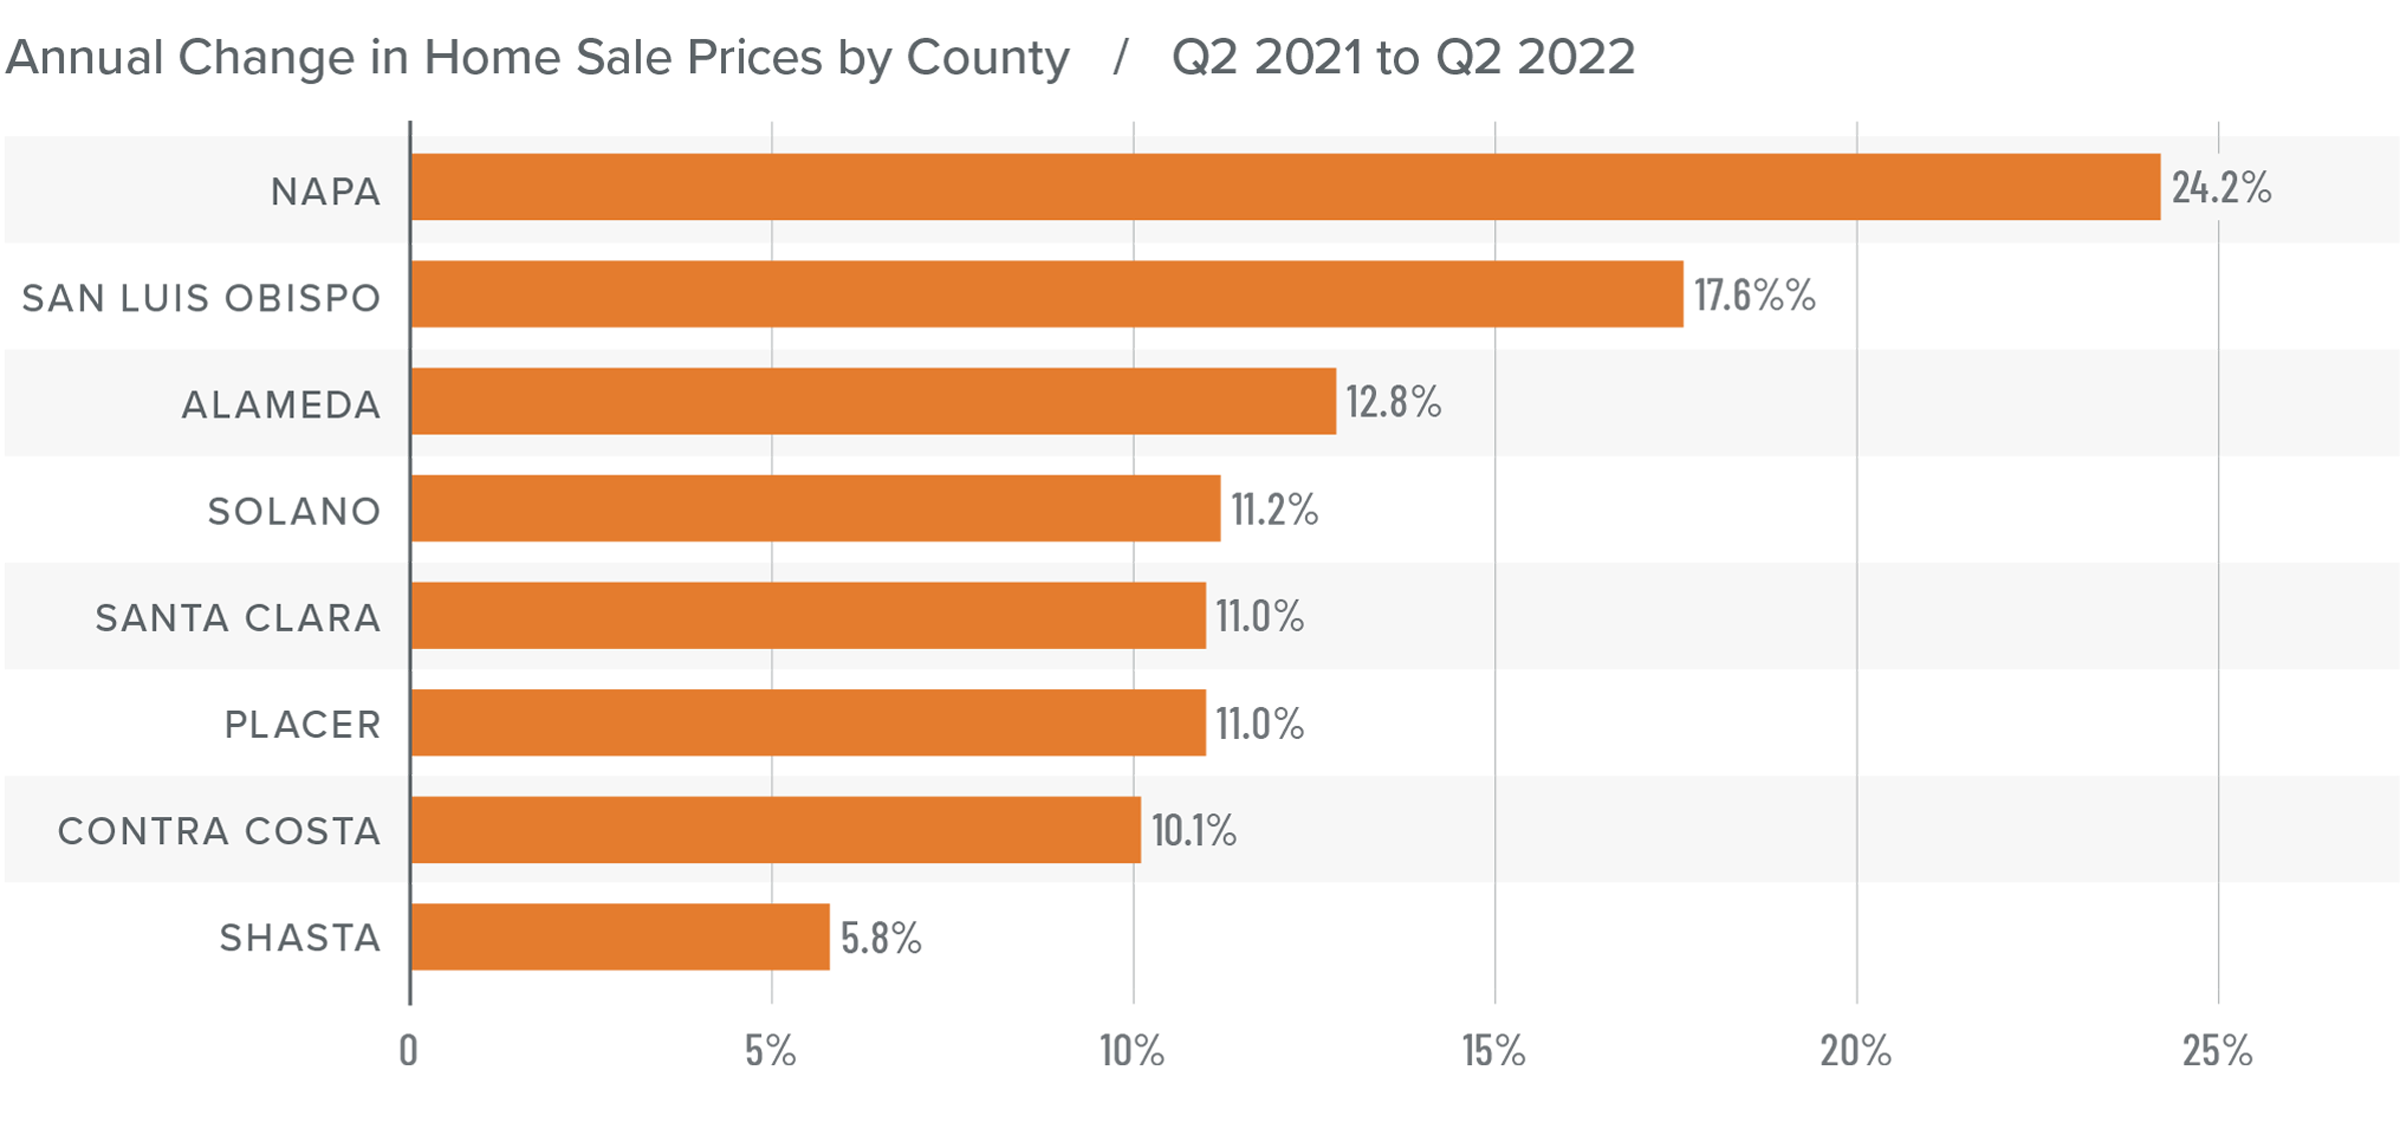
❱ The average home price in the region rose 10.6% from this time last year to $1.35 million. Compared to the final quarter of 2021, prices rose by 11%.
❱ I have started watching list prices, as they will be a leading indicator of whether the market is starting to feel the impacts of declining affordability due to rising financing costs. In the second quarter, the median list price in the region rose an average of 13%. We did see a small drop in Placer County, but I am not overly concerned as it is a fairly small area that can experience unusual swings in both list and sale prices.
❱ Sale prices rose by double digits in all counties other than Shasta compared to a year ago; they were also higher across the region compared to the first quarter of the year.
❱ Even with rising inventory levels and higher financing costs, the market appears to still be buoyant. However, the pace of price growth has slowed, which will likely continue as the area starts to move toward a more balanced market.
Mortgage Rates
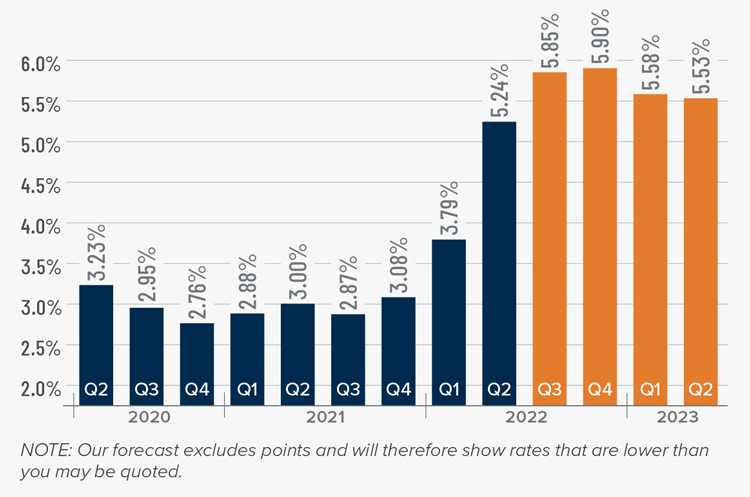
Although mortgage rates did drop in June, the quarterly trend was still moving higher. Inflation—the bane of bonds and, therefore, mortgage rates—has yet to slow, which is putting upward pressure on financing costs.
That said, there are some signs that inflation is starting to soften and if this starts to show in upcoming Consumer Price Index numbers then rates will likely find a ceiling. I am hopeful this will be the case at some point in the third quarter, which is reflected in my forecast.
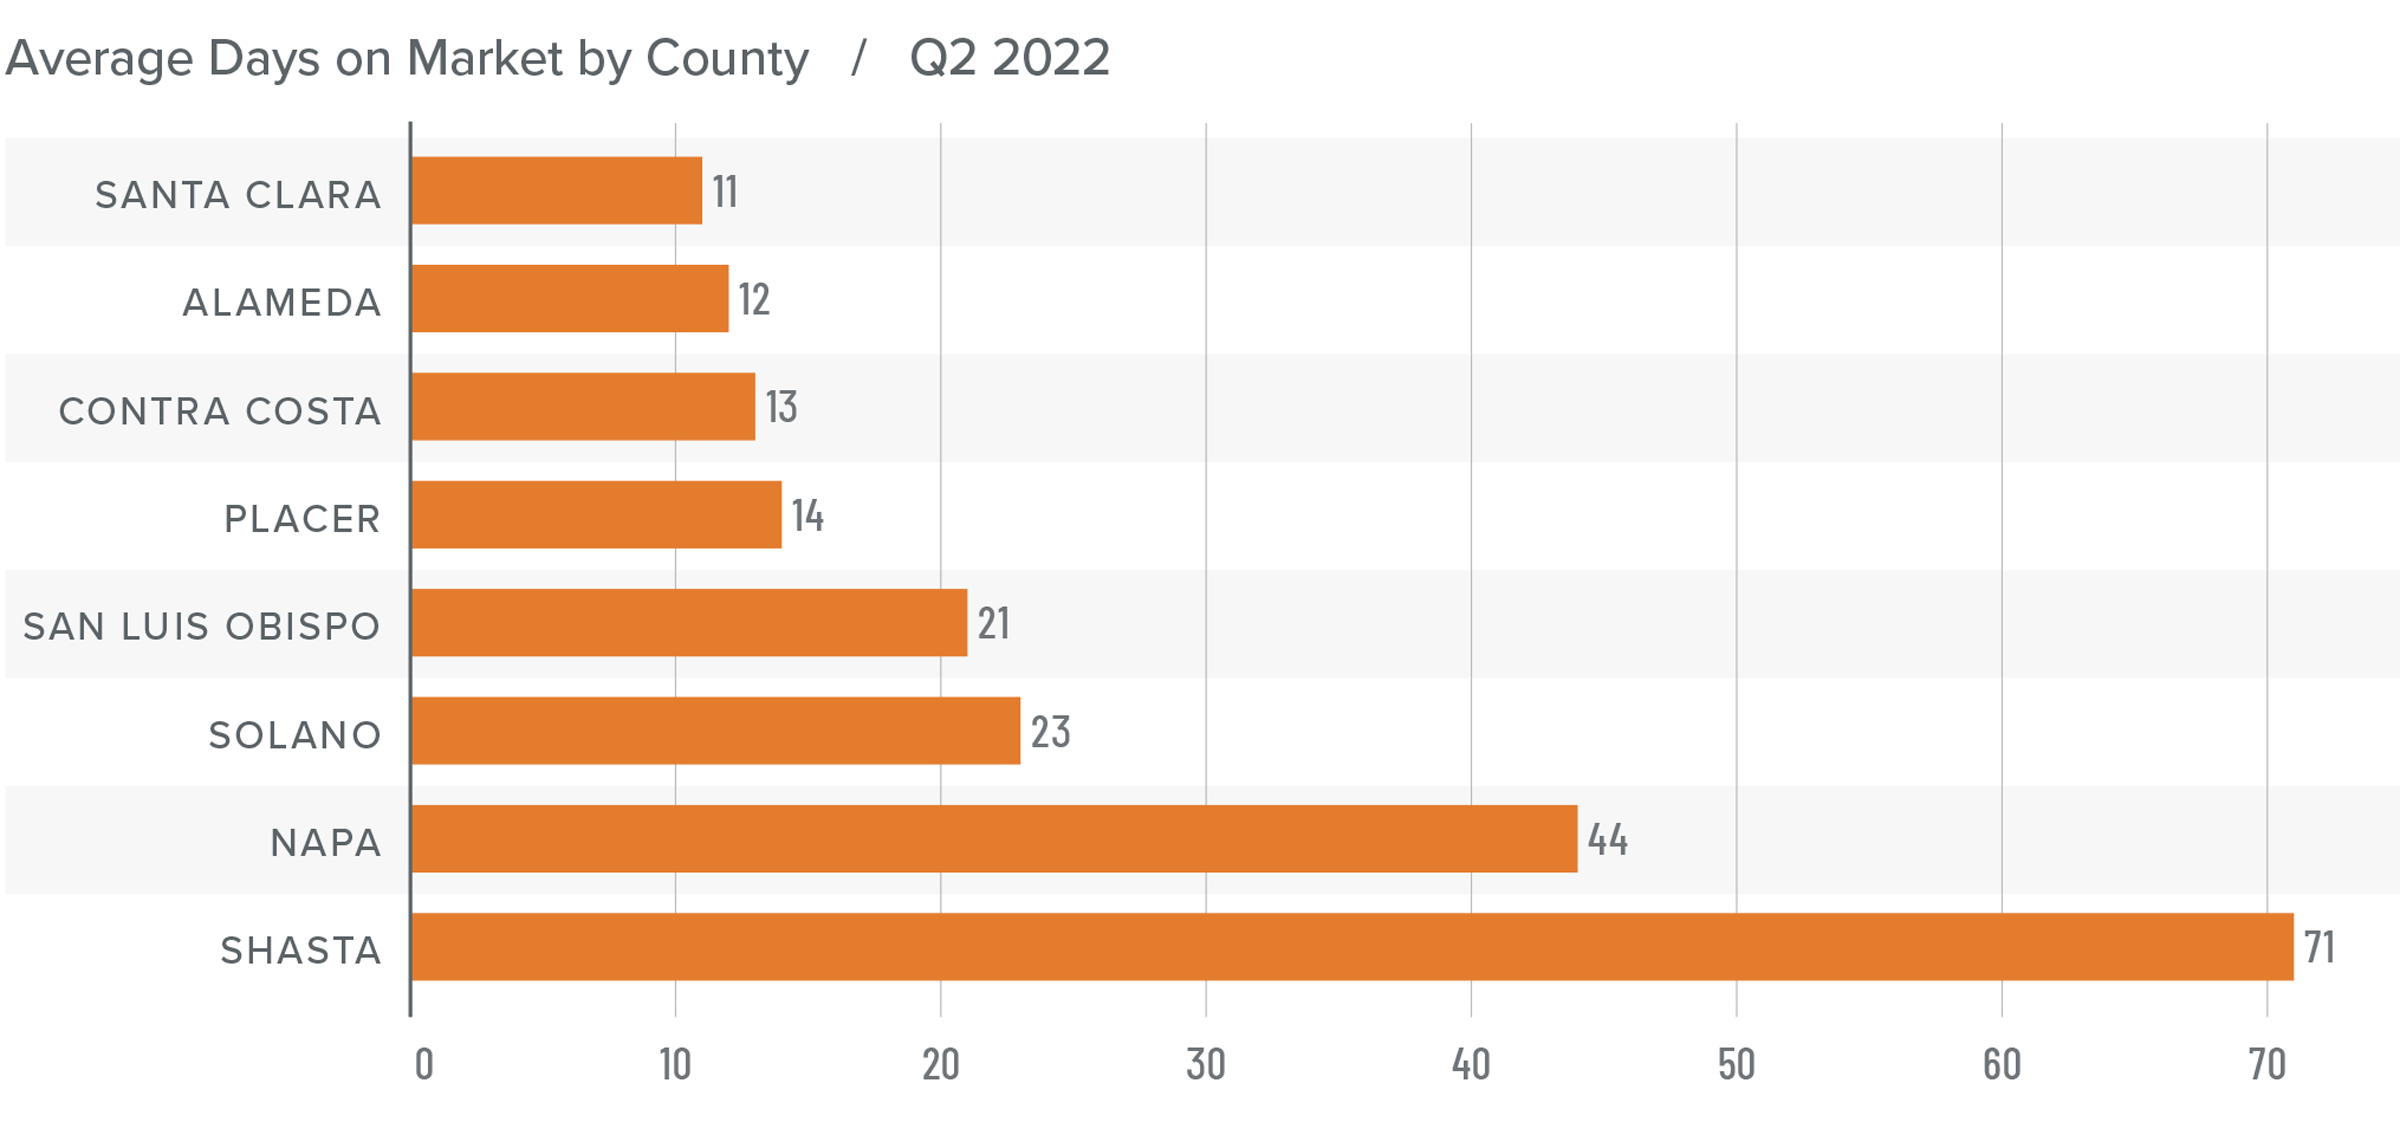
Northern California Days on Market
❱ The average time it took to sell a home in the Northern California counties in this report dropped two days compared to the second quarter of 2021.
❱ The amount of time it took to sell a home fell in Napa, Santa Clara, San Luis Obispo, and Shasta counties, remained static in Alameda and Solano, and rose modestly in Contra Costa and Placer counties. Average market time fell in all counties other than Solano and Shasta compared to the first quarter of 2022.
❱ In the second quarter, it took an average of 26 days to sell a home, which was seven fewer days than in the first quarter of this year.
❱ The greatest drop in market time from a year ago was in Shasta County, where it took seven fewer days to sell a home.
Conclusions
This speedometer reflects the state of the region’s real estate market using housing inventory, price gains, home sales, interest rates, and larger economic factors.
Positive job growth and a growing economy continue to stimulate the housing market, which has led home sales and prices to rise even as mortgage rates and supply levels jumped. Although affordability continues to be a significant issue, there are no indications that a major correction is imminent. However, we are seeing the speed that homes sell starting to slow, as is the pace of price growth. This suggests to me that the market is starting to cool. That said, with average list prices in most counties continuing to rise, sellers remain confident.

All things considered, I have left the needle in the same position as in the first quarter of the year. The market still favors home sellers, but rising inventory levels and slowing price growth suggest they are not in a better position now than they were at the start of the year.
About Matthew Gardner

As Chief Economist for Windermere Real Estate, Matthew Gardner is responsible for analyzing and interpreting economic data and its impact on the real estate market on both a local and national level. Matthew has over 30 years of professional experience both in the U.S. and U.K.
In addition to his day-to-day responsibilities, Matthew sits on the Washington State Governors Council of Economic Advisors; chairs the Board of Trustees at the Washington Center for Real Estate Research at the University of Washington; and is an Advisory Board Member at the Runstad Center for Real Estate Studies at the University of Washington where he also lectures in real estate economics.
")


