
 Facebook
 X
X
 Pinterest
 Copy Link

Once a buyer makes an offer on your house, your goals as a seller are within reach. But before you cross the finish line, the selling process will enter a crucial stage: negotiation. Knowing how to negotiate as a seller will give you confidence as you and your agent work out a deal with the buyer. Various factors will dictate you and your agent’s strategy, but ultimately, you’re looking to get the best price with the best terms for your home.
How to Negotiate Home Price
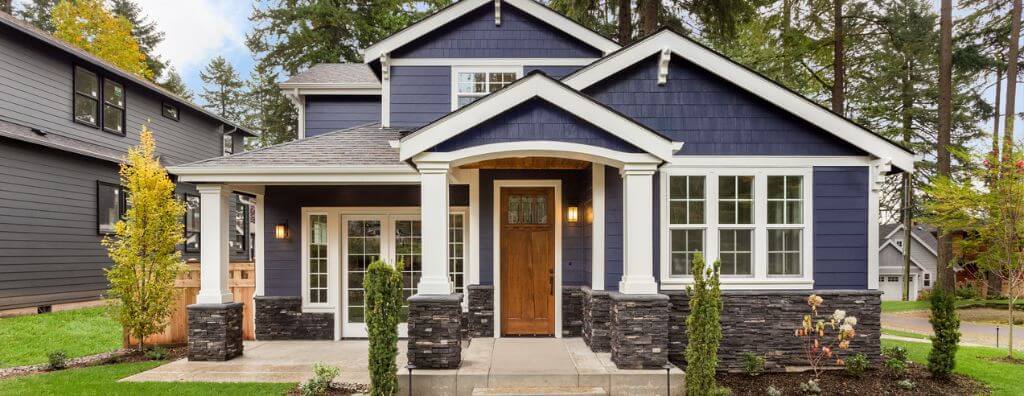
The right offer looks different for everyone, so how should you negotiate with a buyer? It all starts with a fair market price. You can spend some quality time on your own researching home values to get an idea of what your home could be worth. But understanding the full picture requires professional expertise and the ability to conduct in-depth research—qualities you’ll find in your real estate agent.
Your agent’s Comparative Market Analysis (CMA) will competitively price your home based on comparable listings that have sold in your area recently, which sets the table for negotiations. Your agent will factor in the qualities that make your home unique and which selling points will help it stand out amongst the competition. Selling a home is a numbers game: the more interested buyers, the better your chances of getting the best offer for you. And the more interest you can generate, the better chance you have at starting a bidding war, which could drive up the price of your home significantly.
You have three possible responses to a buyer’s offer: accept it, reject it, or make a counteroffer. If you and your agent are on the same page early on, it will be easier to identify the right response to different offers. You’ll also want to connect with your agent regarding your flexibility on price. Remember that there are layers to each offer; there’s the price, of course, but there are also contingencies, moving timelines, and other additional factors at play. It’s the totality of a buyer’s offer that makes it the right one for you.
For example, one buyer may offer less than another but they are willing to waive contingencies to speed things up. A more streamlined purchase process may be more appealing to you, depending on how quickly you’re looking to move into your new home. In this scenario, that final number of the winning offer ends up looking a lot different than you may have previously thought, all things considered.

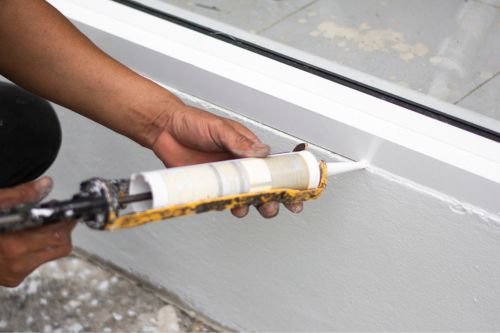
Image Source: Getty Images – Image Credit: ChayTee
Real Estate Negotiation: Local Market Conditions
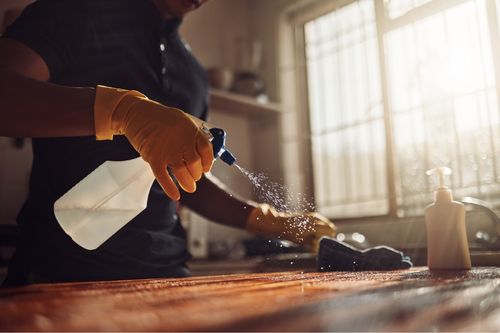
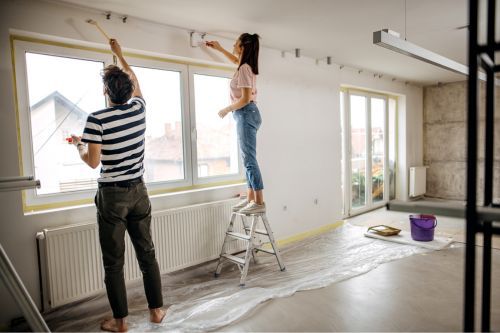
Your local market will also play a role in how you negotiate as a seller. If you’re selling your home in a balanced market, it’s important to approach negotiations with a realistic mindset. There probably won’t be a lot of competition among buyers and bidding wars aren’t as common. However, that’s all the more reason to make your home stand out amongst other listings in your area. Consider investing in projects that can boost home value like high ROI remodels. If you’re in the midst of a buyer’s market or a seller’s market, those conditions will determine who has leverage heading into negotiations, meaning you and your agent will need to work together to strategize accordingly.
Tips for Negotiating Real Estate
It pays to stay calm and remain flexible during this stage of the selling process. This helps to create a positive environment for negotiations and can better your chances of reaching an agreement that is mutually beneficial to both parties. And the best part is, your agent’s expertise takes the pressure off your shoulders; your availability and communication will help them get the deal done.
For more information on negotiating as a seller and preparing to sell your home, talk to a local Windermere agent today:

Featured Image Source: Getty Images – Image Credit: jacoblund


")


