
 Facebook
 X
X
 Pinterest
 Copy Link

The following analysis of select counties of the Utah real estate market is provided by Windermere Real Estate Chief Economist Matthew Gardner. We hope that this information may assist you with making better-informed real estate decisions. For further information about the housing market in your area, please don’t hesitate to contact your Windermere Real Estate agent.
Regional Economic Overview
Utah’s economy continues to add jobs, but the pace of growth has started to slow. Over the past 12 months, the state added 43,300 jobs. At an annual rate of 2.6%, this was the slowest pace of growth since the state started recovering jobs post-COVID. The counties covered by this report added more than 35,000 new jobs over the past year, which was also a growth rate of 2.6%. The state’s unemployment rate in November was 2.2%. This was marginally below the rate of the prior year but impressive all the same. It is equally impressive to see that the unemployment rate remained at a very low level even as the state added over 52,400 people to the workforce.
Utah Home Sales
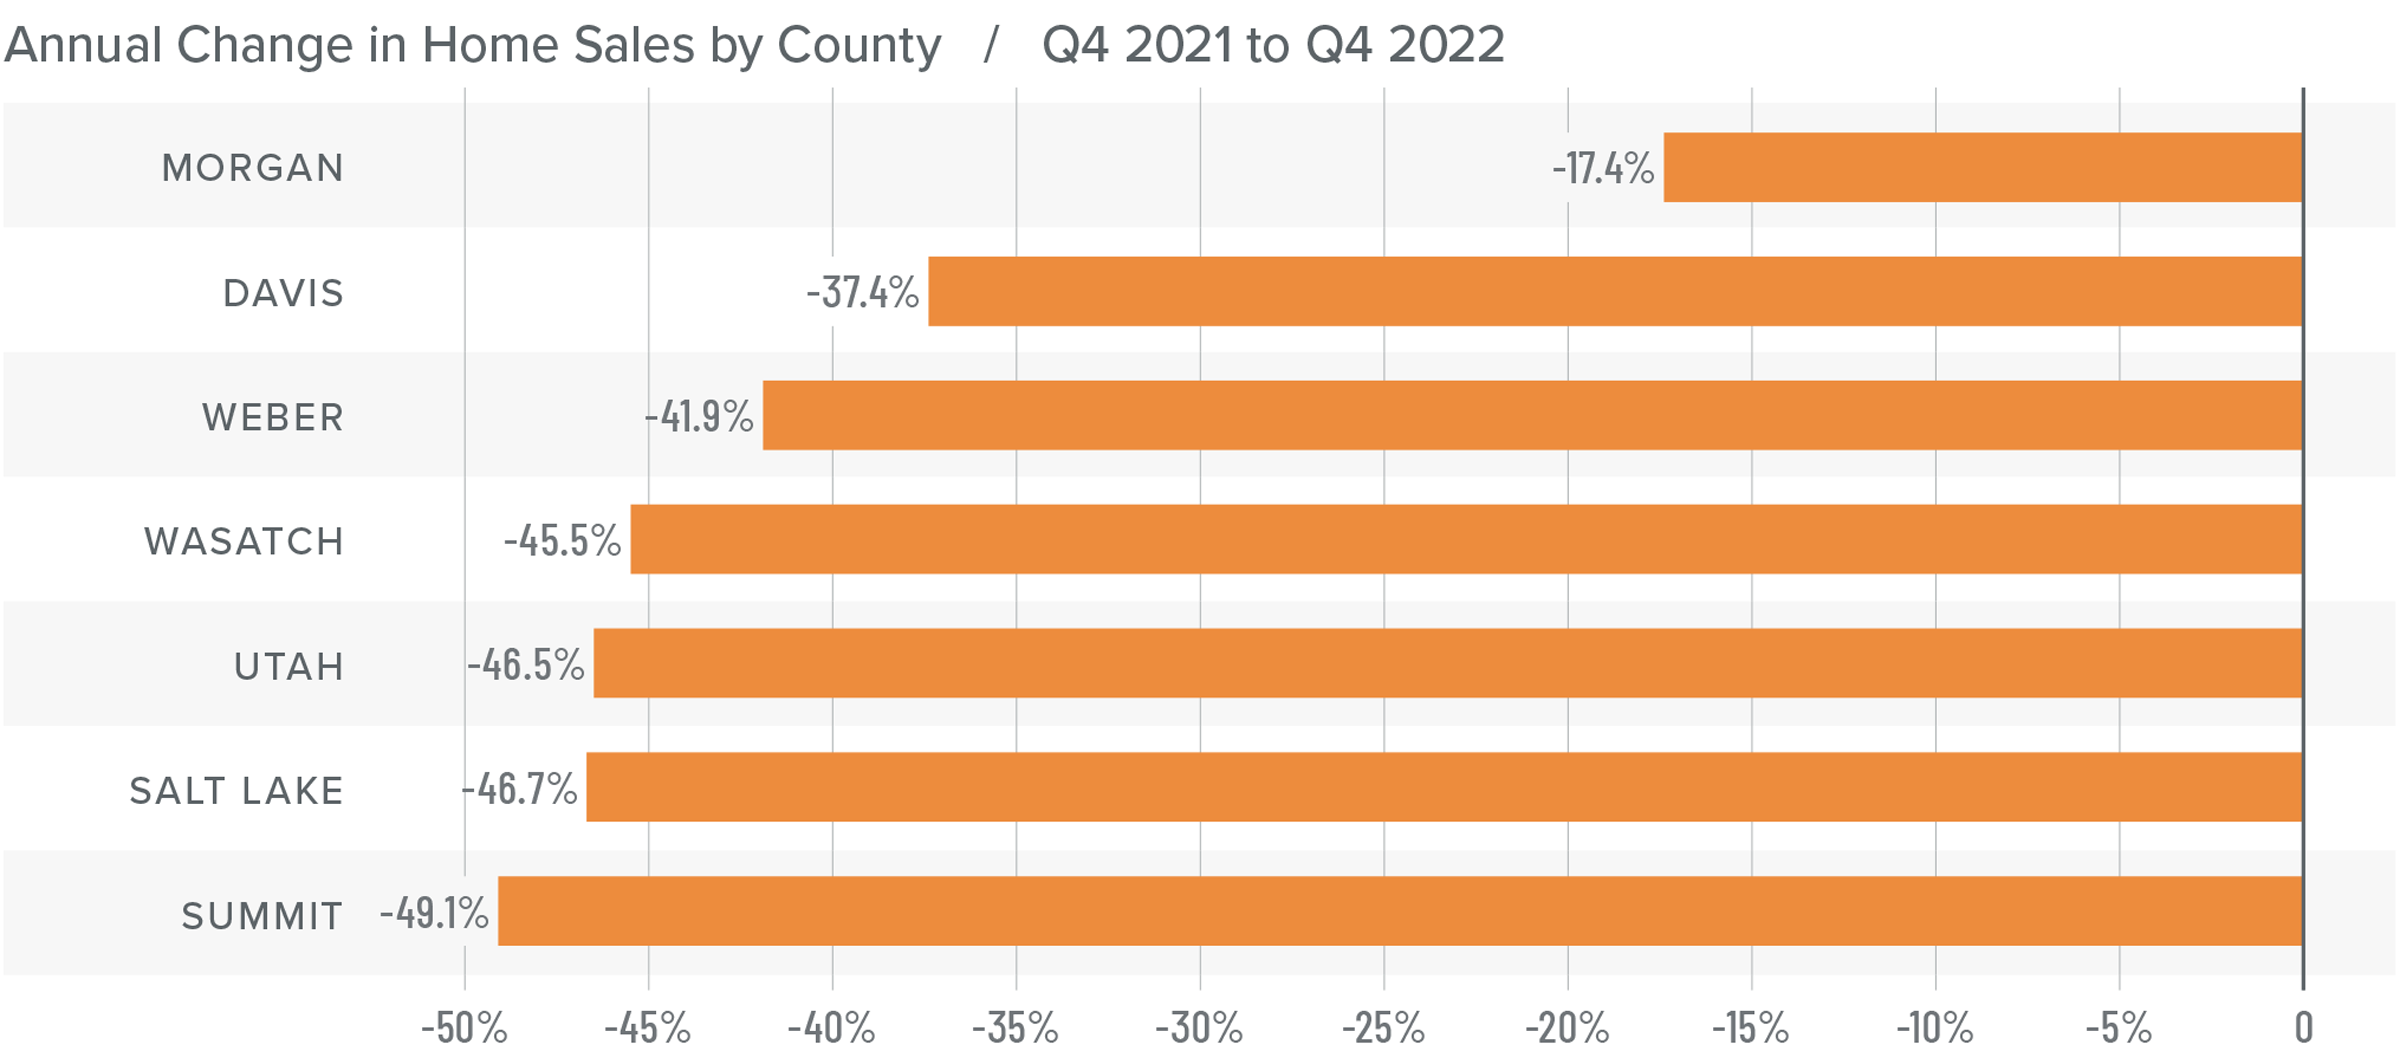
❱ In the final quarter of 2022, 5,145 homes sold in the areas covered by this report. This was down 45% compared to the same period the previous year and down 27.8% compared to the third quarter of 2022.
❱ Sales fell across the board compared to both the fourth quarter of 2021 and the third quarter of 2022.
❱ Inventory levels have skyrocketed, with the average number of homes on the market up a remarkable 248% from the same period in 2021. Listing activity fell 8.3% from the third quarter, but that wasn’t surprising given seasonal factors.
❱ Significantly higher inventory levels gave buyers a lot more options than they have become accustomed to. This, combined with higher mortgage rates, likely impacted sales in the fourth quarter.
Utah Home Prices
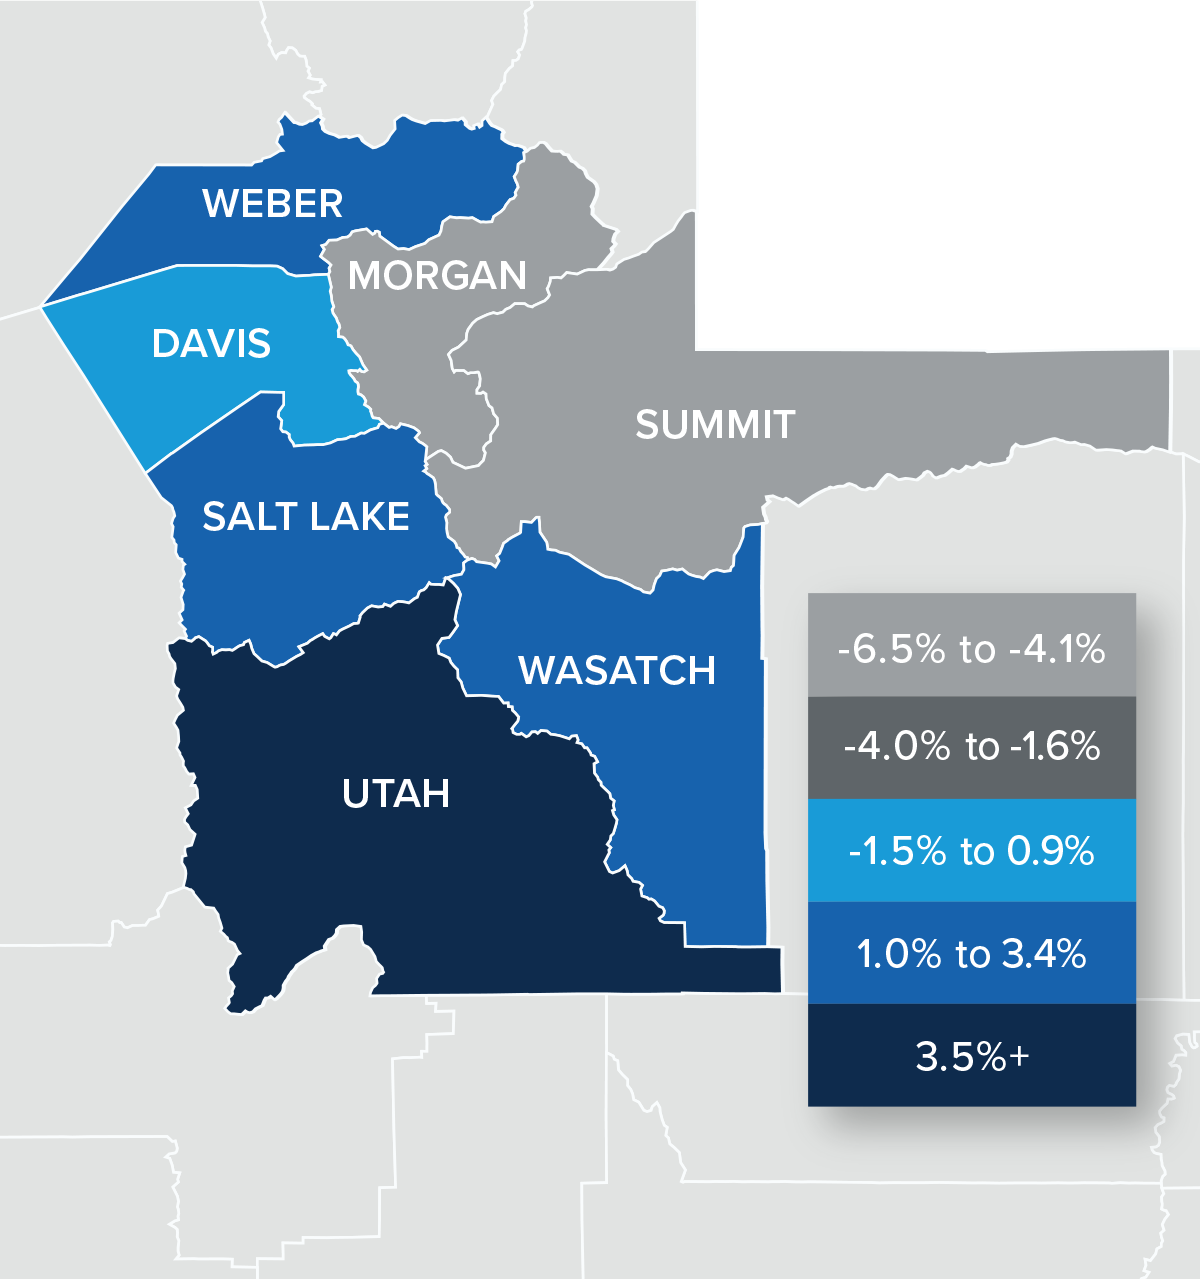
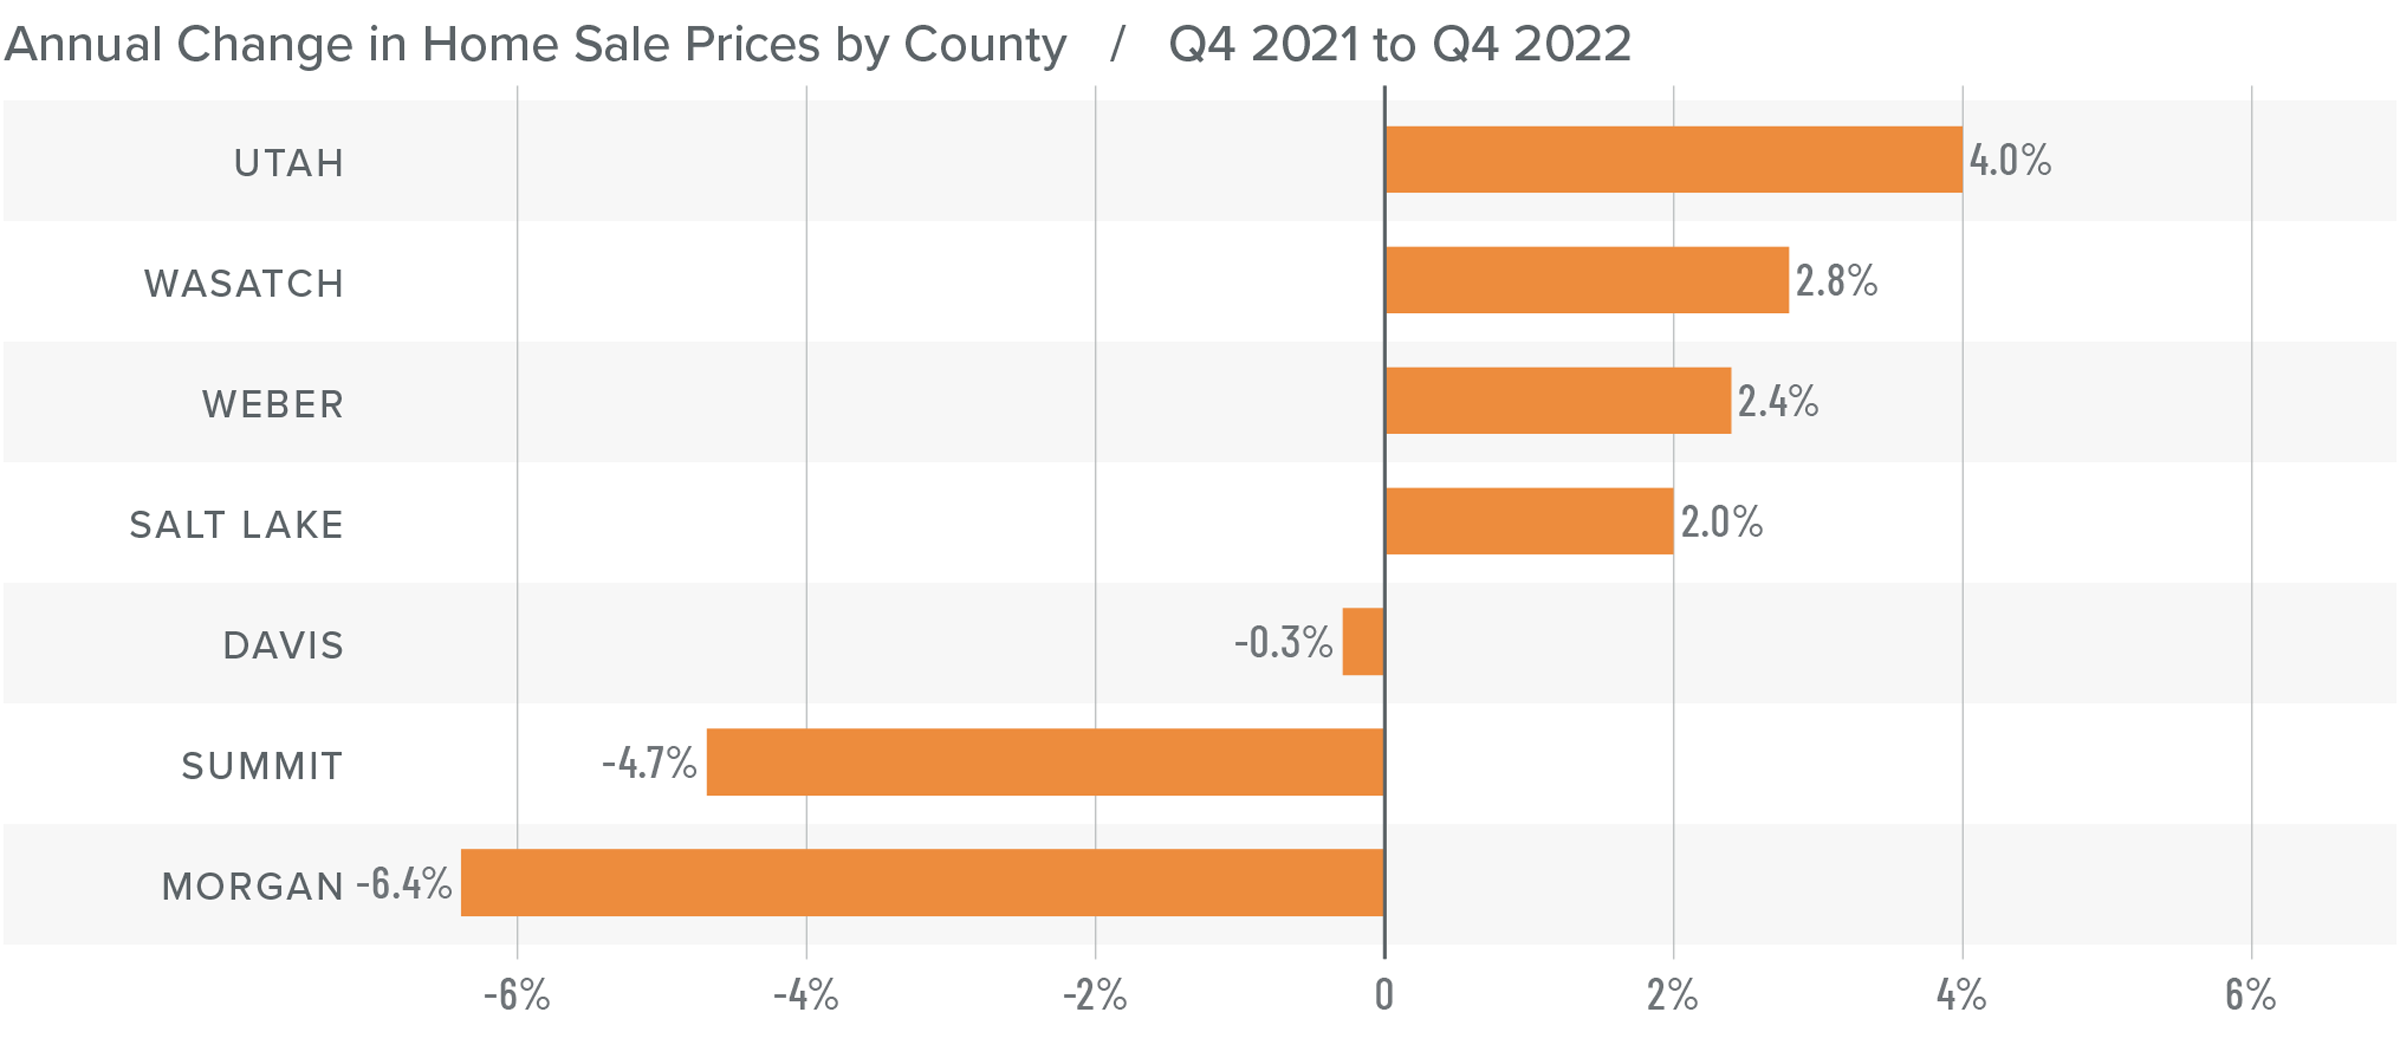
❱ The average sale price in the fourth quarter rose a modest .6% from the fourth quarter of 2021 to $604,105. Prices were 3.7% lower than in the third quarter of 2022.
❱ Median listing prices were 3.6% lower than in the third quarter, suggesting that higher financing costs may have created a price ceiling. That said, listing prices were higher in Morgan, Wasatch, and Summit counties compared to the prior quarter.
❱ Year over year, prices rose in four markets but pulled back in the other three. Compared to the third quarter of 2022, average home prices fell in every area other than Summit County, where they rose .8%.
❱ The bull market that has been in place for quite some time appears to have lost its momentum. I am not concerned by this and expect the market to moderate as it comes to terms with higher financing costs.
Mortgage Rates
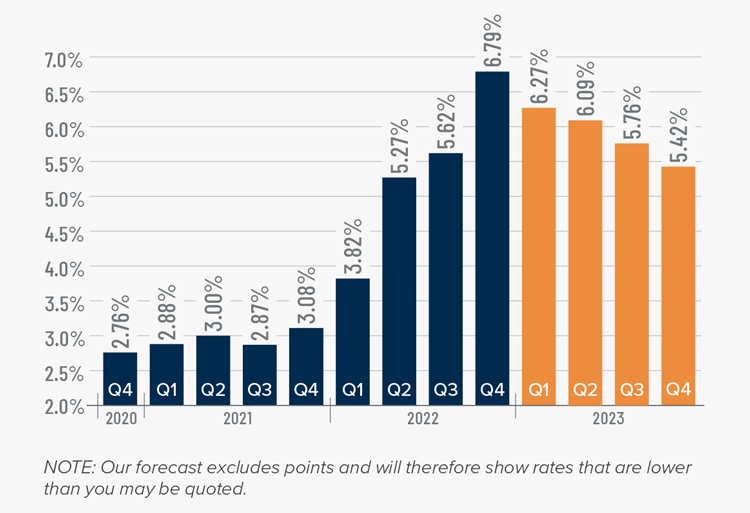
Rates rose dramatically in 2022, but I believe that they have now peaked. Mortgage rates are primarily based on the prices and yields of bonds, and while bonds take cues from several places, they are always impacted by inflation and the economy at large. If inflation continues to fall, as I expect it will, rates will continue to drop.
My current forecast is that mortgage rates will trend lower as we move through the year. While this may be good news for home buyers, rates will still be higher than they have become accustomed to. Even as the cost of borrowing falls, home prices in expensive markets will probably fall a bit more to compensate for rates that will likely hold above 6% until early summer.
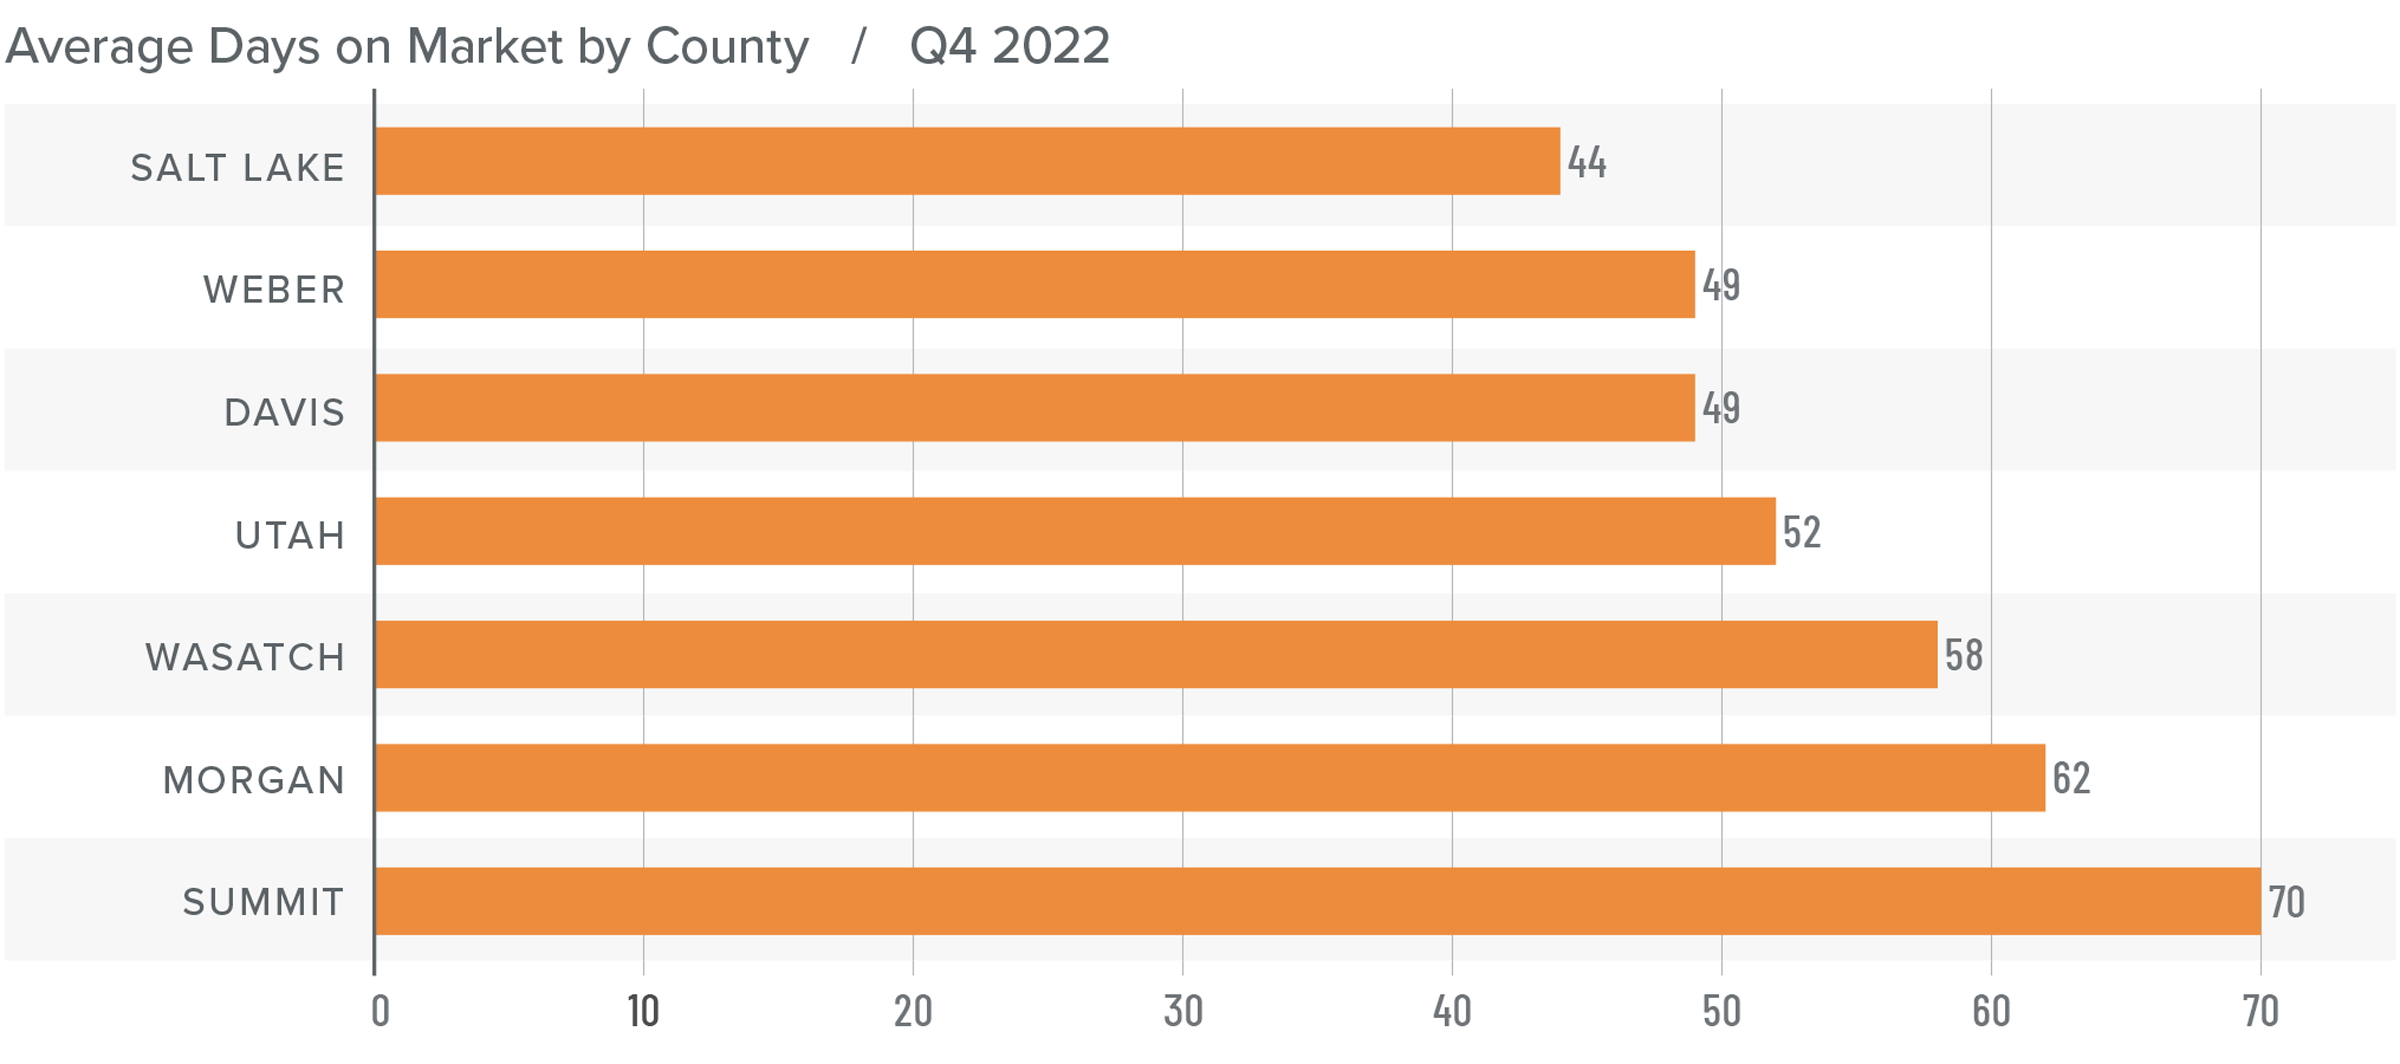
Utah Days on Market
❱ The average time it took to sell a home in the counties covered by this report rose 27 days compared to the same period in 2021.
❱ Homes sold fastest in Salt Lake County and slowest in Summit County. All areas saw average market time rise compared to the third quarter of 2022 as well as the fourth quarter of 2021.
❱ It took an average of 55 days to sell a home during the fourth quarter. Market time rose 22 days from the third quarter of 2022.
❱ It is likely that home buyers are waiting for asking prices to fall further and hoping that mortgage rates do the same.
Conclusions
This speedometer reflects the state of the region’s real estate market using housing inventory, price gains, home sales, interest rates, and larger economic factors.
The state’s economy is still performing very well, but this is not enough to push the housing market forward at the pace we saw during the height of the pandemic. I expect the region will continue to see downward pressure on home prices, but a major correction is unlikely. It’s more likely that as mortgage rates continue to decline, the market will find a solid floor in the summer and prices will resume their upward trend as we move into the fall.

The Utah housing market does not yet significantly favor home buyers but, given the data discussed in this report, it has certainly shifted away from sellers and into neutral territory. I have moved the needle accordingly.
About Matthew Gardner

As Chief Economist for Windermere Real Estate, Matthew Gardner is responsible for analyzing and interpreting economic data and its impact on the real estate market on both a local and national level. Matthew has over 30 years of professional experience both in the U.S. and U.K.
In addition to his day-to-day responsibilities, Matthew sits on the Washington State Governors Council of Economic Advisors; chairs the Board of Trustees at the Washington Center for Real Estate Research at the University of Washington; and is an Advisory Board Member at the Runstad Center for Real Estate Studies at the University of Washington where he also lectures in real estate economics.
")


