
 Facebook
 X
X
 Pinterest
 Copy Link
The following analysis of select counties of the greater Las Vegas real estate market is provided by Windermere Real Estate Chief Economist Matthew Gardner. We hope that this information may assist you with making better-informed real estate decisions. For further information about the housing market in your area, please don’t hesitate to contact your Windermere Real Estate agent.
Regional Economic Overview
The Las Vegas area continues to add new jobs and employment is at its lowest level ever. There are now 1.075 million people working, 50,000 more than a year ago, which represents an annual growth rate of 4.9%. Even with such a robust employment market, the unemployment rate has started to notch just a little higher. This is a function of growth in the labor market as more people look for work. The non-seasonally adjusted unemployment rate in November was 5.6%, up from 5.3% a year ago. The seasonally adjusted rate was 6%, up from 5.7% a year ago.
Nevada Home Sales
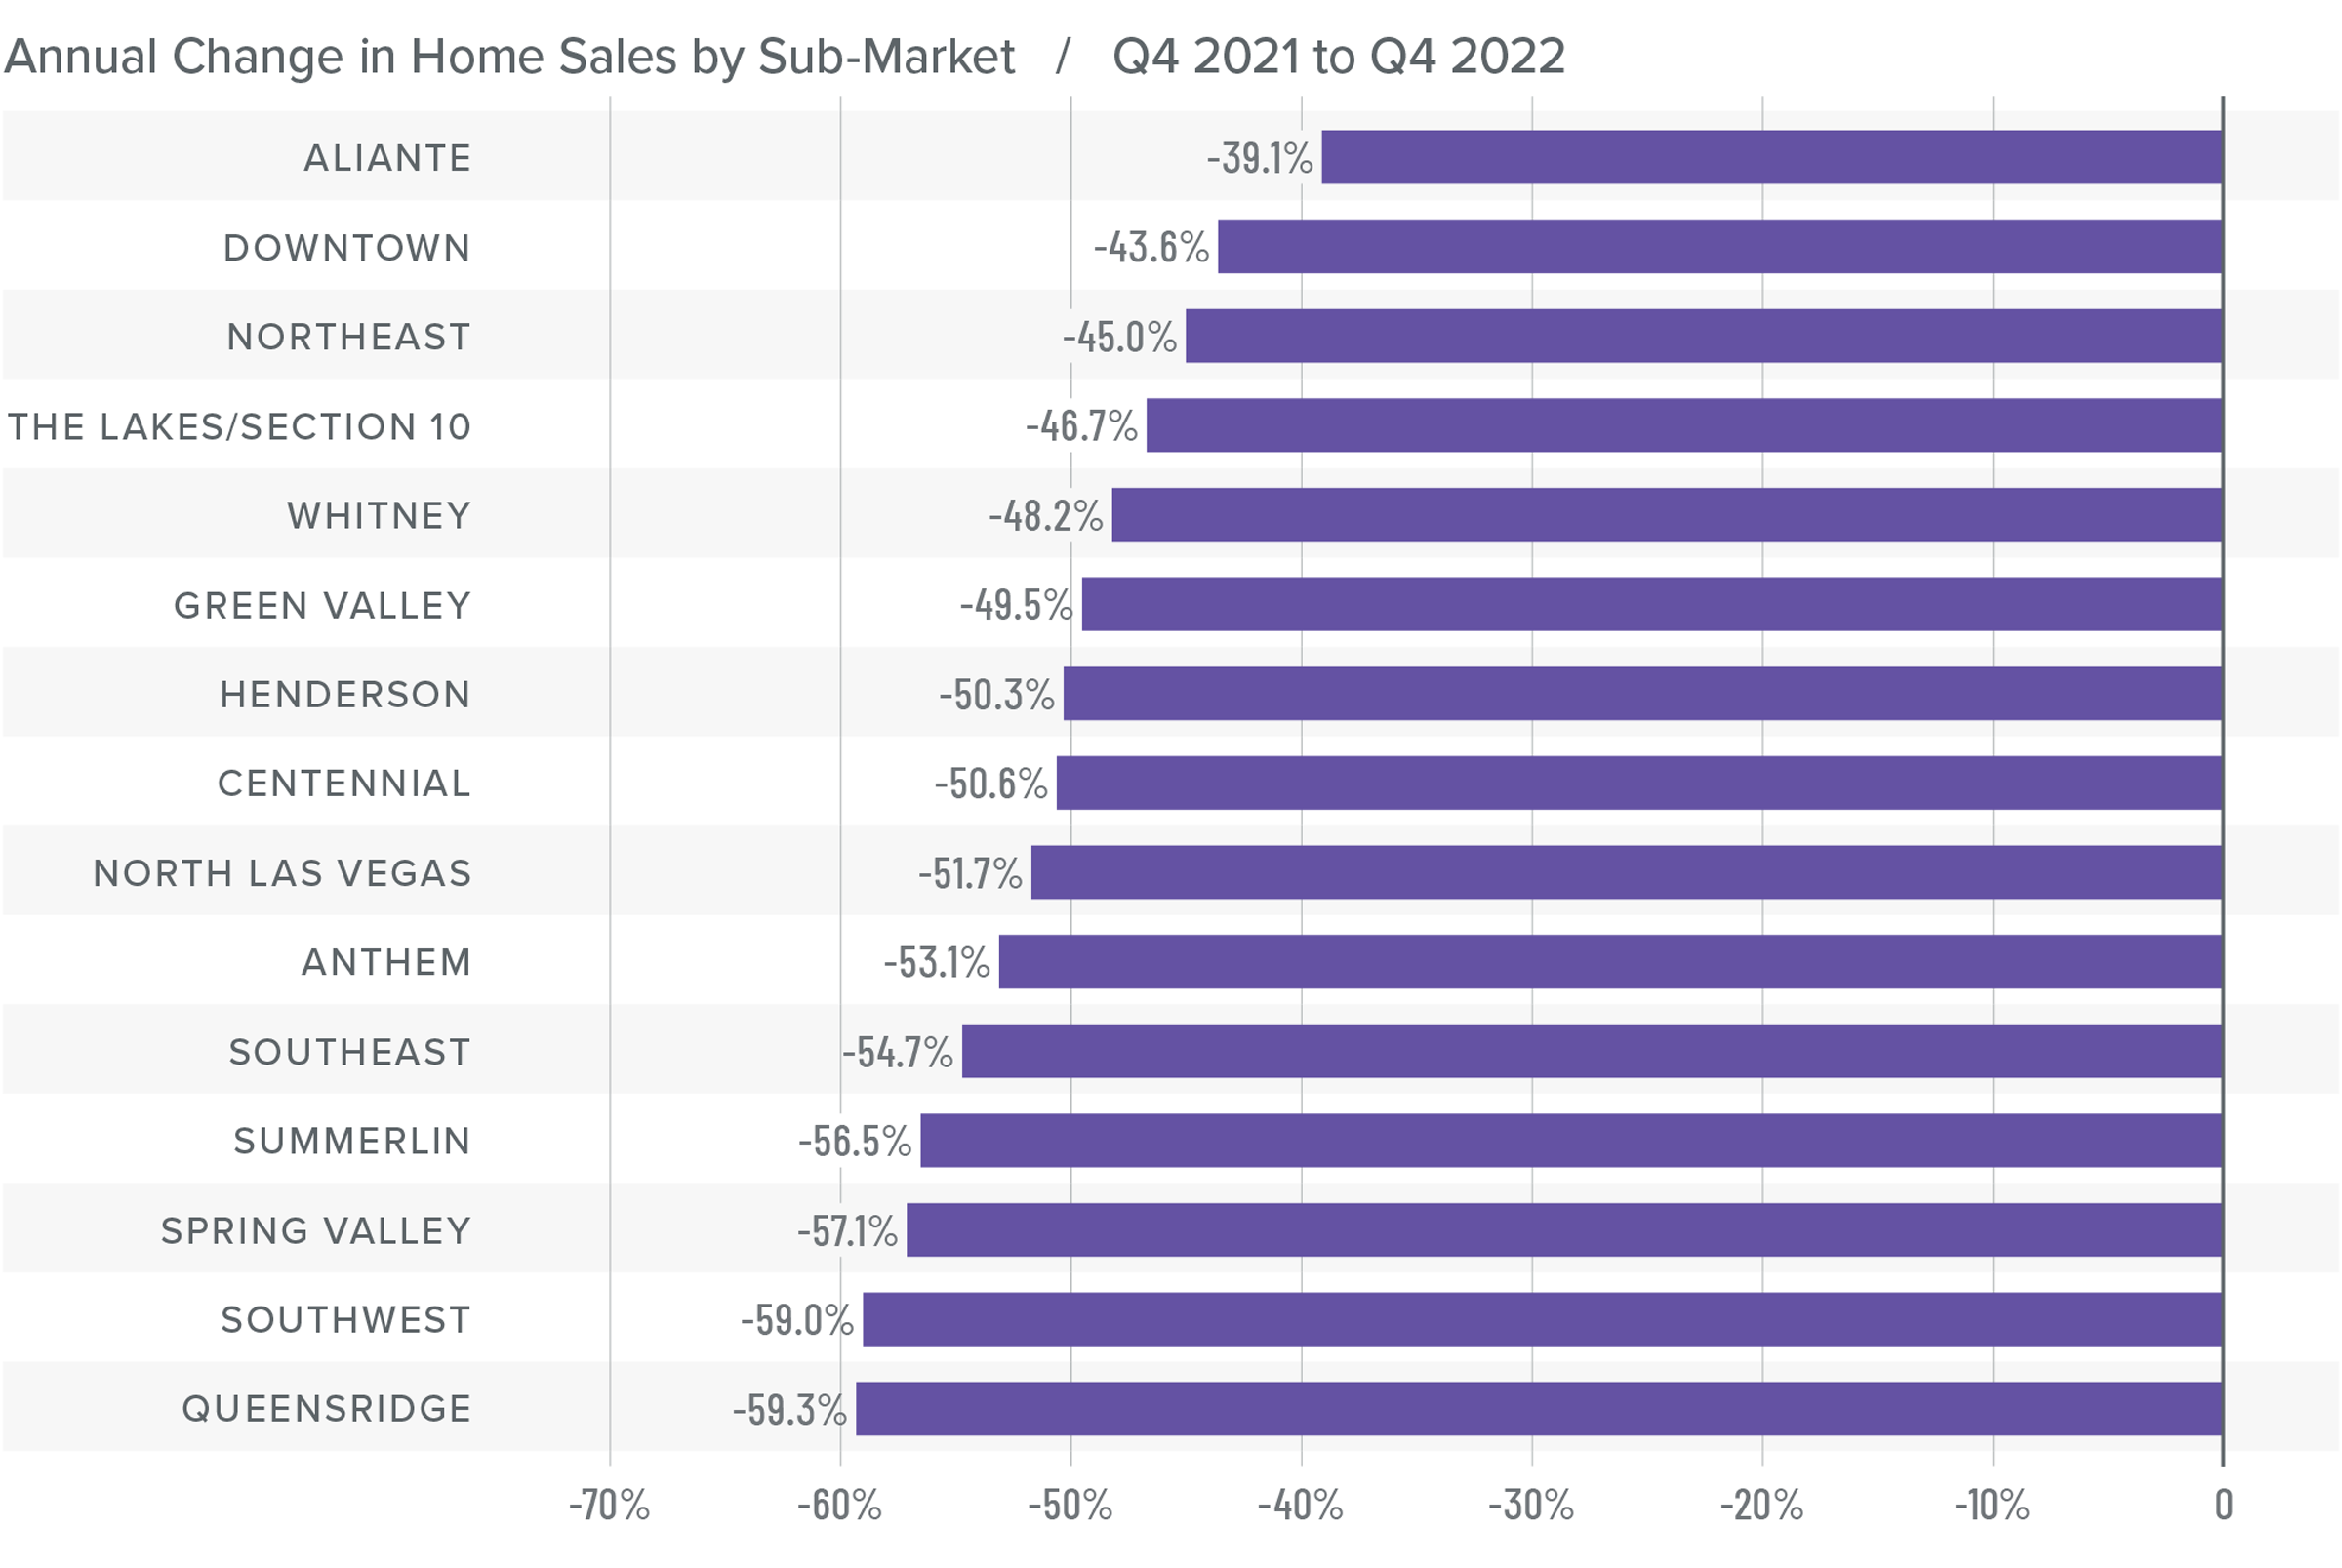
❱ A total of 4,945 homes sold in the final quarter of 2022, which was a drop of 52.4% compared to the fourth quarter of 2021 and down 24.3% from the third quarter of 2022.
❱ Sales fell significantly in every neighborhood covered by this report compared to the same period in 2021. All areas also reported fewer sales than in the third quarter of 2022.
❱ Listing activity continues to grow significantly. The number of homes for sale was up 151% year over year but was down 7.2% from the third quarter of the year.
❱ Pending sales, which are an indicator of future closings, fell 25.3% from the third quarter, suggesting that the market may not see much improvement in the first quarter of 2023.
Nevada Home Prices
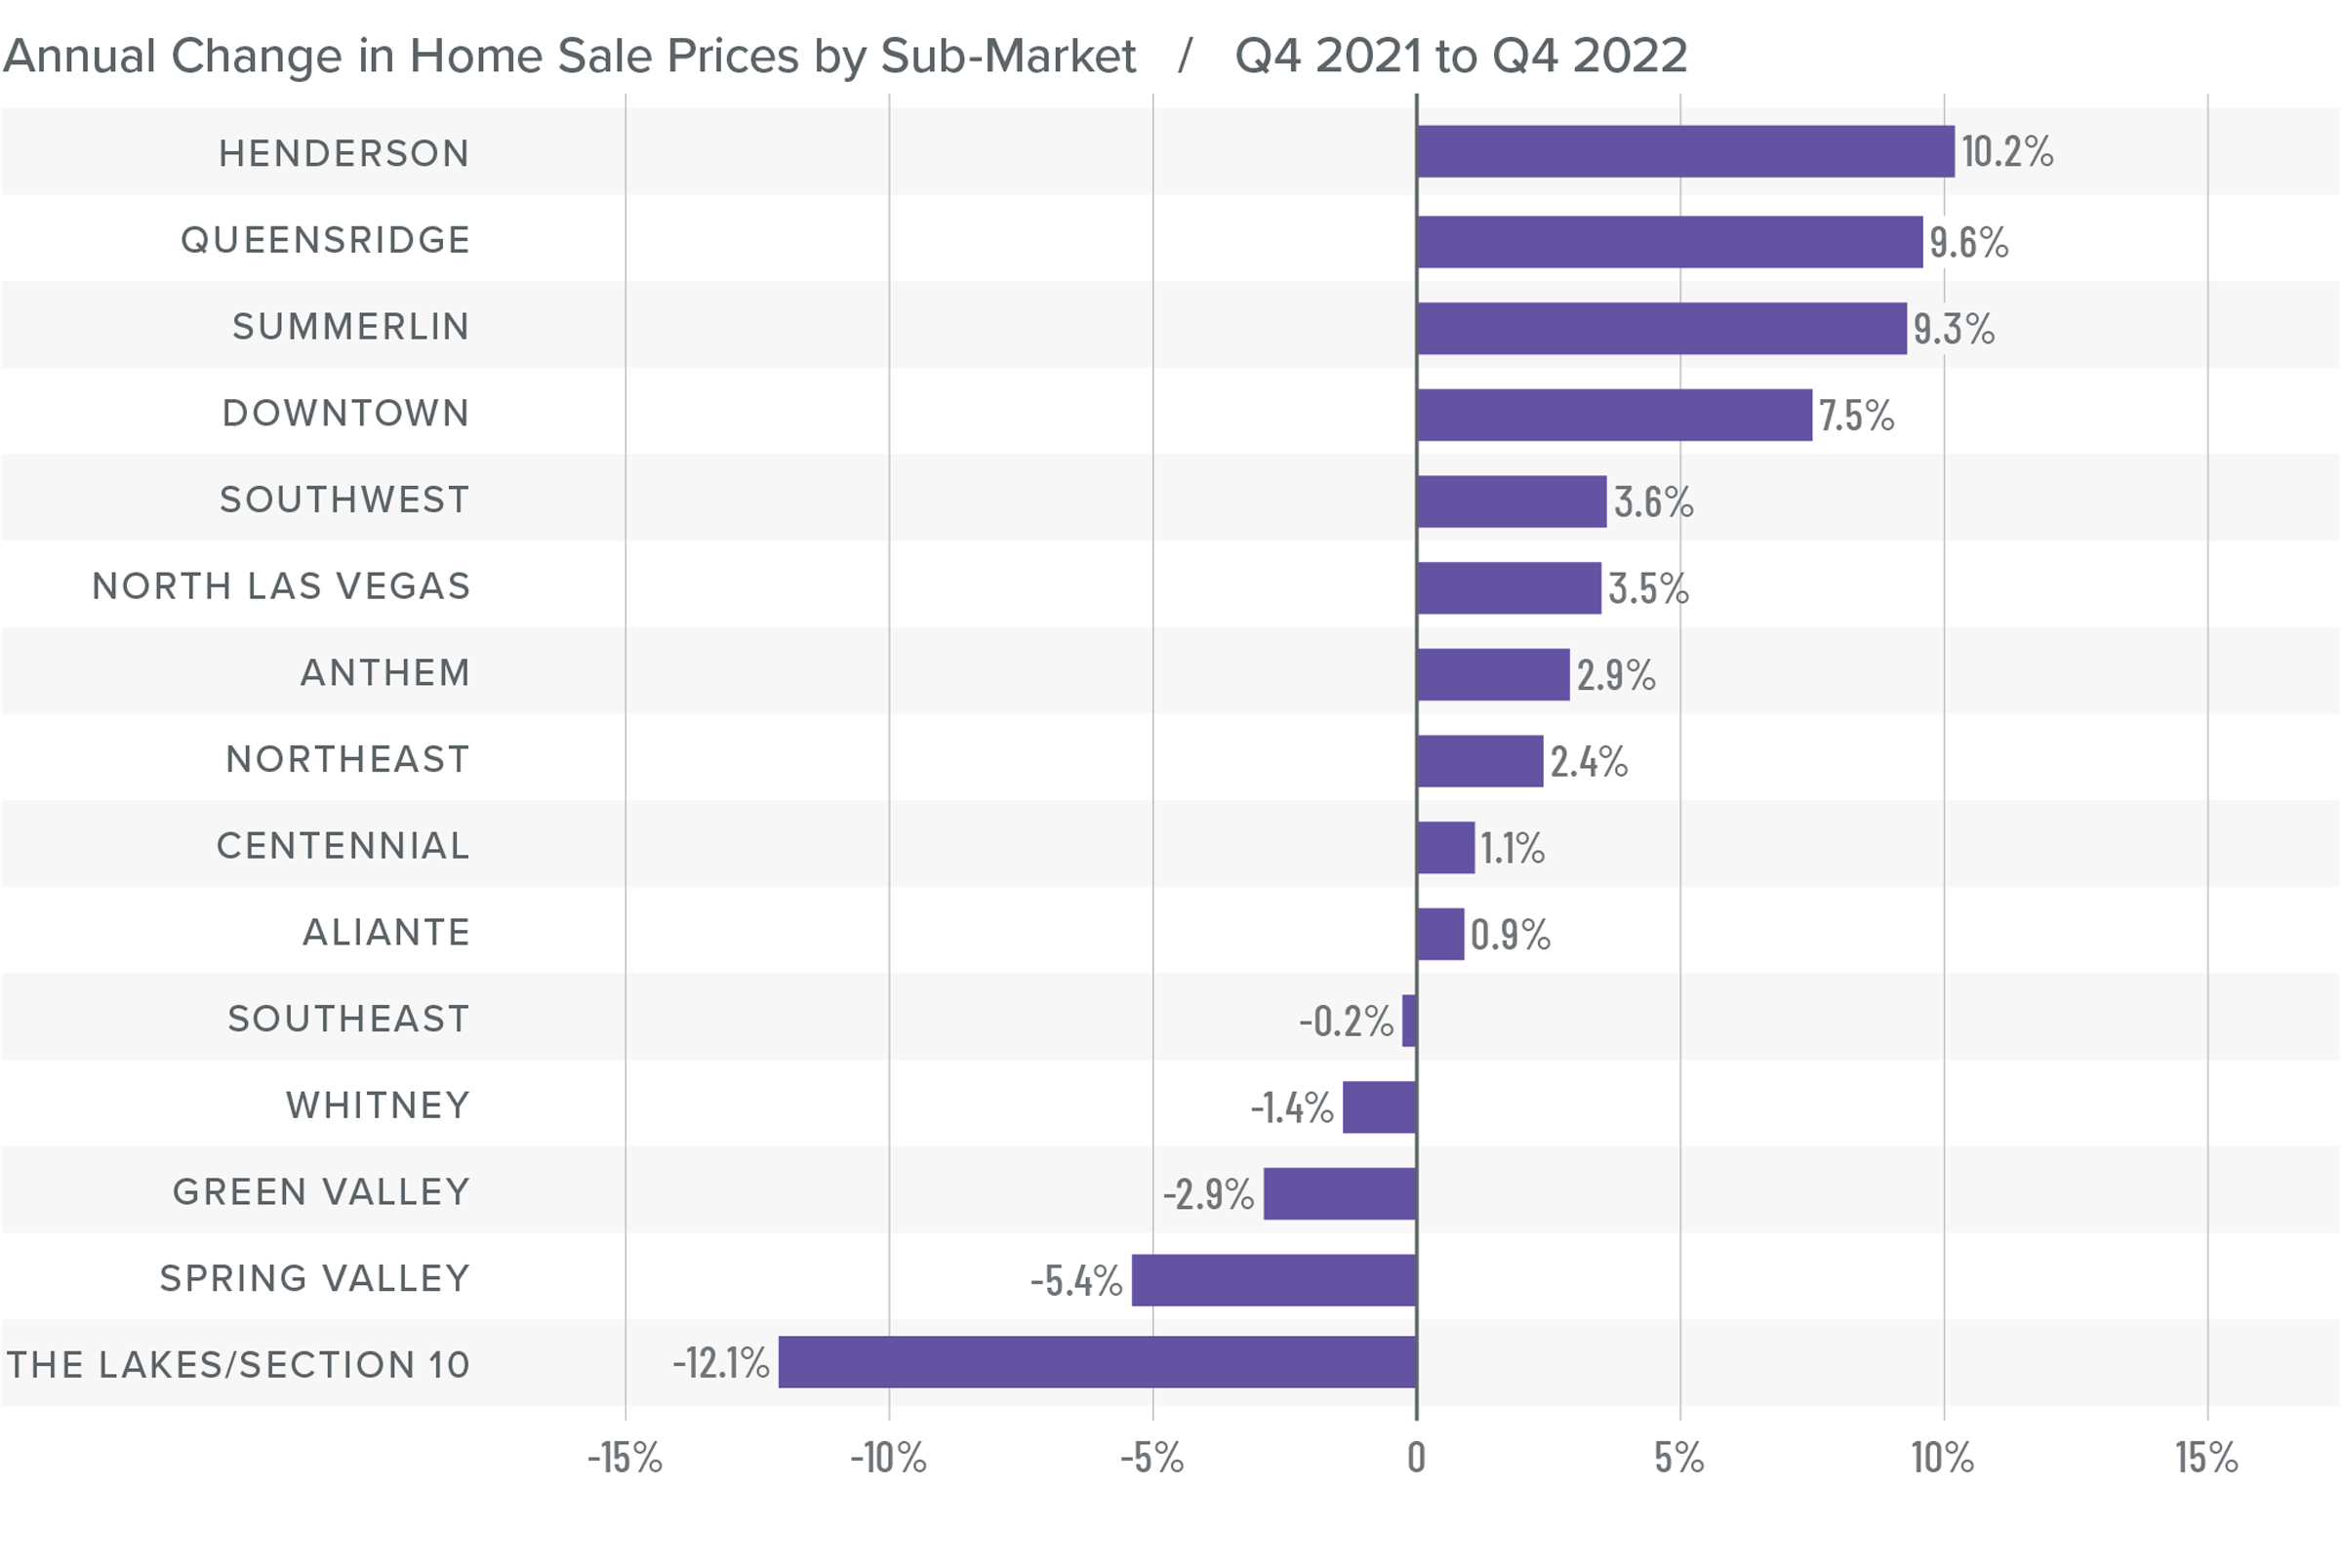
❱ Though there were fewer home sales than during the fourth quarter of 2021, the average sale price was up 2% to $467,794. However, sale prices were down 2.3% from the third quarter of 2022.
❱ Higher financing costs are impacting the number of sales as well as sale prices. Sellers are starting to adjust to this new market reality, as demonstrated by lower median listing prices in all neighborhoods except Aliante when compared to third quarter of 2022.
❱ Year over year, prices rose in ten neighborhoods but fell in the remaining five. Compared to the third quarter of 2022, prices increased in the Henderson, Queens Ridge, and Summerlin neighborhoods, but fell in all other market areas.
❱ The Las Vegas market will likely see home prices fall given higher supply levels and higher mortgage rates, but I don’t think this will result in systemic price declines. Rather, prices will pull back to account for higher mortgage rates before they will then resume growing again, but at a far more modest pace.
Mortgage Rates
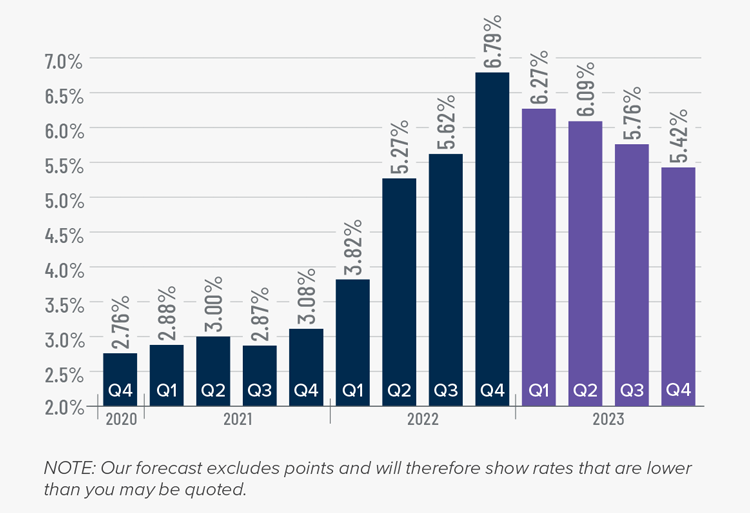
Rates rose dramatically in 2022, but I believe that they have now peaked. Mortgage rates are primarily based on the prices and yields of bonds, and while bonds take cues from several places, they are always impacted by inflation and the economy at large. If inflation continues to fall, as I expect it will, rates will continue to drop.
My current forecast is that mortgage rates will trend lower as we move through the year. While this may be good news for home buyers, rates will still be higher than they have become accustomed to. Even as the cost of borrowing falls, home prices in expensive markets will probably fall a bit more to compensate for rates that will likely hold above 6% until early summer.
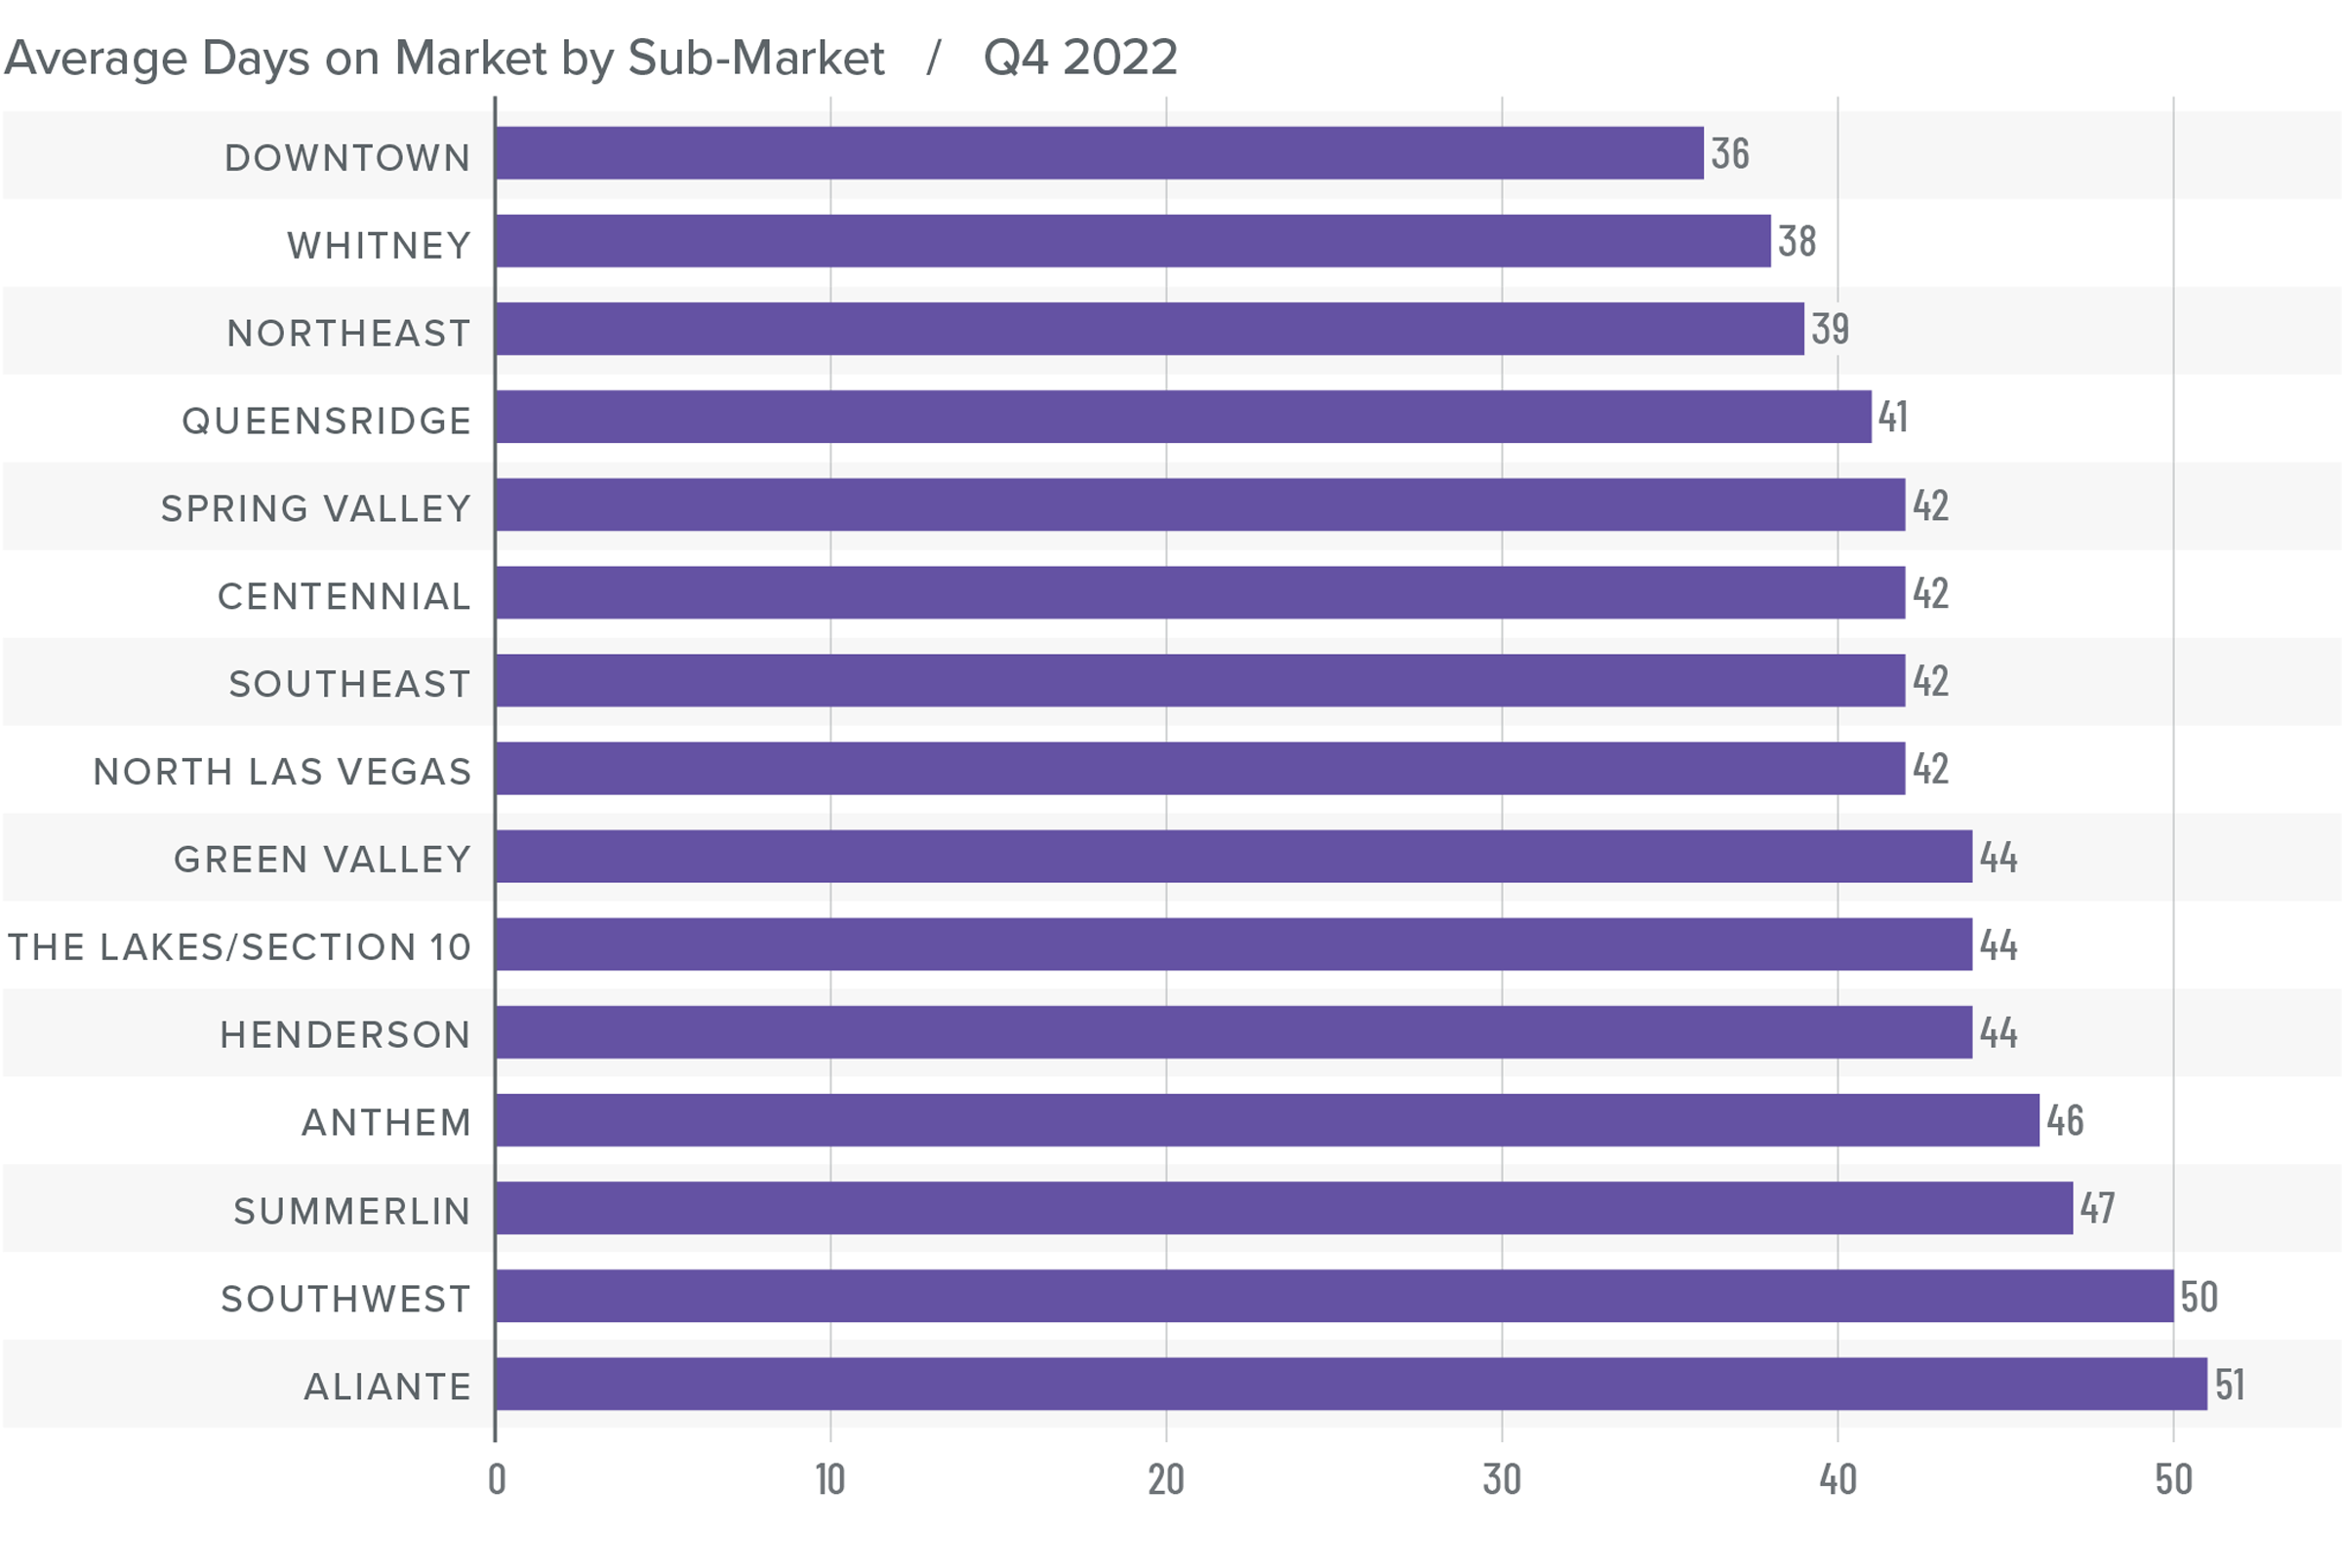
Nevada Days on Market
❱ The average time it took to sell a home in the region rose 20 days relative to the fourth quarter of 2021.
❱ It took an average of 43 days to sell a home in the fourth quarter, which was 18 days longer than it took in the third quarter of the year.
❱ Days on market rose in all neighborhoods compared to the same period in 2021 and the third quarter of 2022.
❱ The combination of more choice and fewer buyers is causing the market to slow down from the frantic pace of 2021 and most of 2022.
Conclusions
This speedometer reflects the state of the region’s real estate market using housing inventory, price gains, home sales, interest rates, and larger economic factors.
It is likely that a price ceiling has been reached in the Las Vegas market. Home sales are still occurring, but the frenzied nature we experienced during the pandemic has worn off. Higher financing costs have started to act as a significant headwind. While mortgage rates are likely to pull back in the coming months, they may not fall enough to result in a flood of home buyers. I expect prices to drop further before buyers start to believe that the market has bottomed. When this level is reached, mortgage rates will likely be closer to 5% than 6%, which should encourage more buyers to enter the market.

The bottom line is that the market has to pay the price for the very rapid pace of home-price appreciation in 2021 and part of 2022. Prices have a little further to drop, but I firmly believe that conditions will stabilize this year and then resume the pace of pre-pandemic home-price appreciation. As such, I have moved the needle more in favor of buyers and into neutral territory.
About Matthew Gardner

As Chief Economist for Windermere Real Estate, Matthew Gardner is responsible for analyzing and interpreting economic data and its impact on the real estate market on both a local and national level. Matthew has over 30 years of professional experience both in the U.S. and U.K.
In addition to his day-to-day responsibilities, Matthew sits on the Washington State Governors Council of Economic Advisors; chairs the Board of Trustees at the Washington Center for Real Estate Research at the University of Washington; and is an Advisory Board Member at the Runstad Center for Real Estate Studies at the University of Washington where he also lectures in real estate economics.
")


