
 Facebook
 X
X
 Pinterest
 Copy Link

The following analysis of select counties of the greater Las Vegas real estate market is provided by Windermere Real Estate Chief Economist Matthew Gardner. We hope that this information may assist you with making better-informed real estate decisions. For further information about the housing market in your area, please don’t hesitate to contact your Windermere Real Estate agent.
Regional Economic Overview
Clark County continues to add jobs, but the pace of growth has started to taper. The market has added 49,200 new jobs over the past 12 months. Although that was the slowest annual growth rate since before the pandemic, it still represents an impressive increase of 4.6%. The non-seasonally adjusted jobless rate in May was a respectable 5.6%. This was up .01% over April, but down from 8.1% the second quarter of 2022. When adjusted for seasonality, the rate was also 5.6%, down from 5.9% in the second quarter of 2022. My latest employment forecast for the Las Vegas metro area suggests that employment growth will continue to taper, but that over 43,000 new jobs will have been created in 2023.
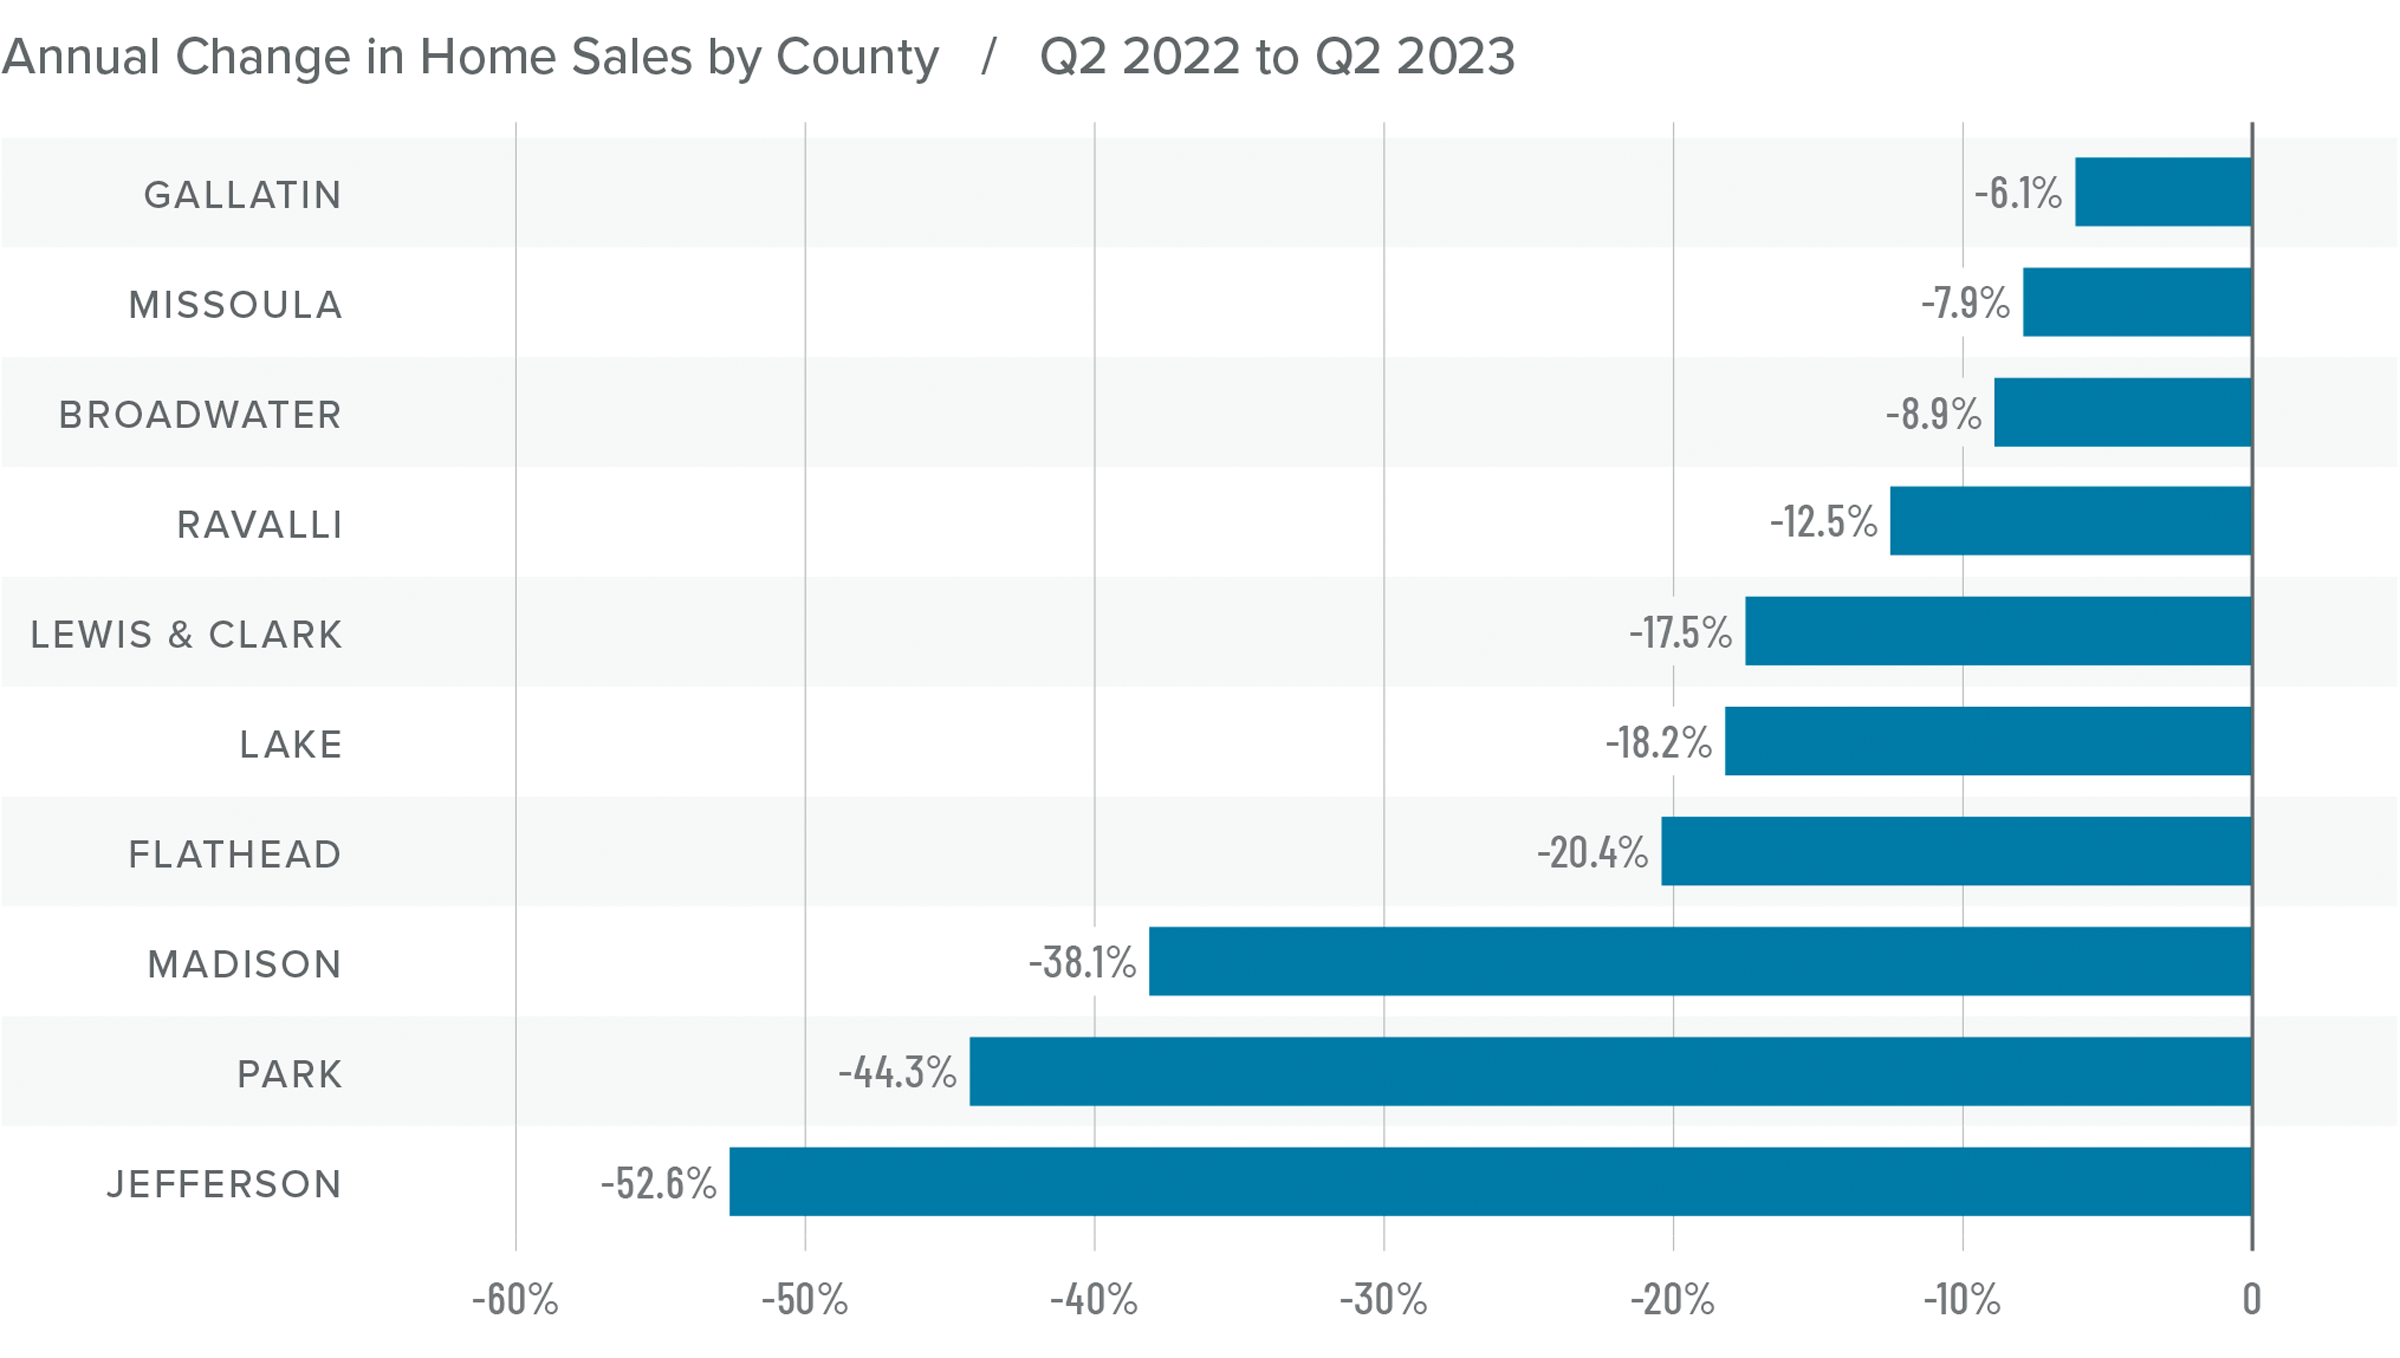
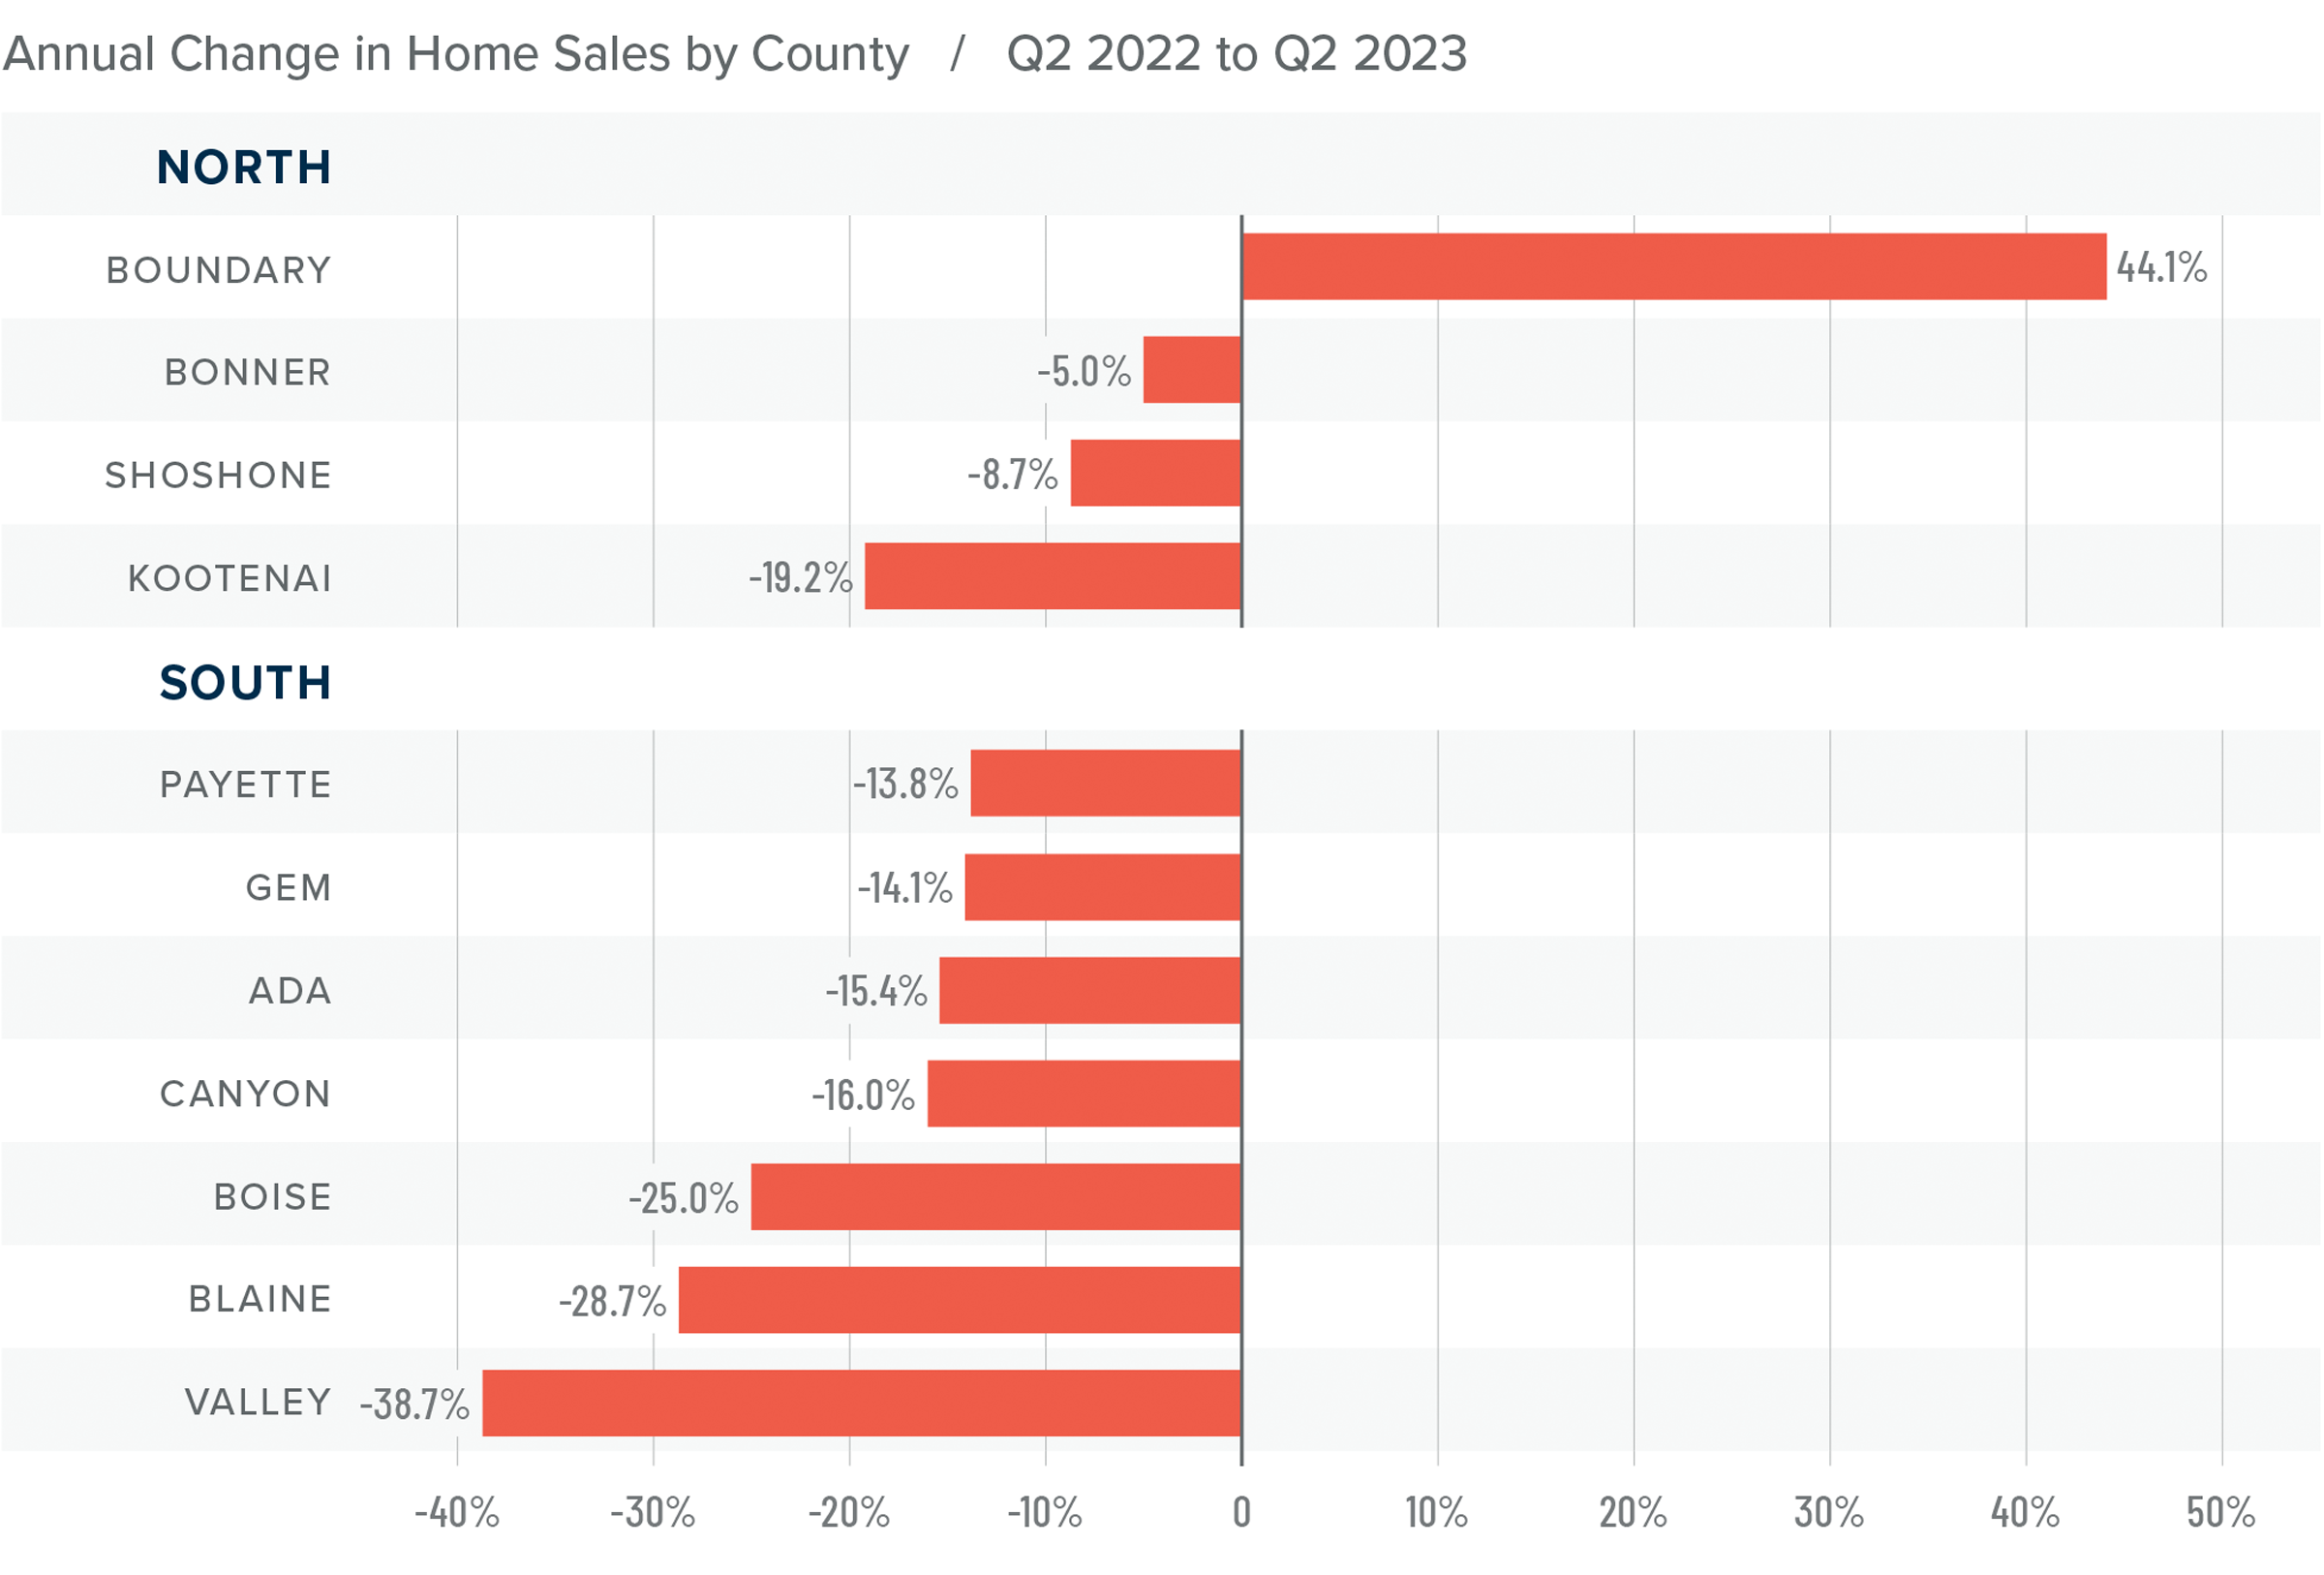
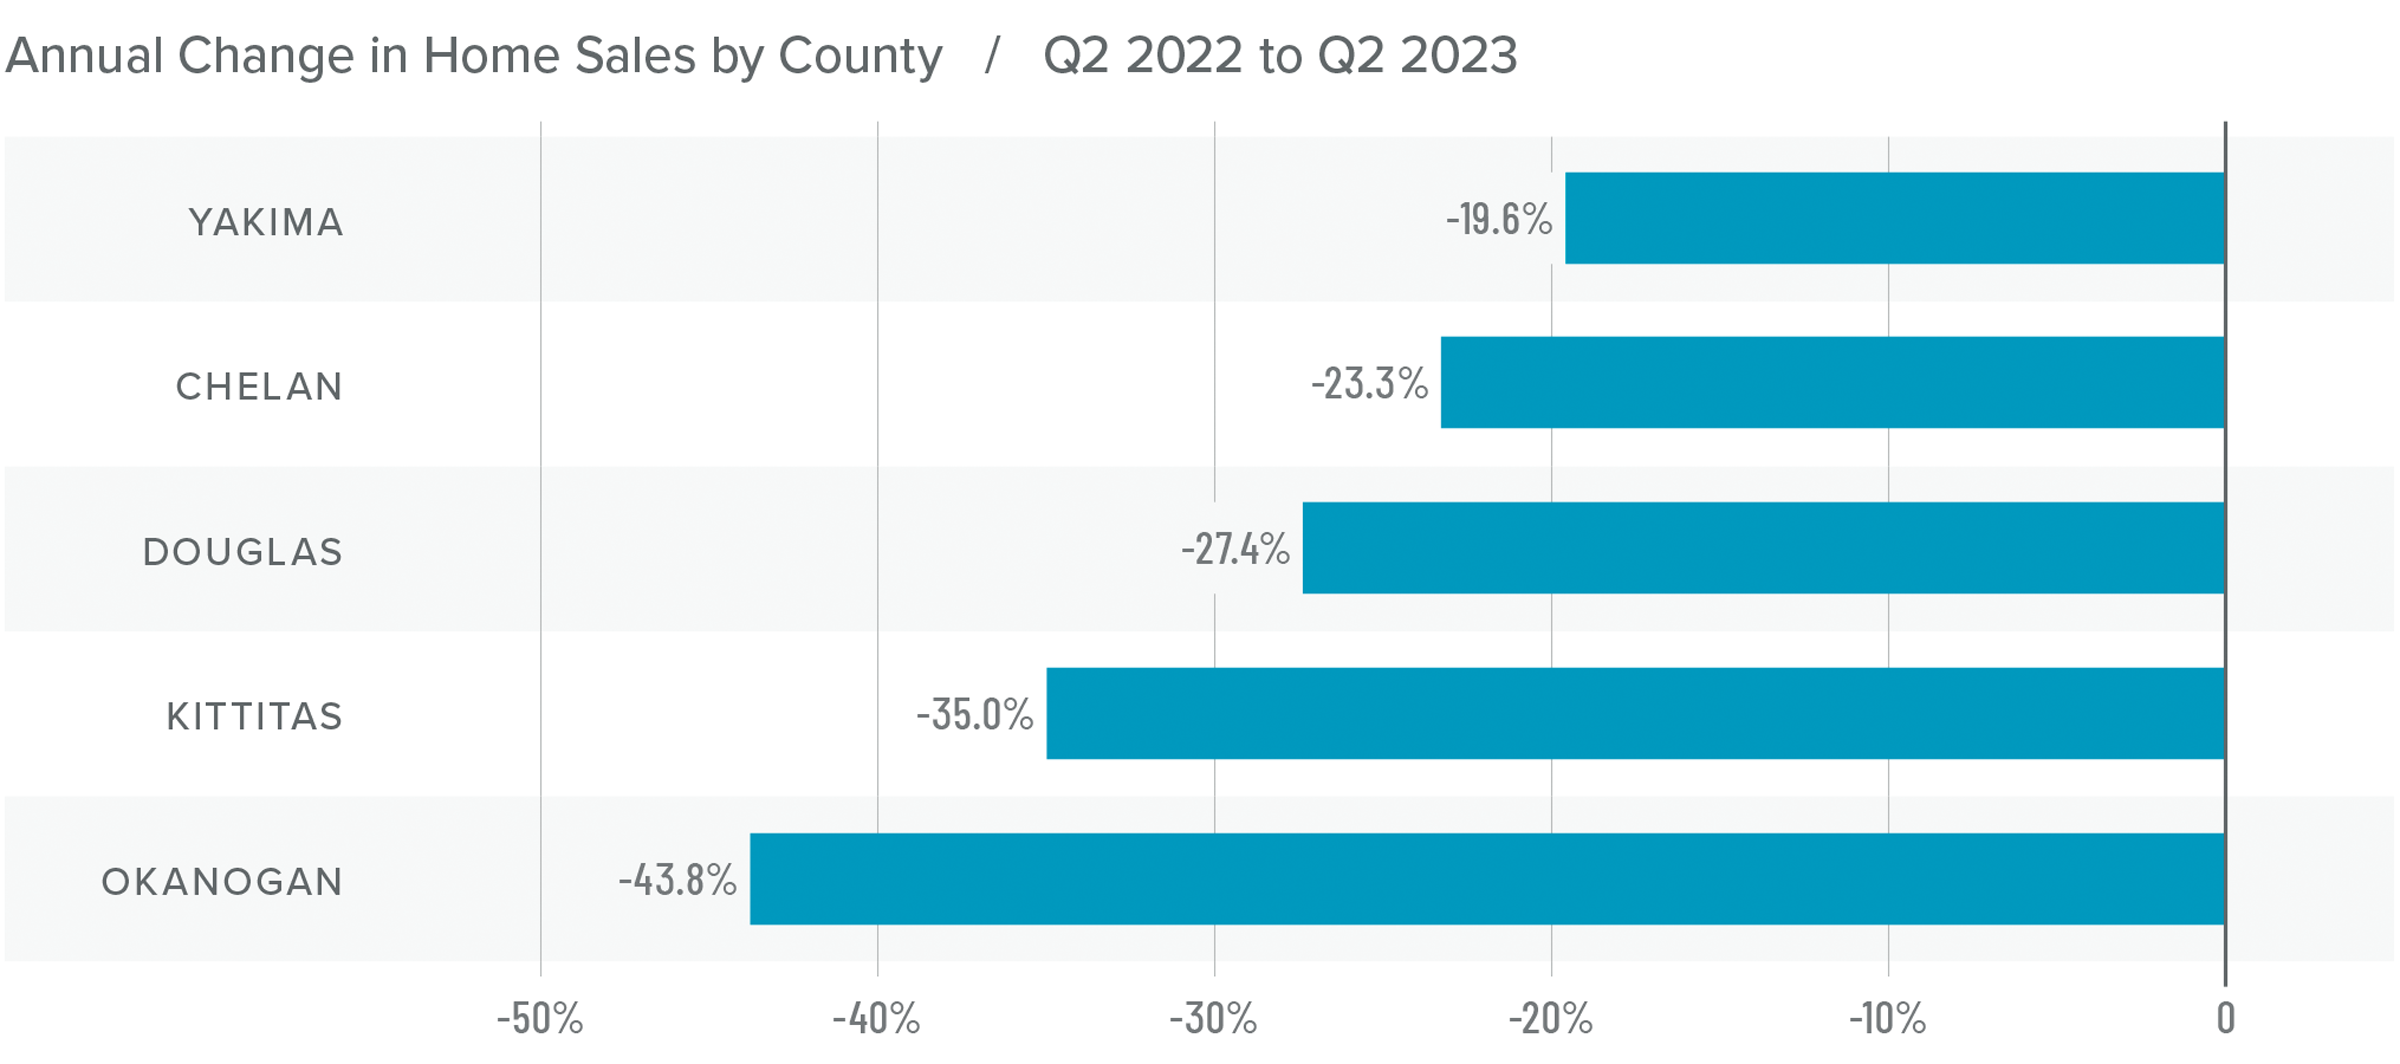
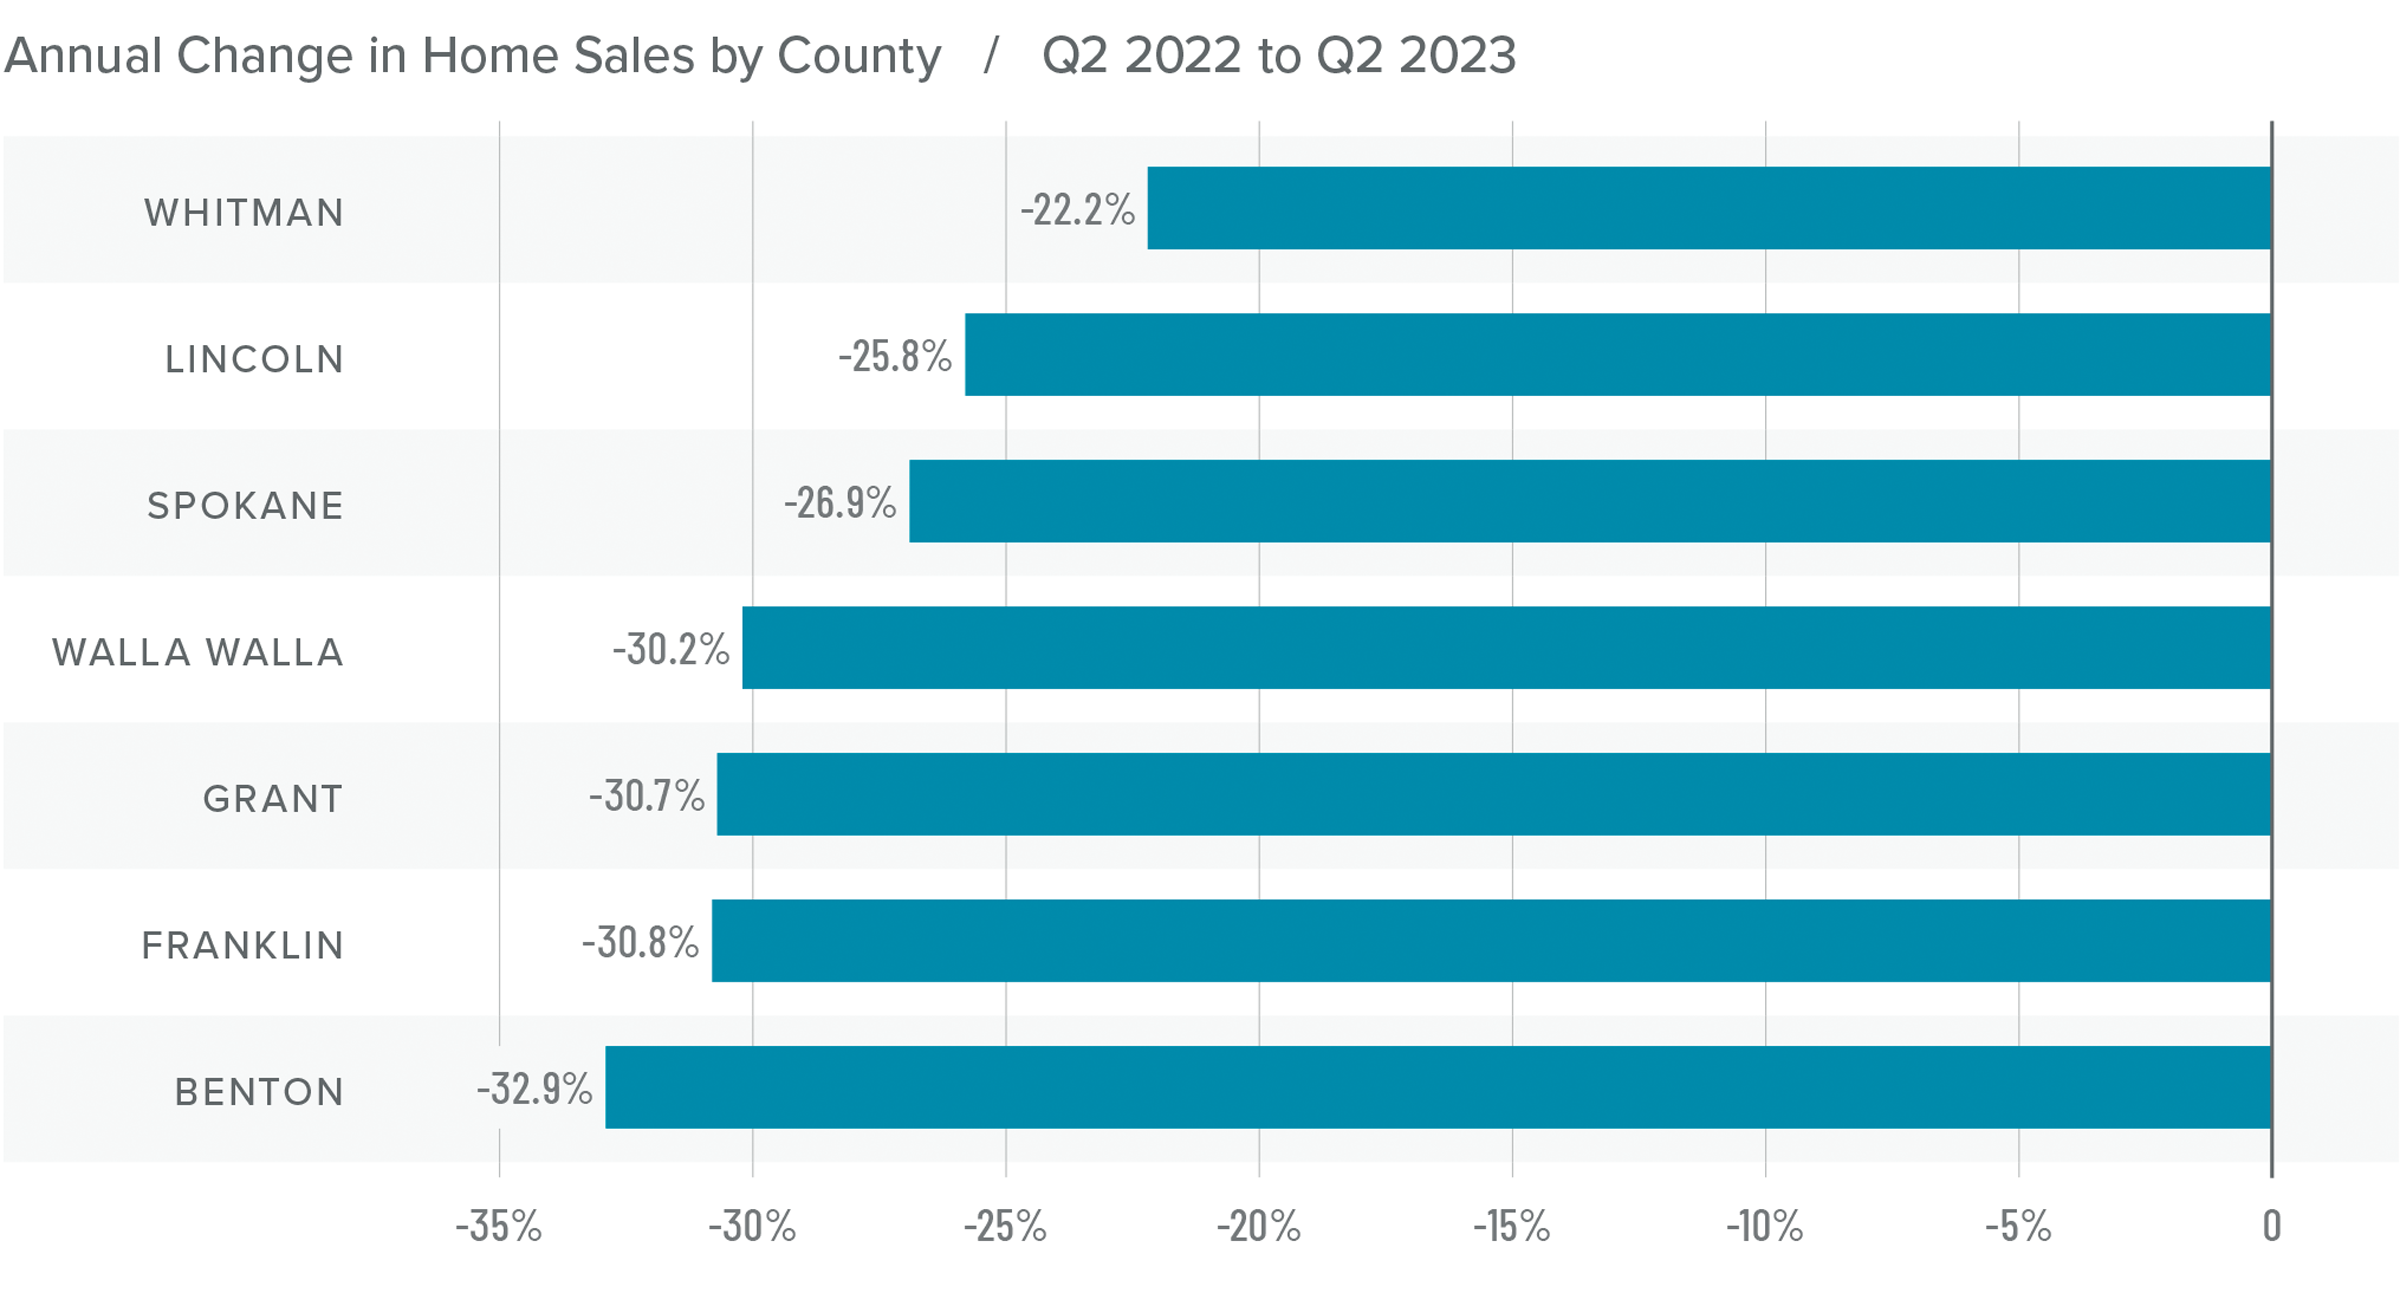
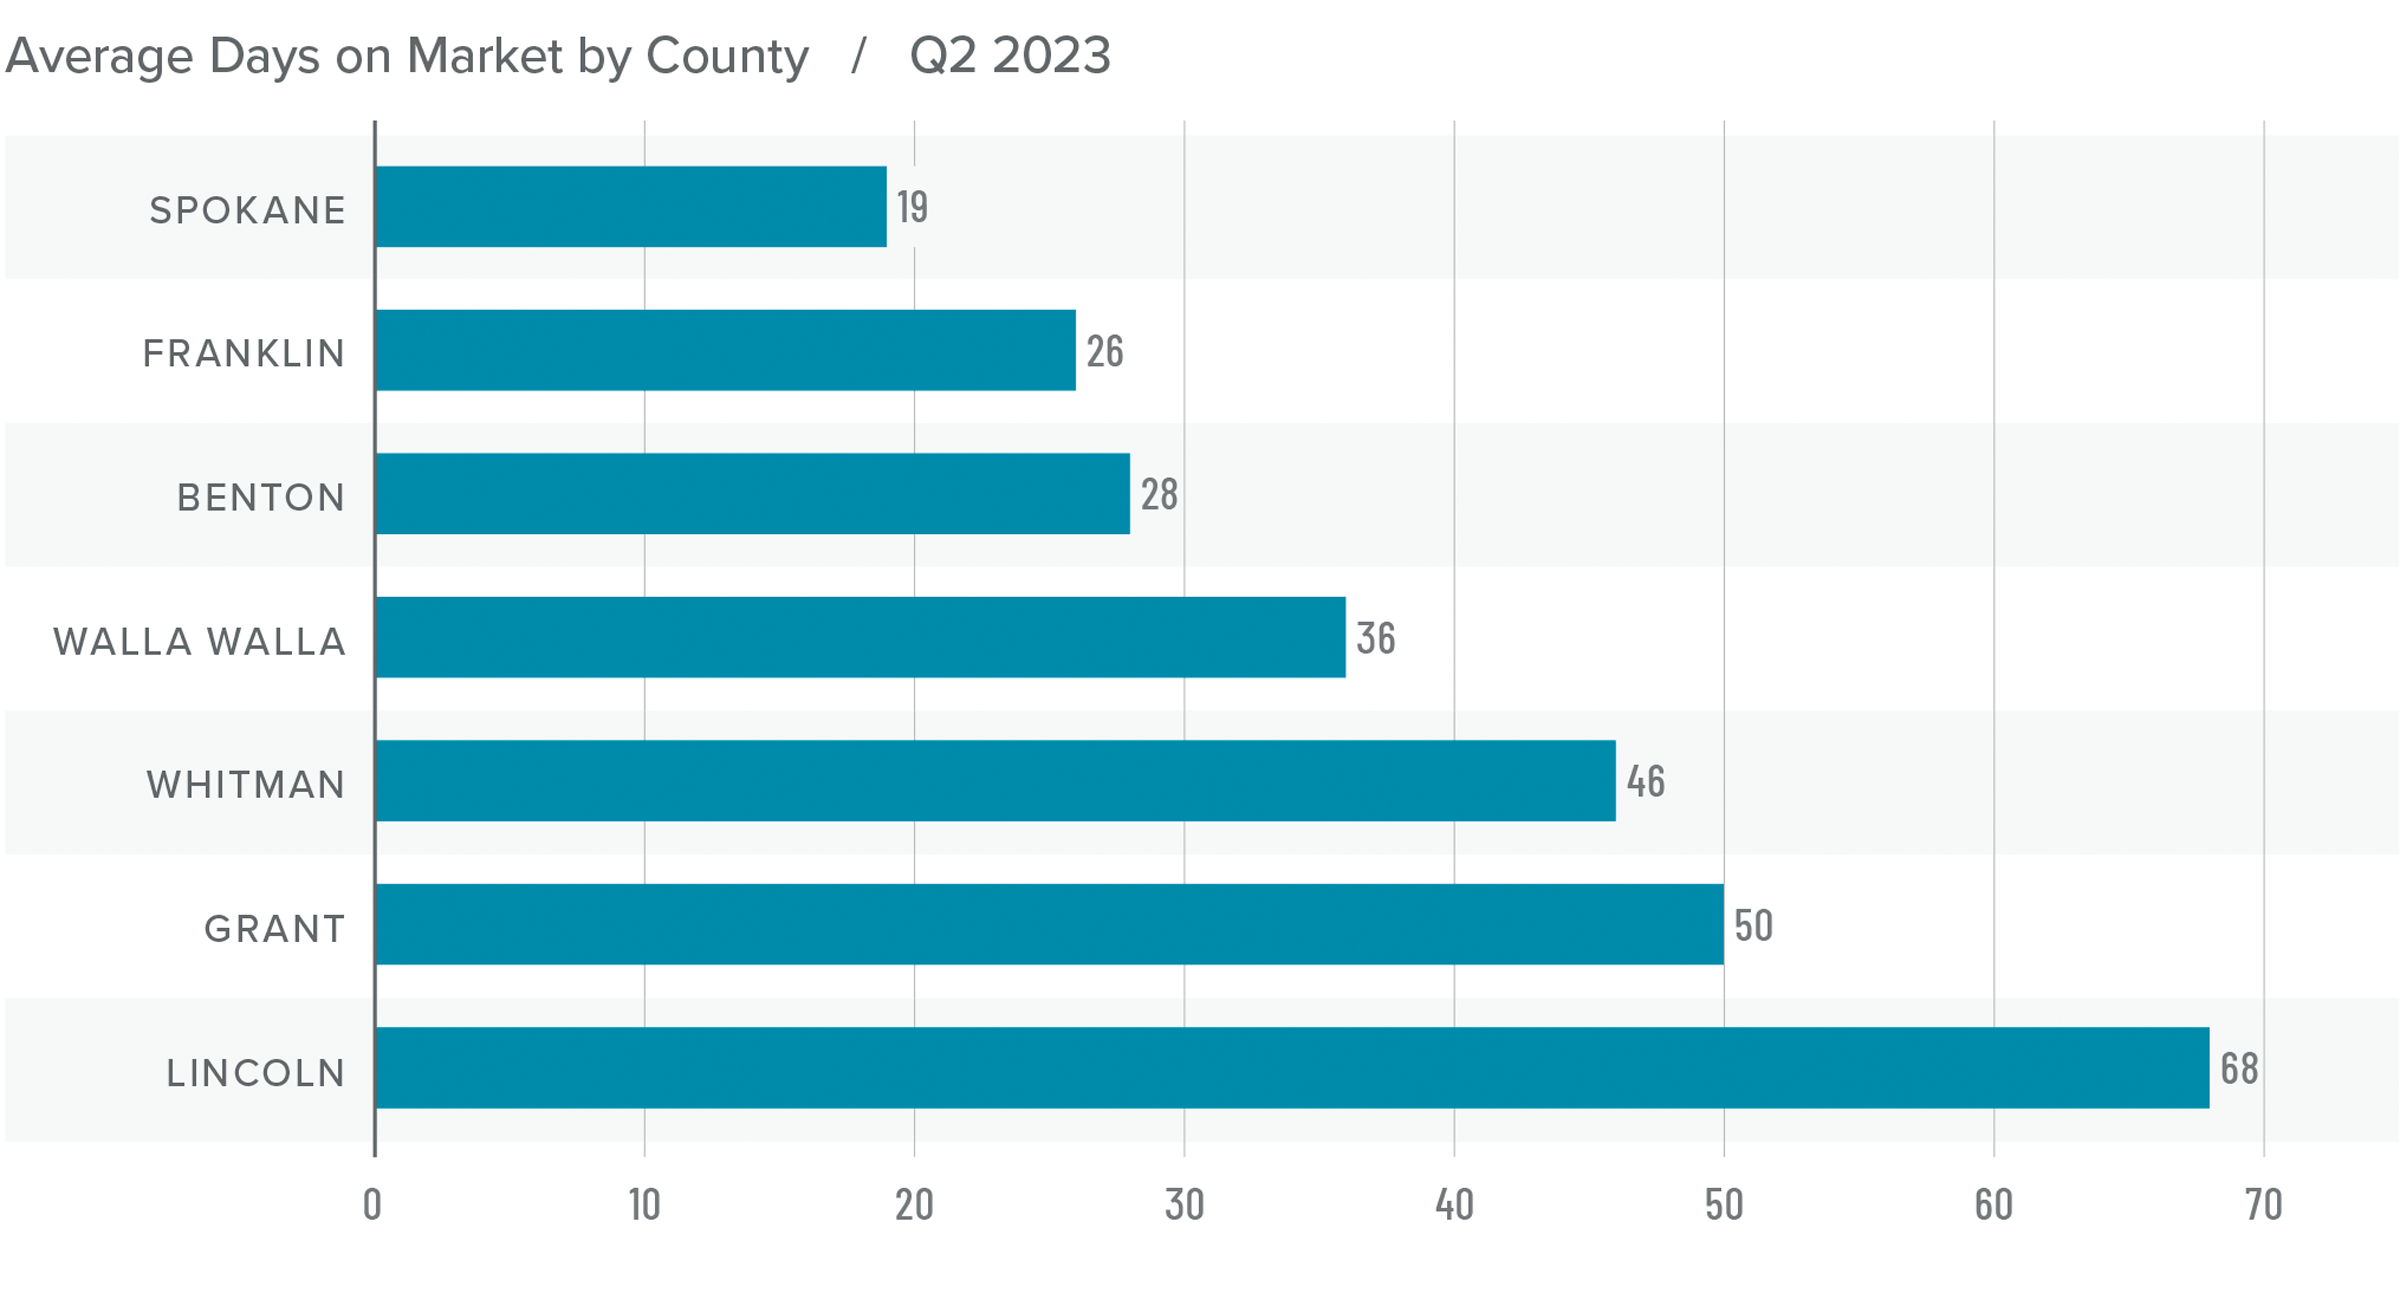
Nevada Home Sales
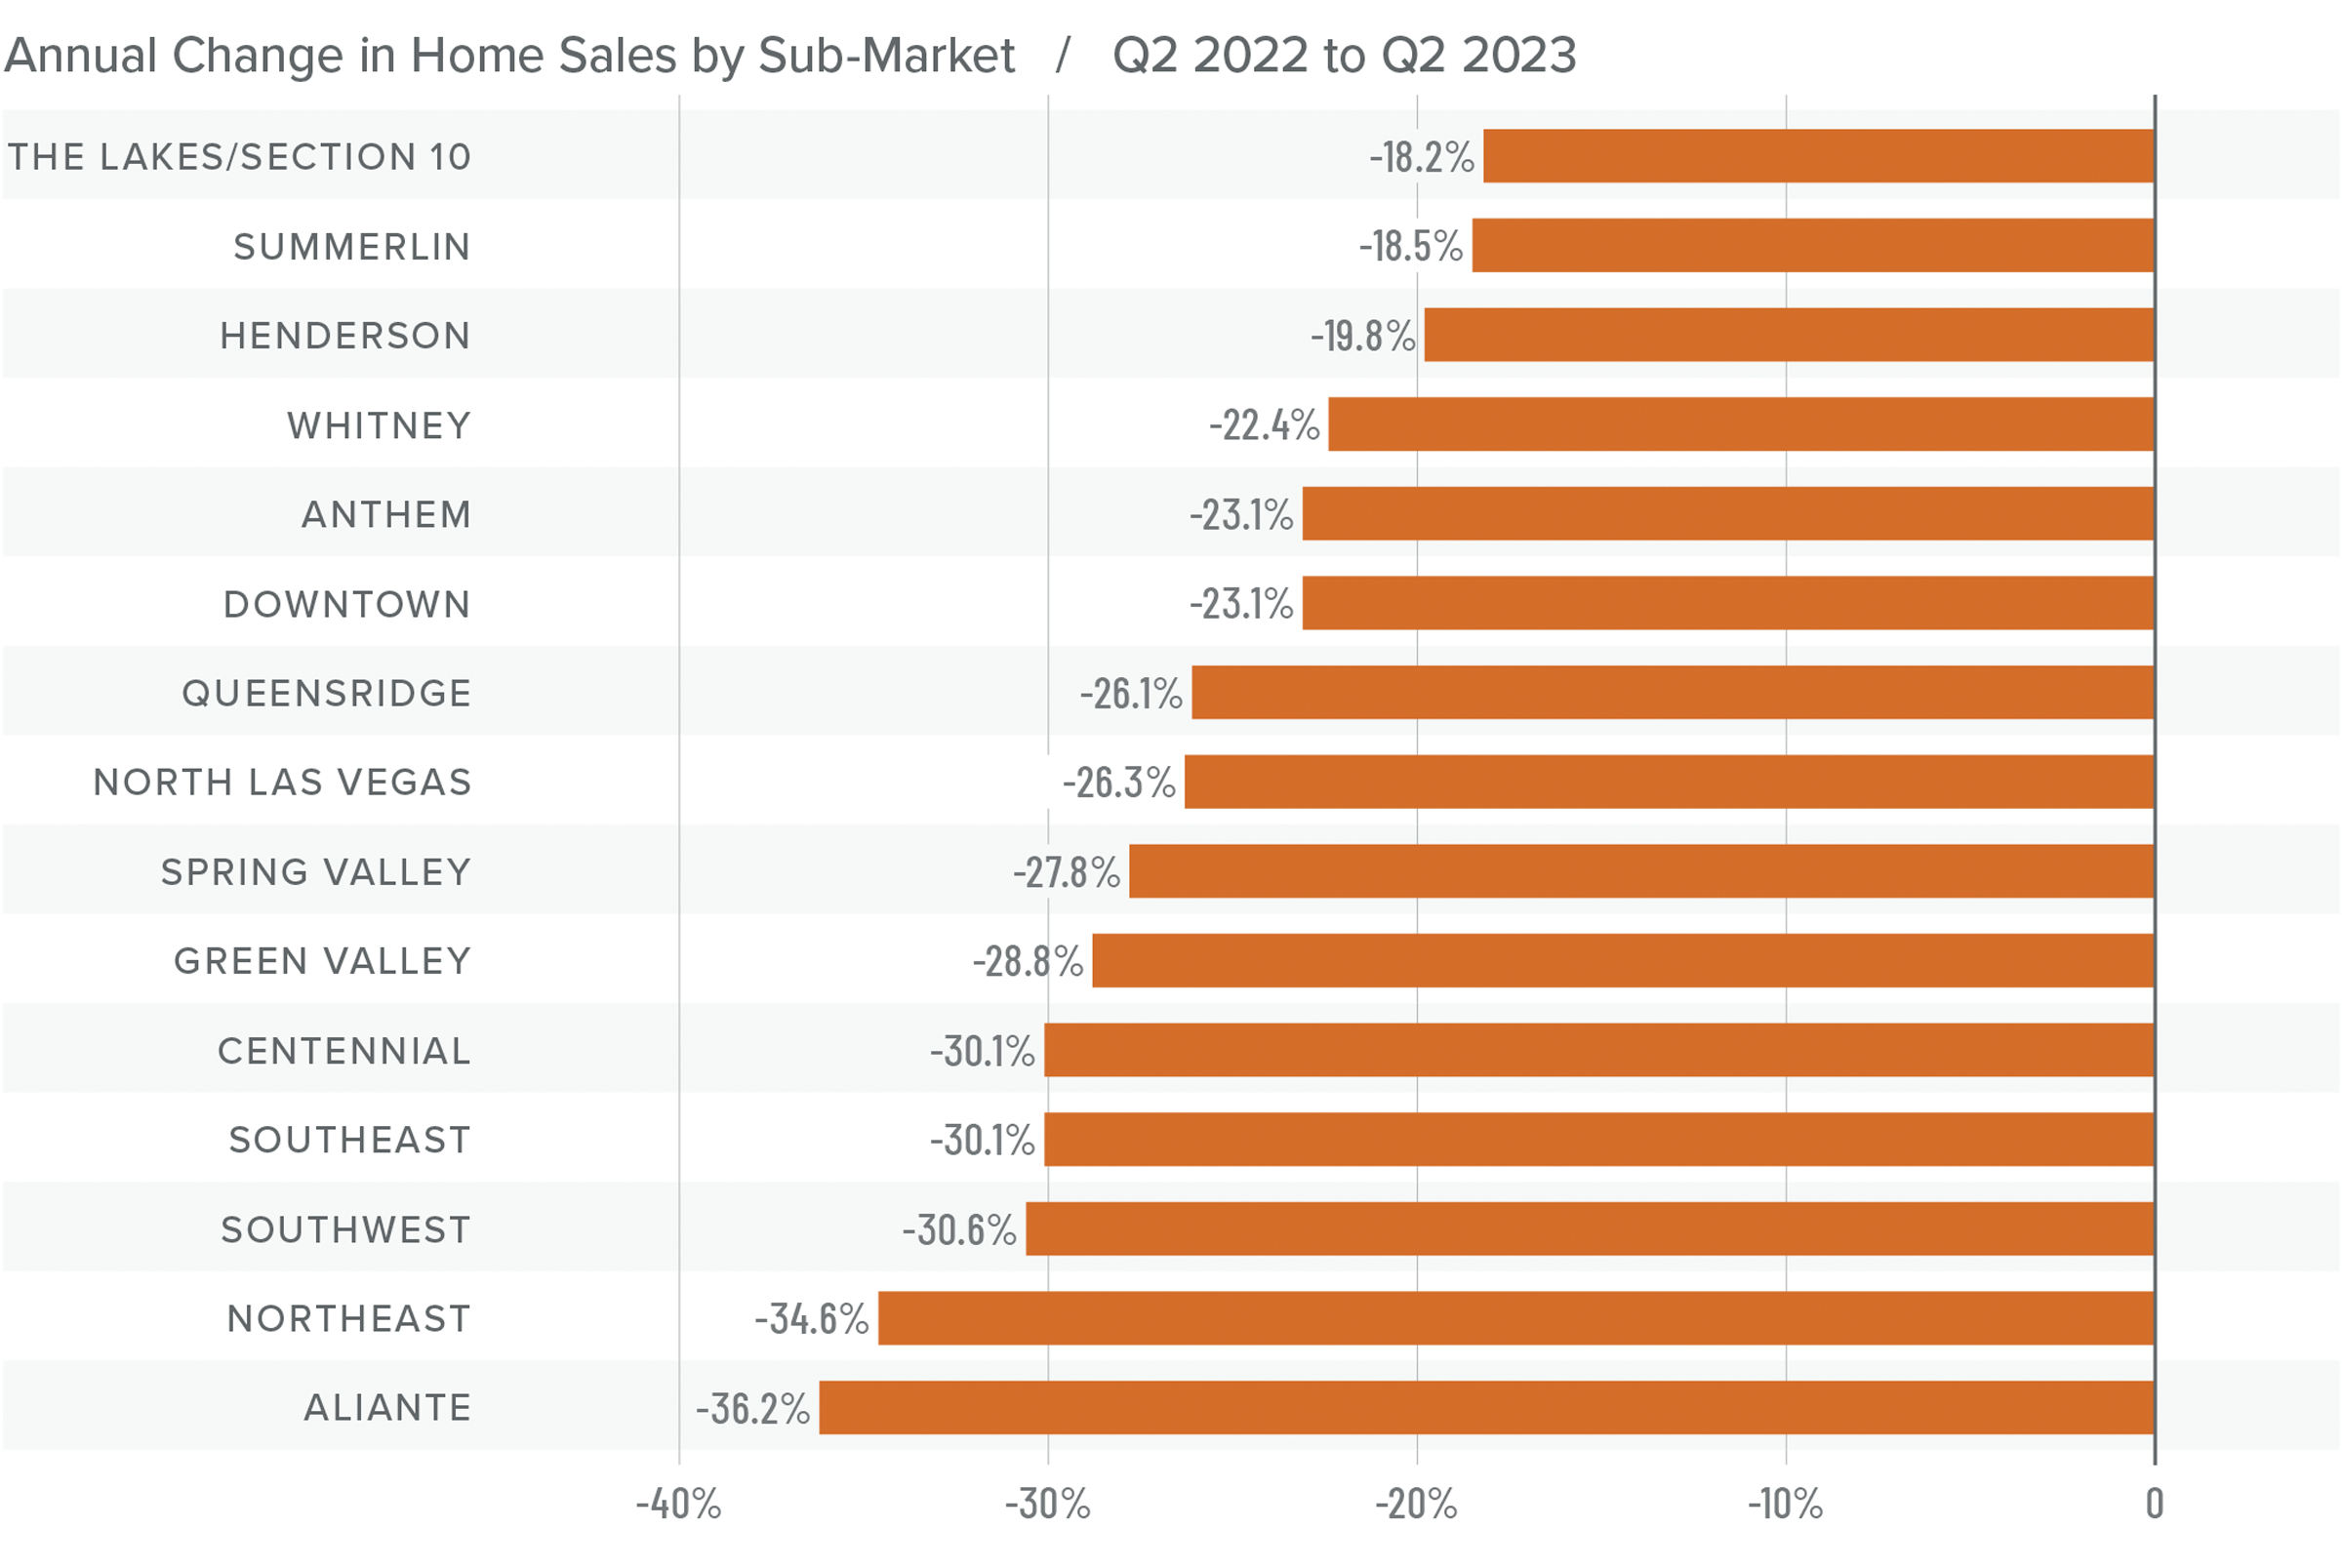
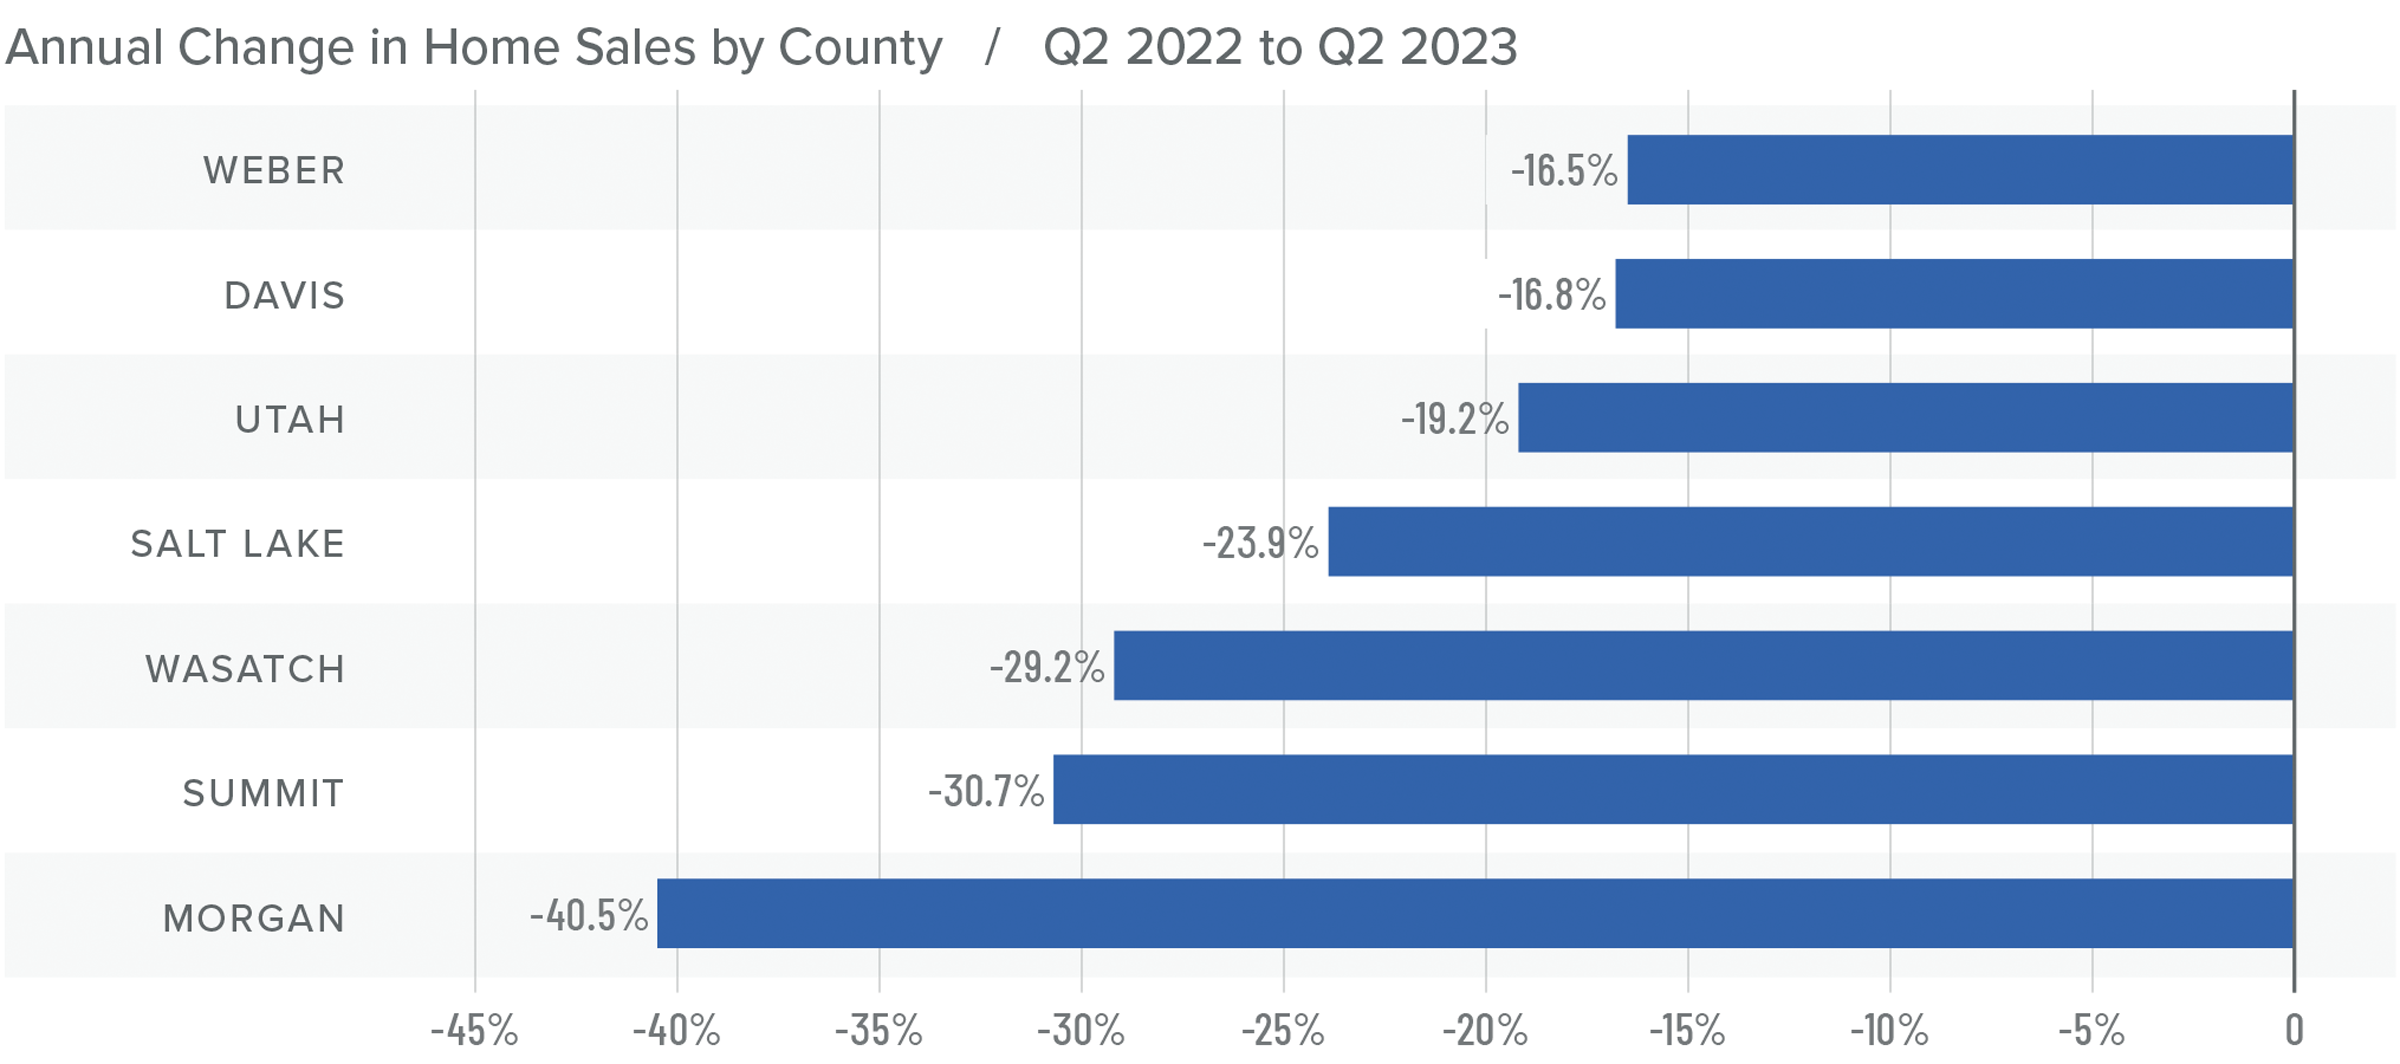
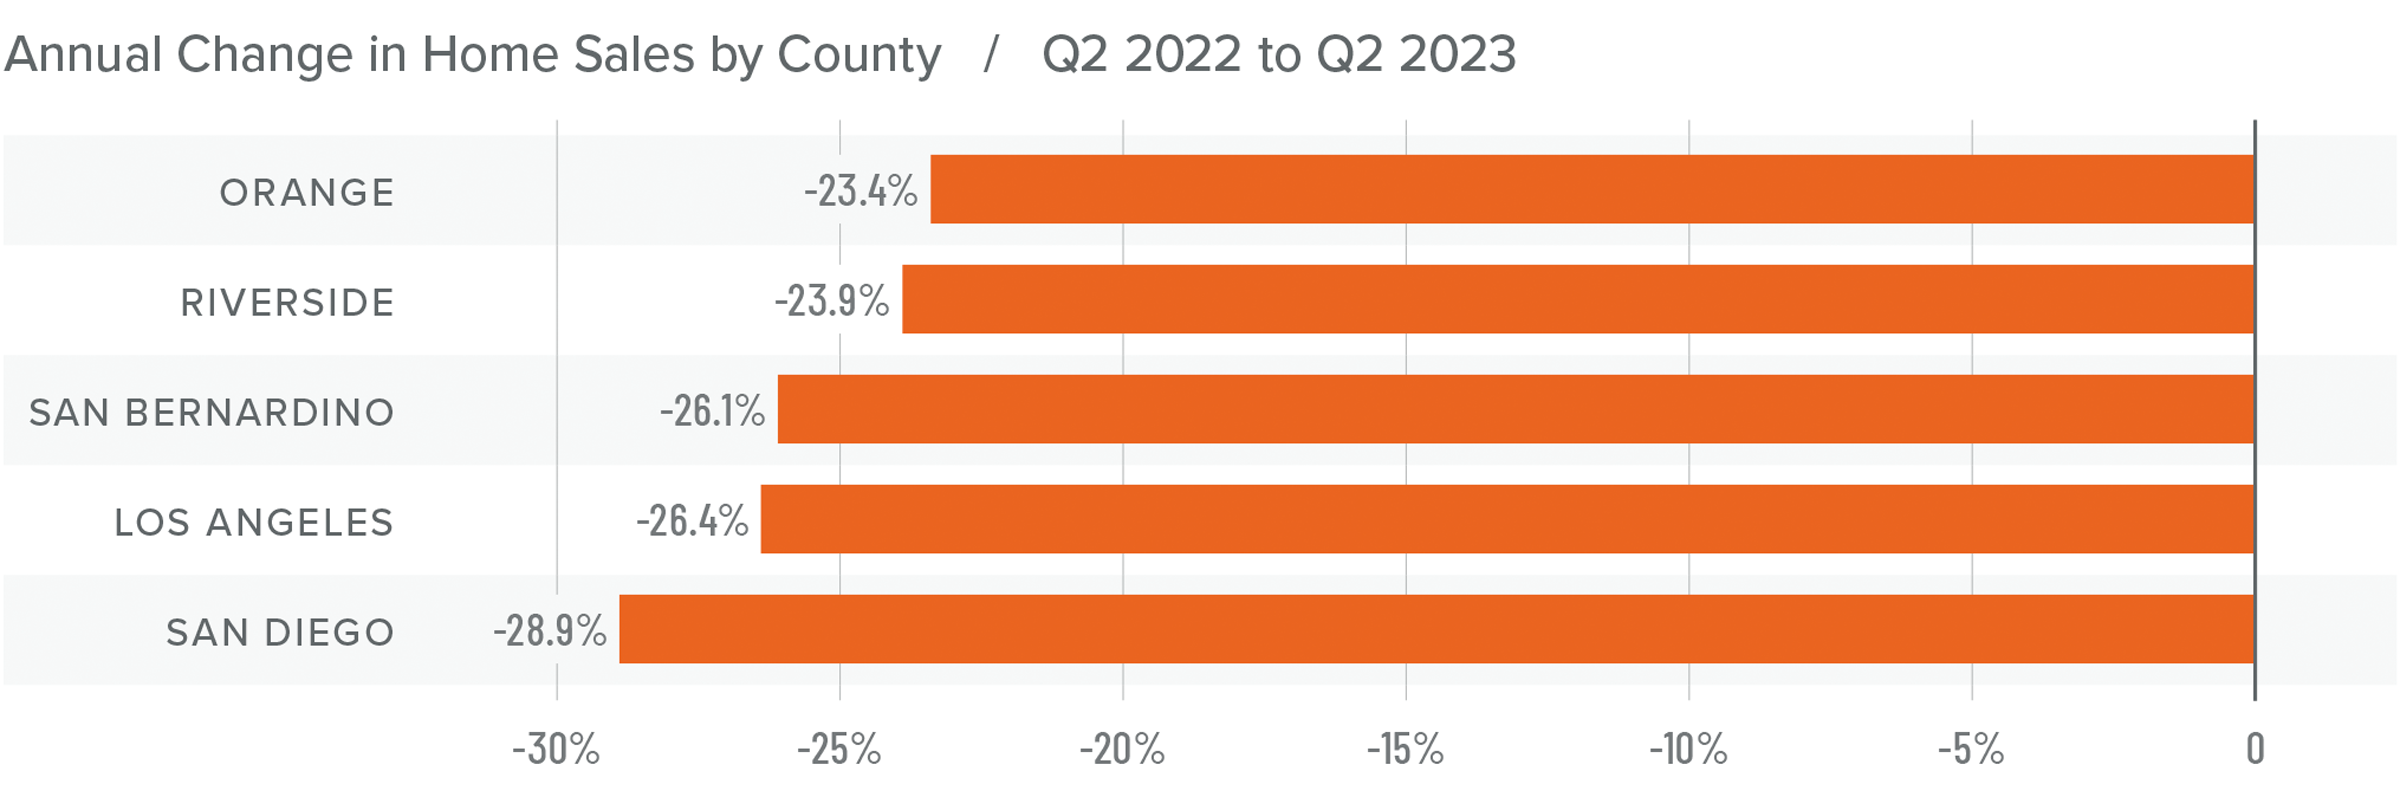
❱ A total of 6,908 homes sold in the second quarter of the year, which was a drop of 26.3% compared to the second quarter of 2022. However, sales continued the upward momentum we saw in the first quarter and were an impressive 23.7% higher than in the first quarter of the year.
❱ Year over year, sales fell significantly across the board. However, sales rose in every neighborhood compared to the first quarter of 2023. Every area except Aliante, The Lakes/Section 8, and Northeast Las Vegas saw double-digit gains.
❱ Even more impressive was the fact that sales rose from the first quarter despite the 2.5% drop in the average number of homes for sale.
❱ Pending sales, which are an indicator of future closings, rose 10.7% compared to the first quarter, suggesting that the market may see further growth in sales in the third quarter of 2023.
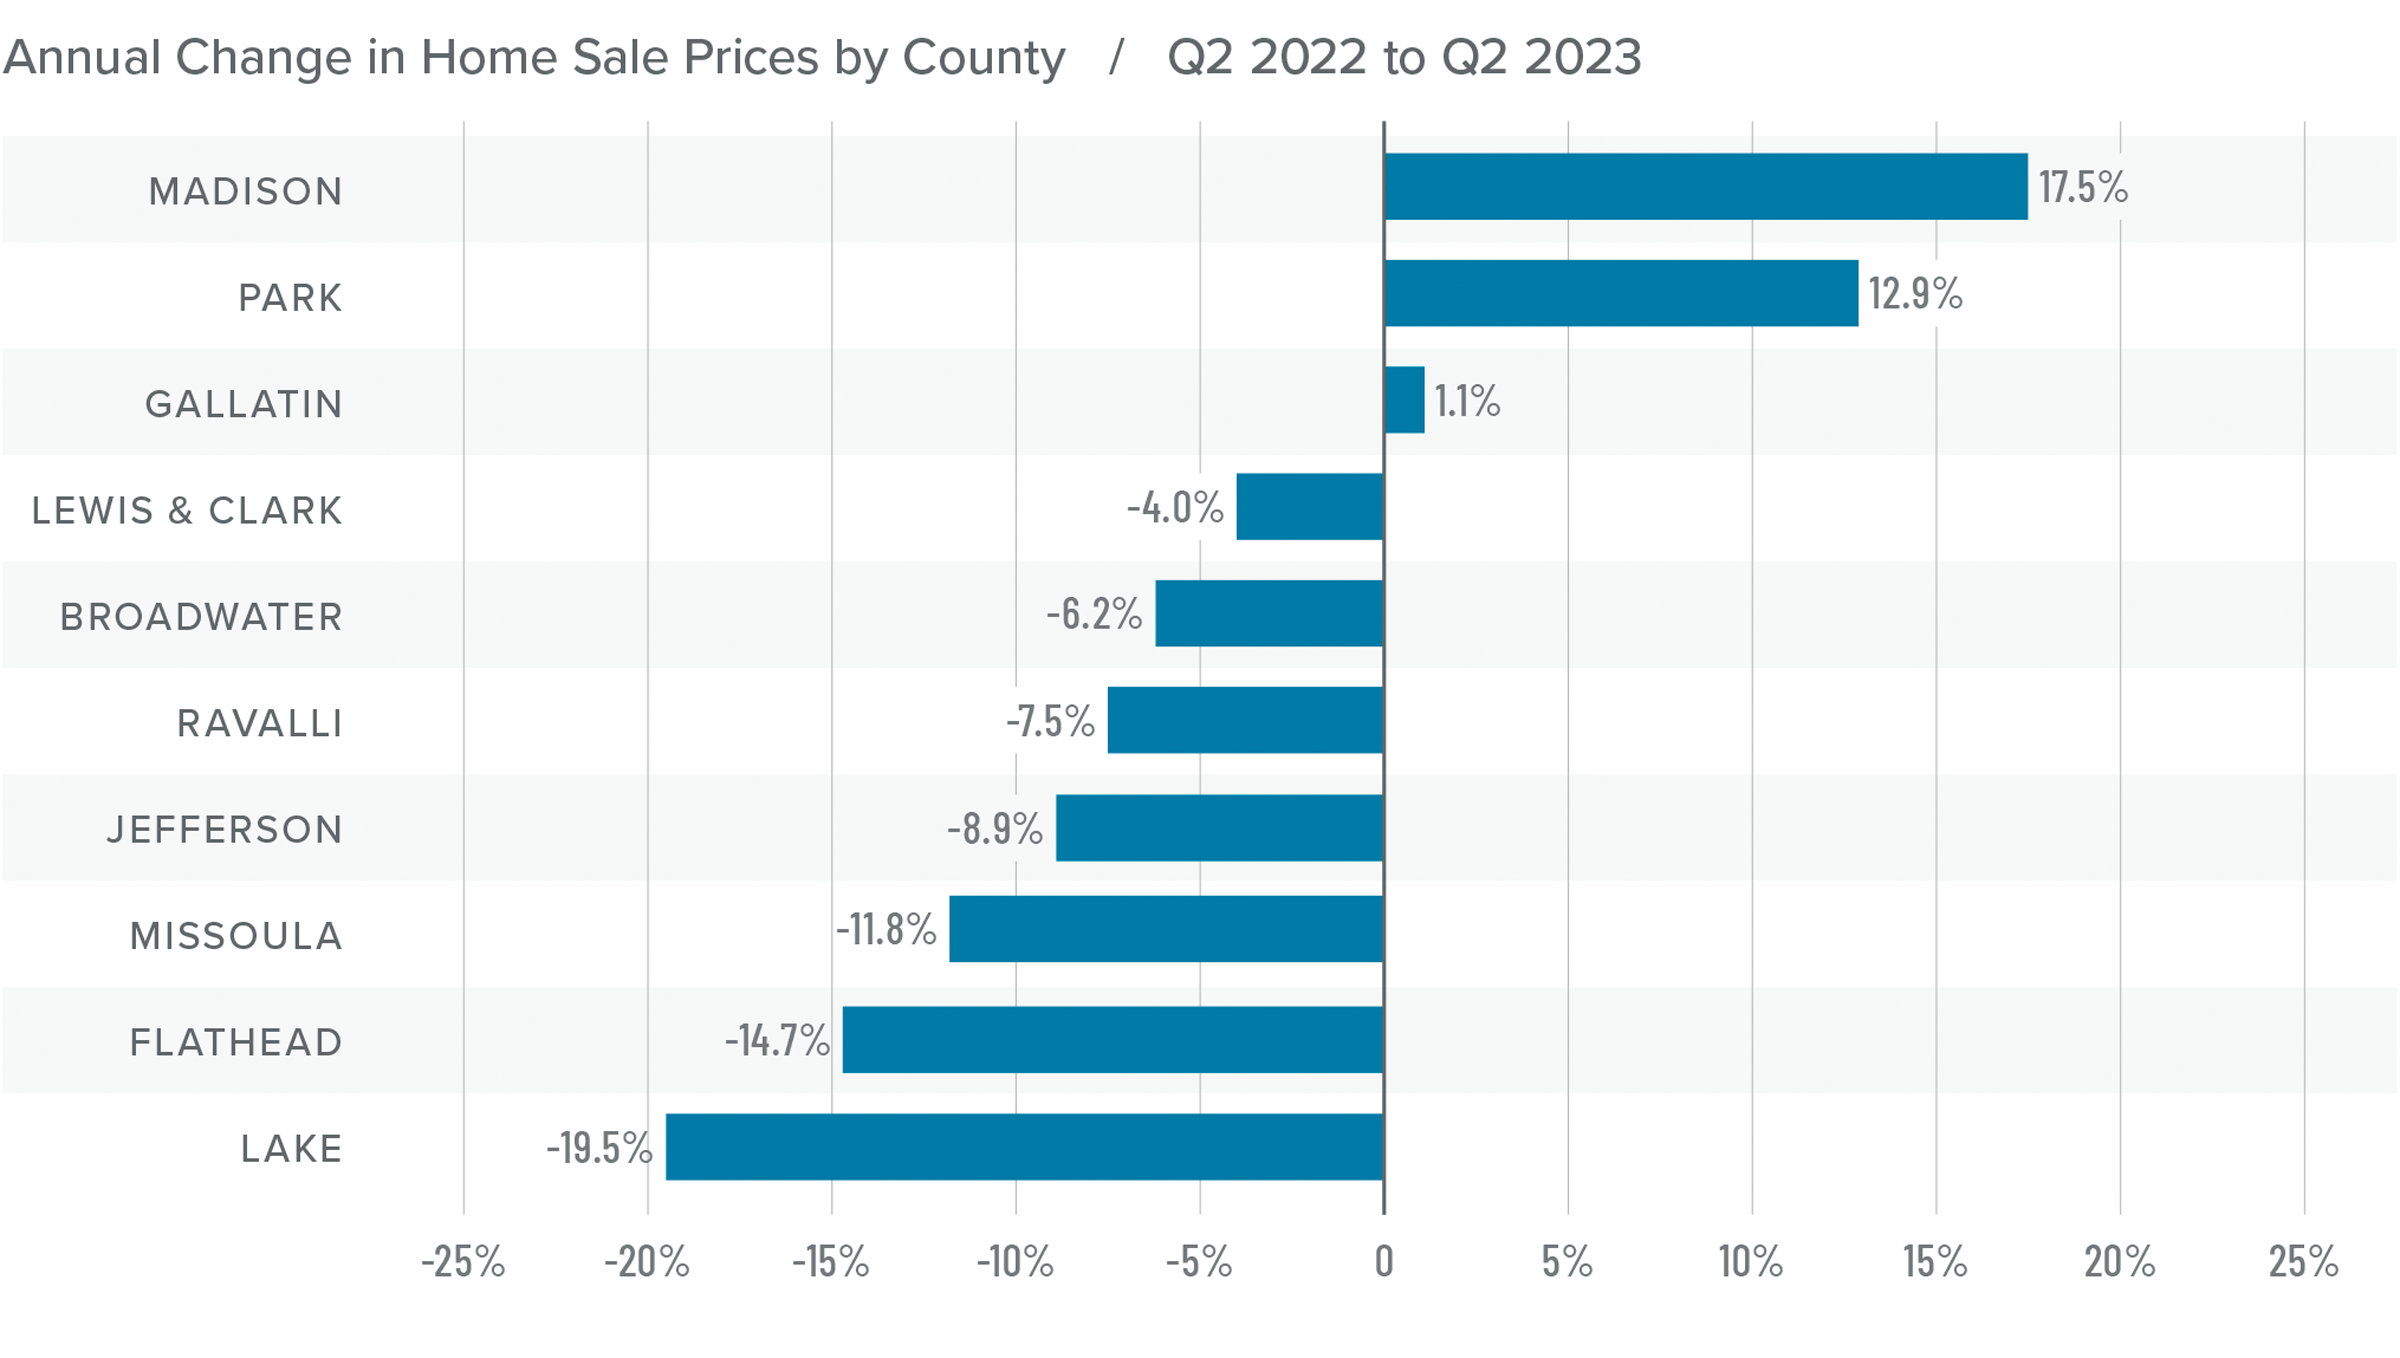
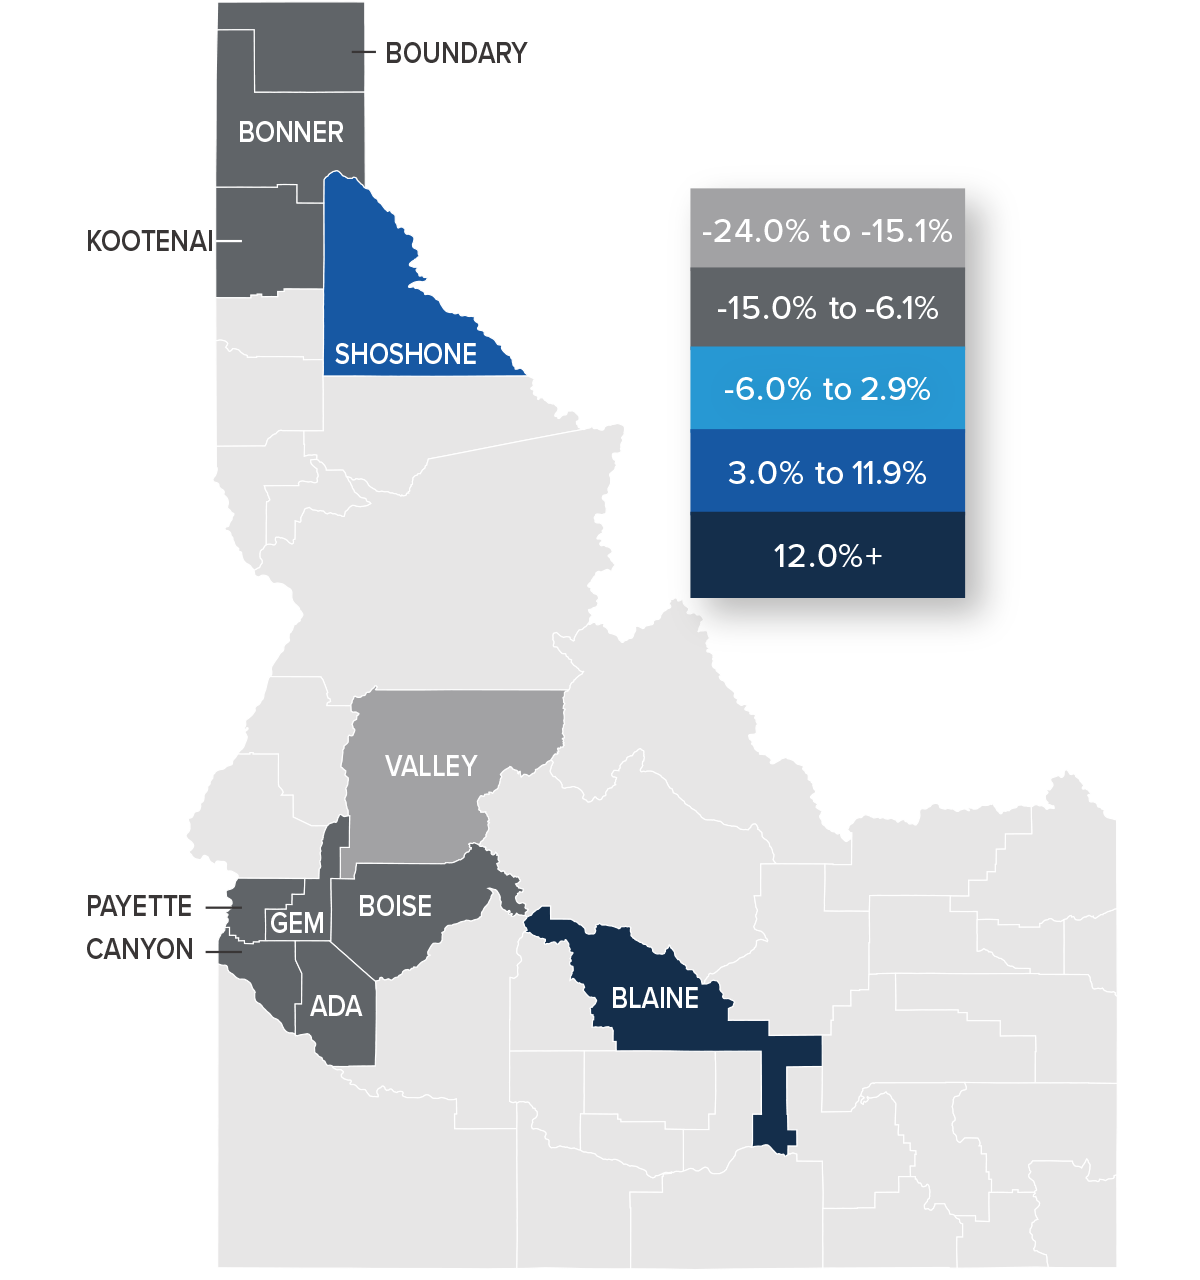
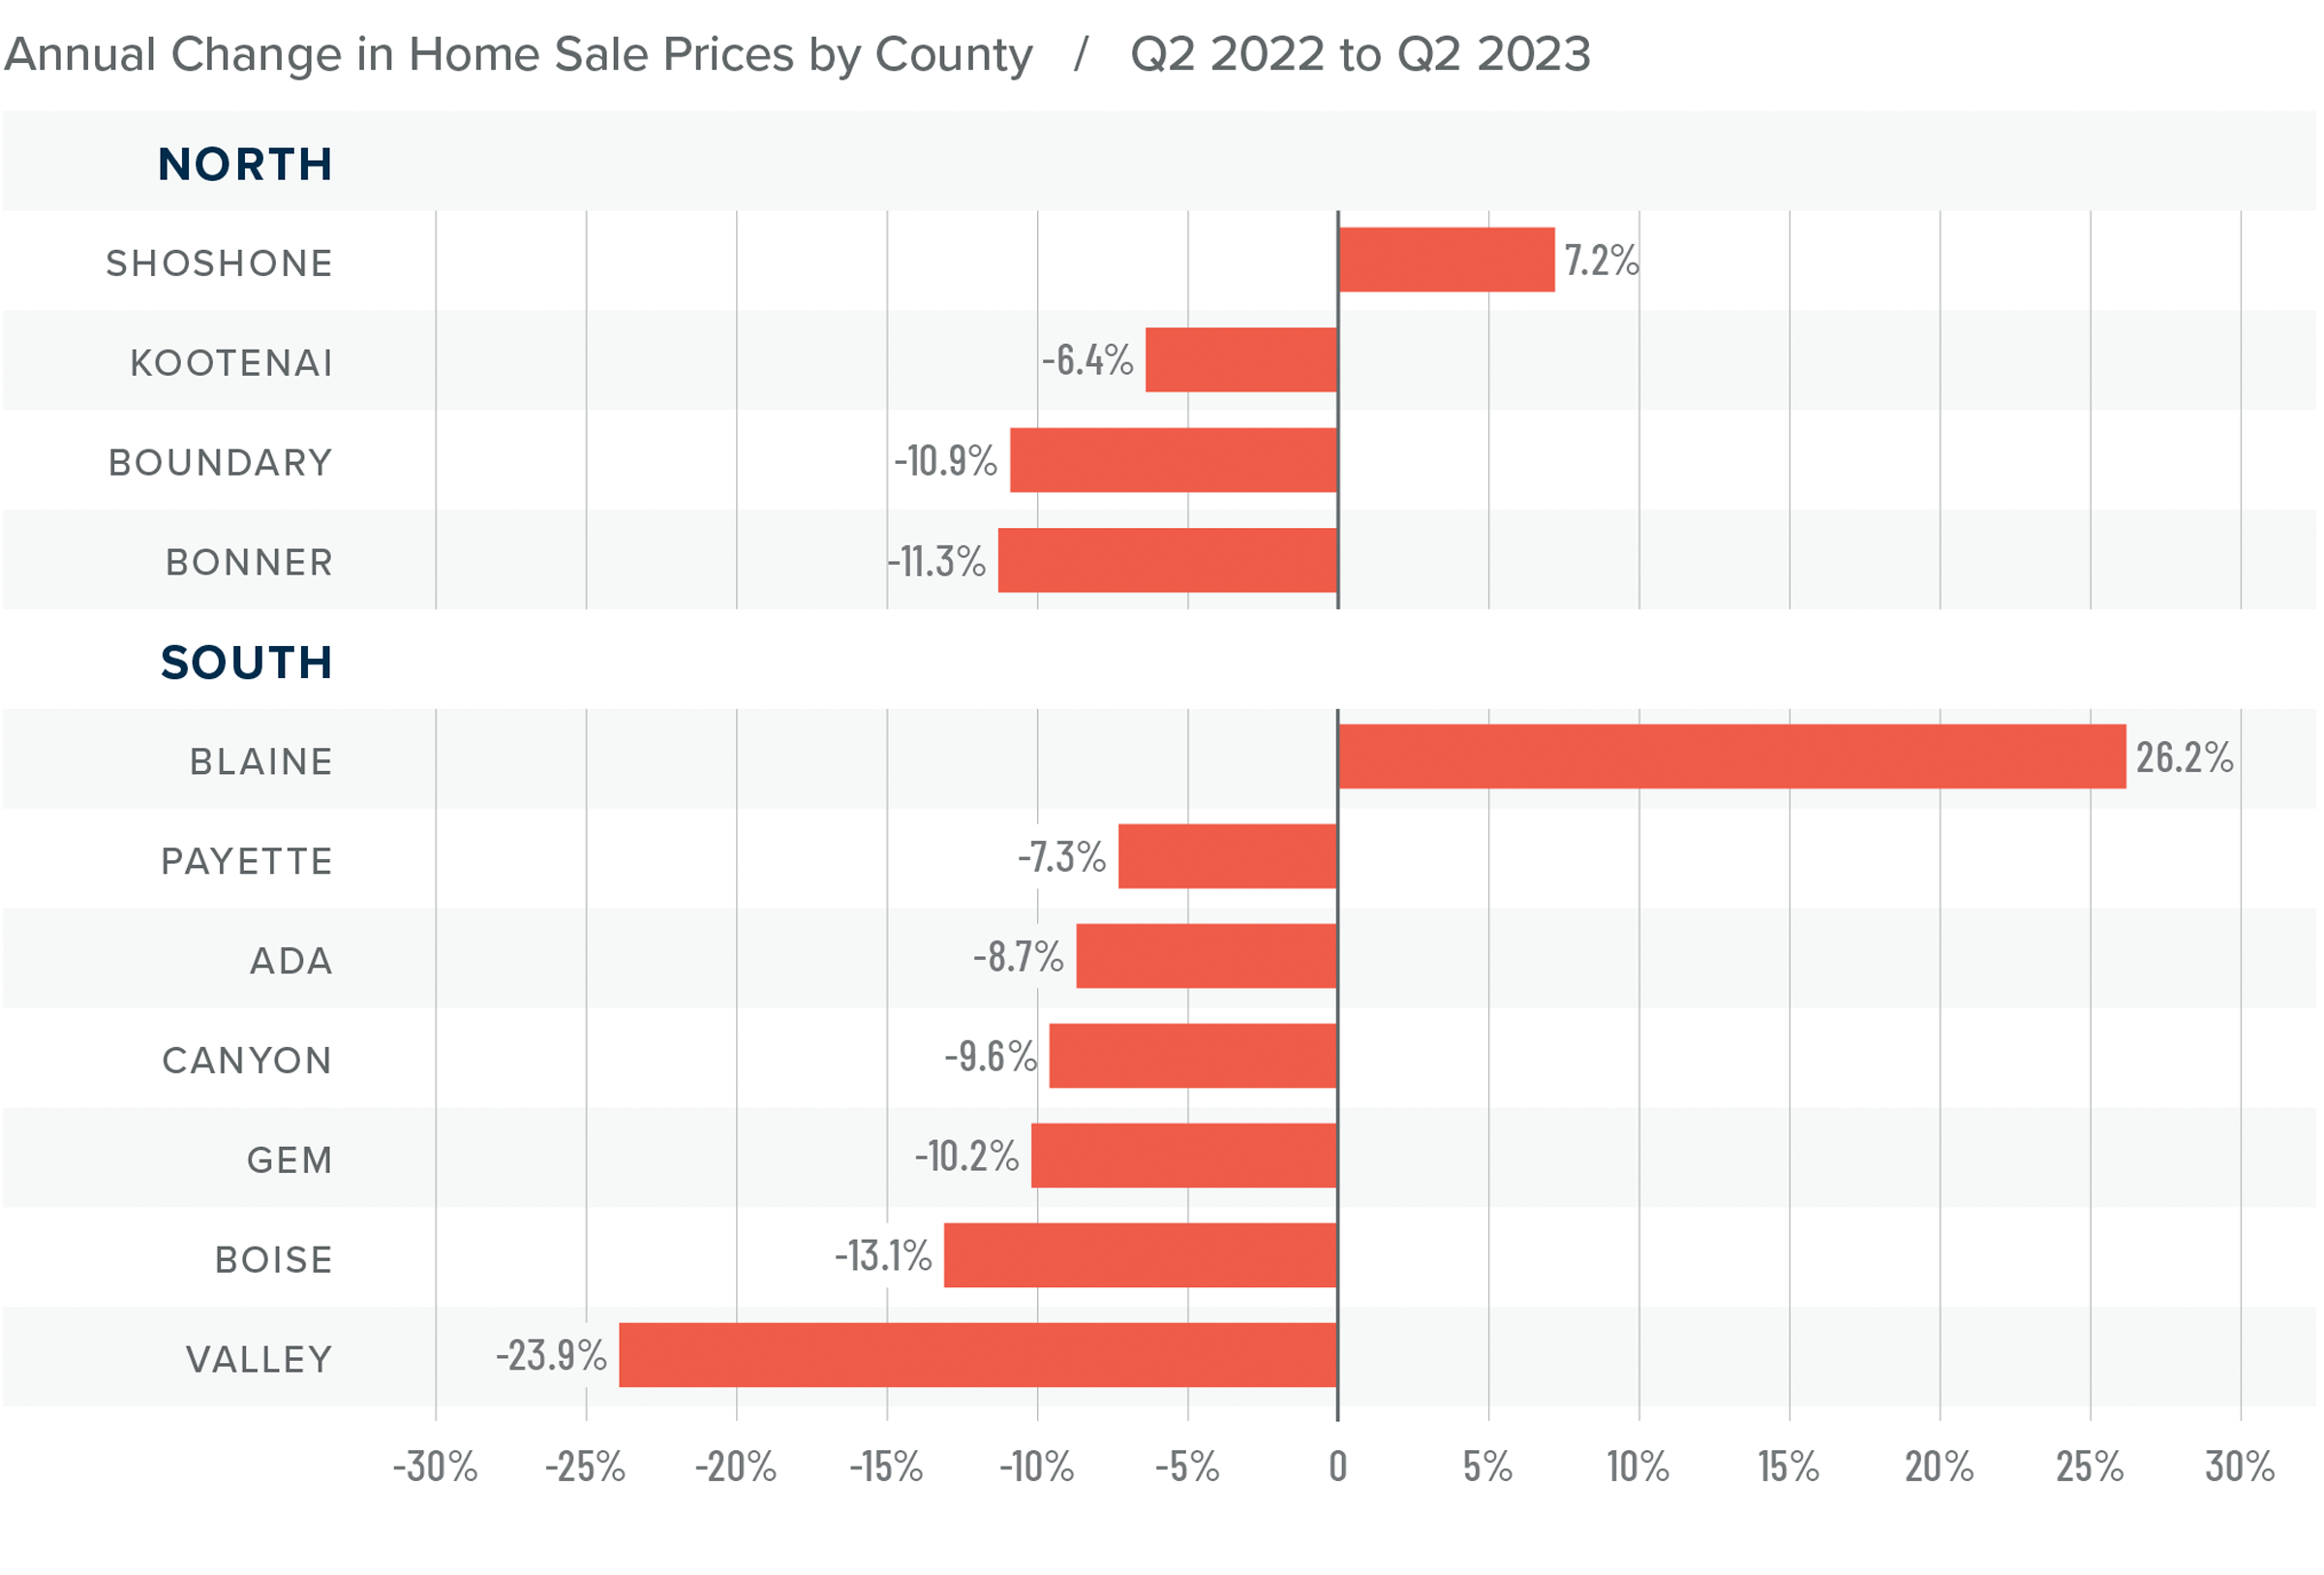
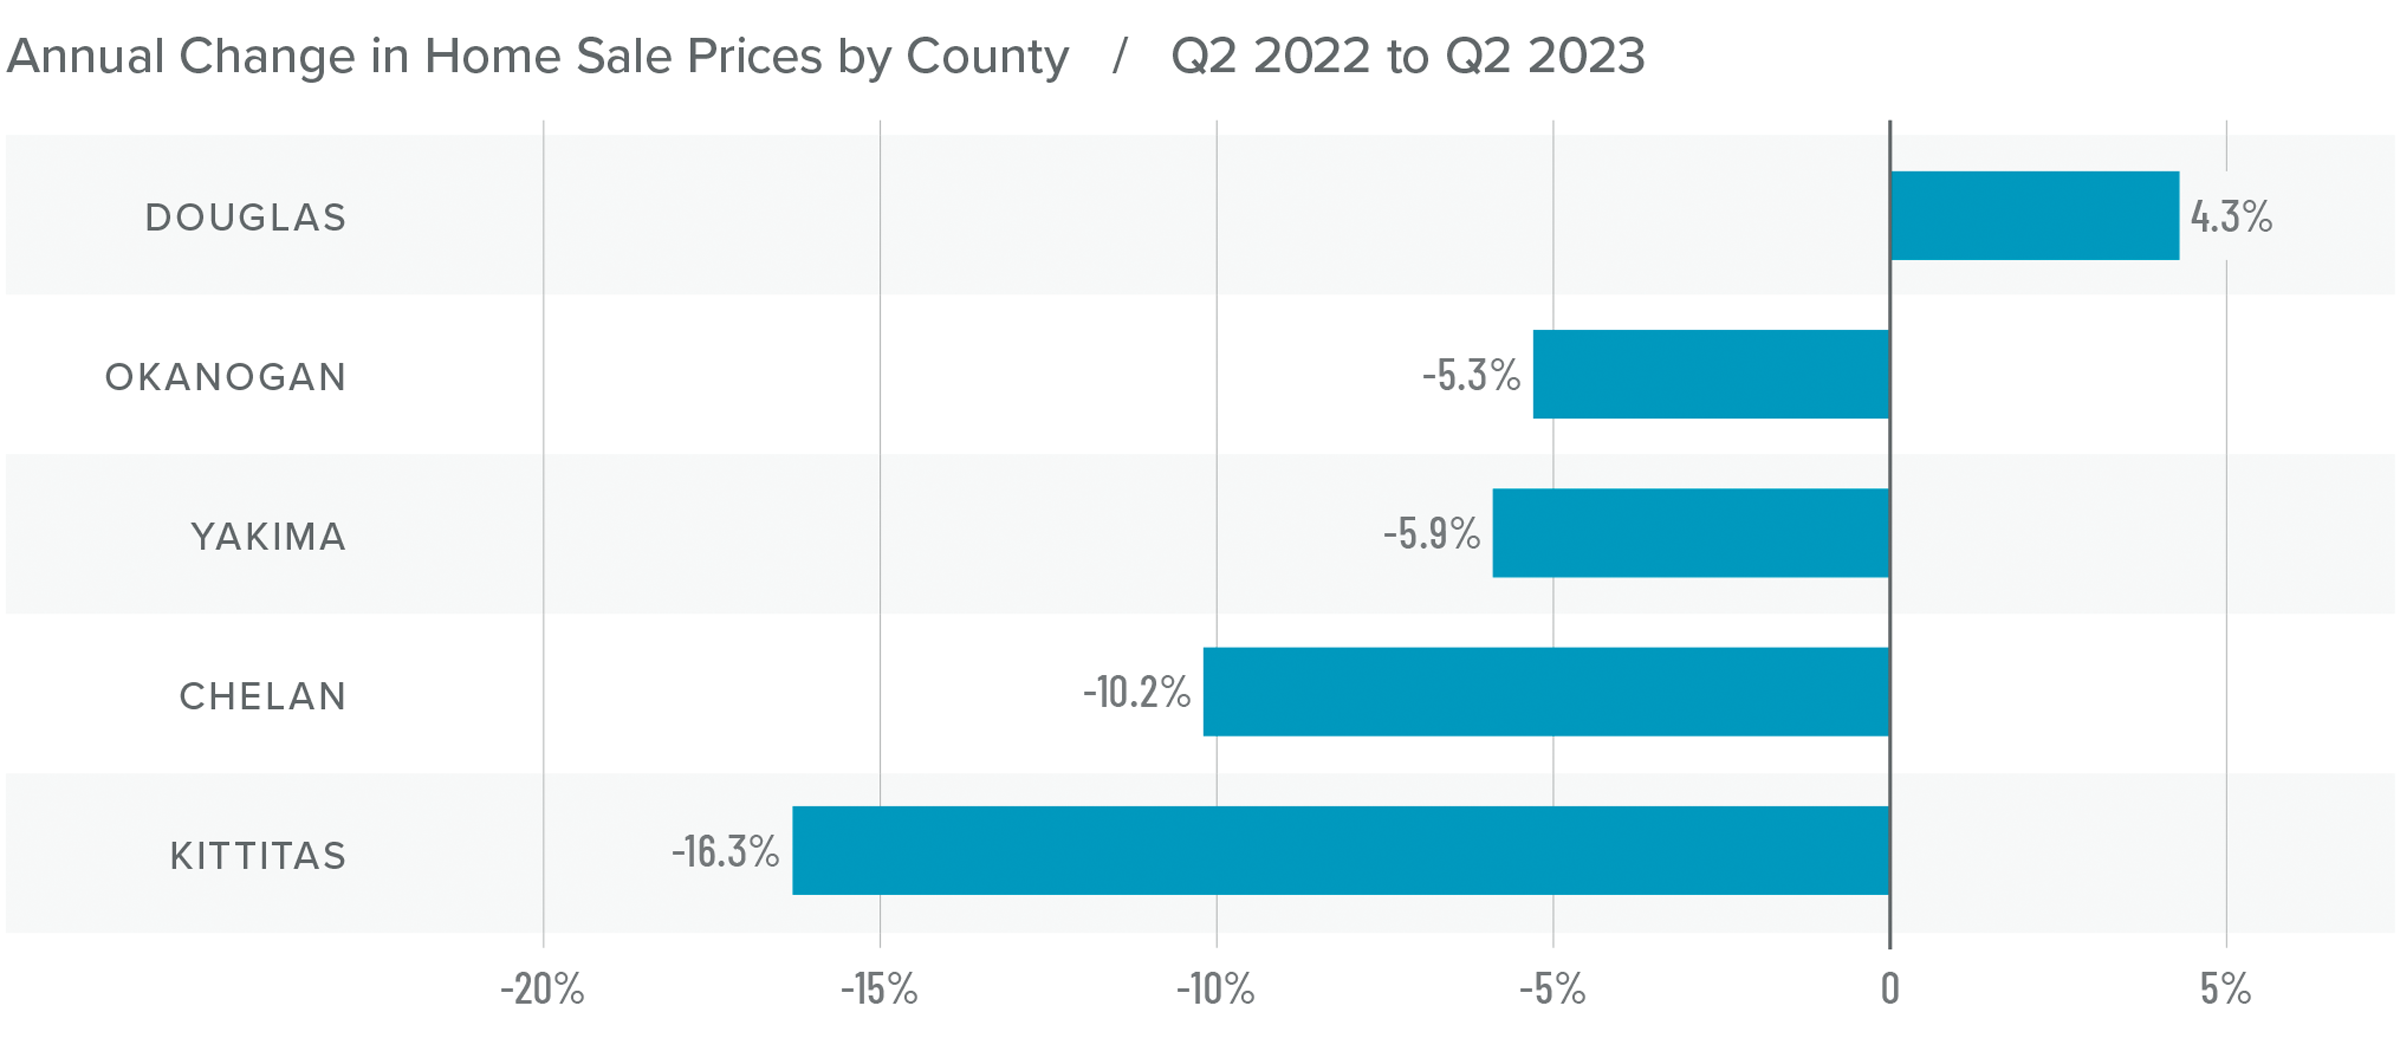
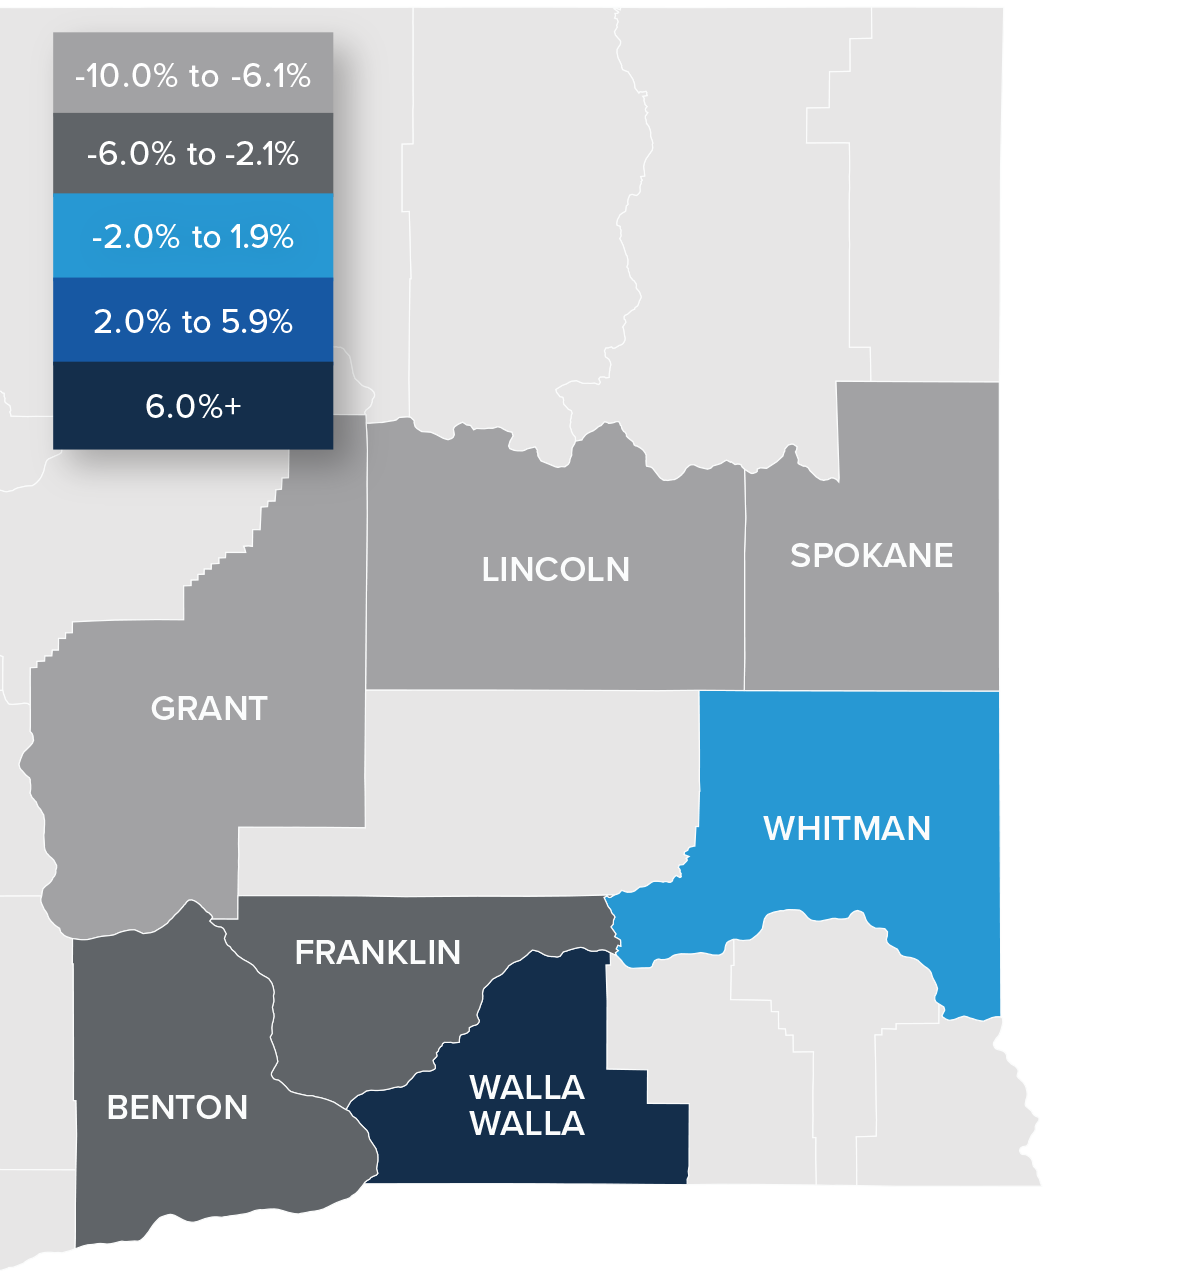
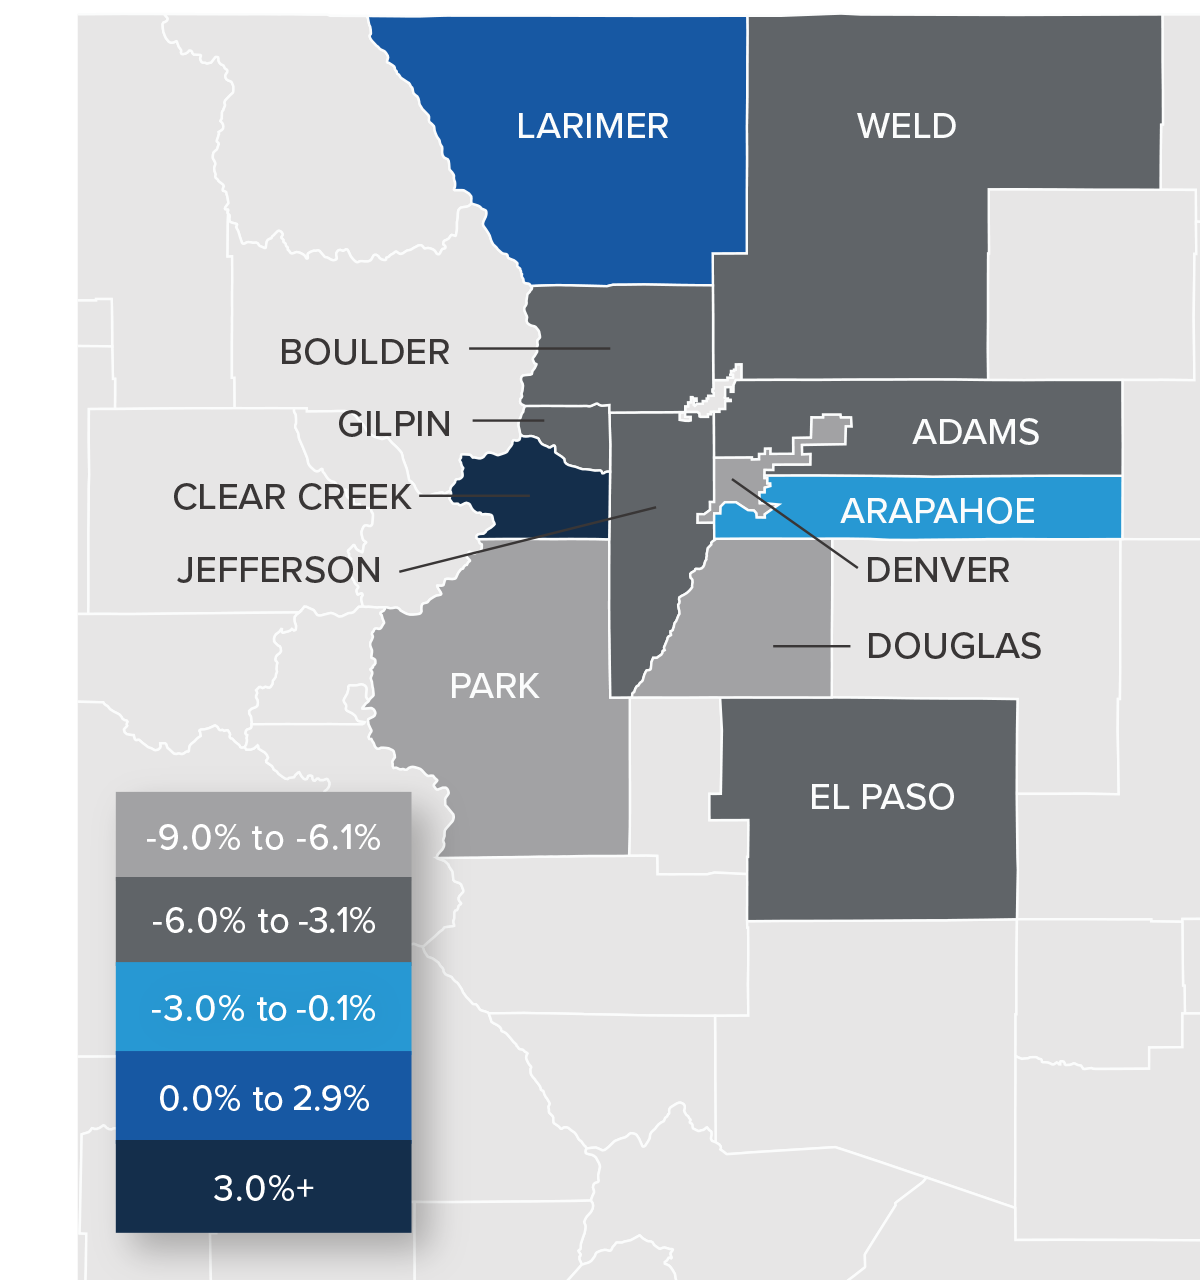
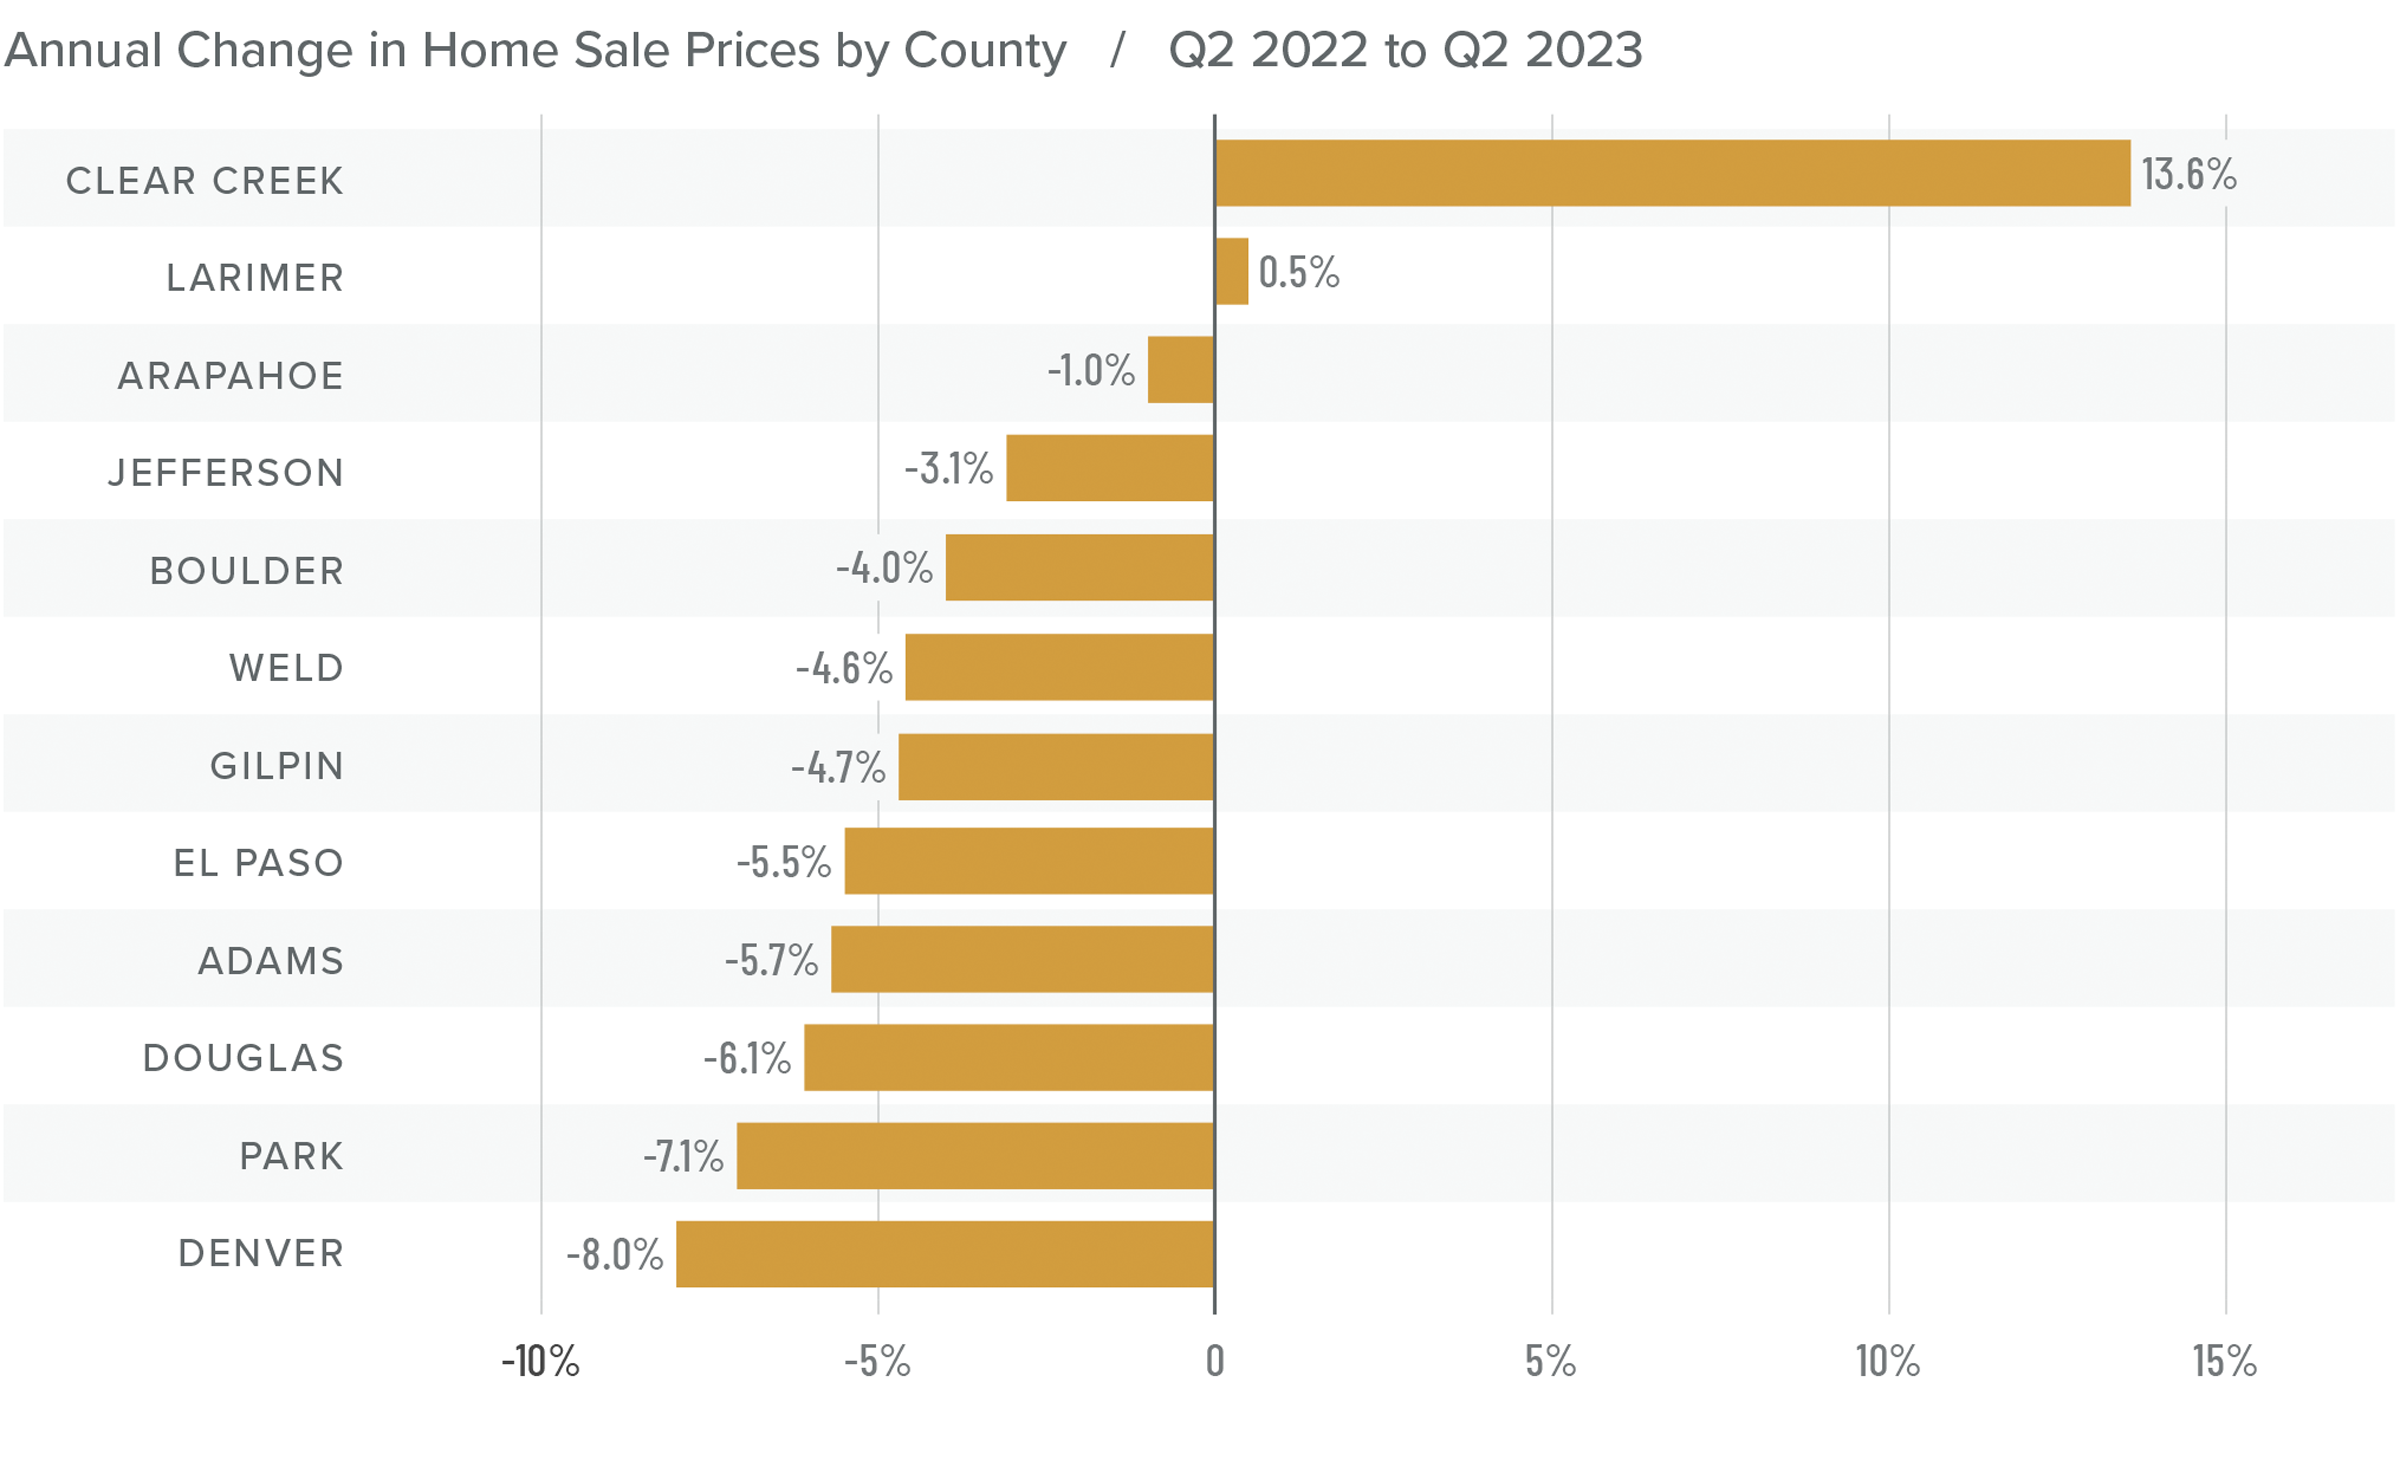
Nevada Home Prices
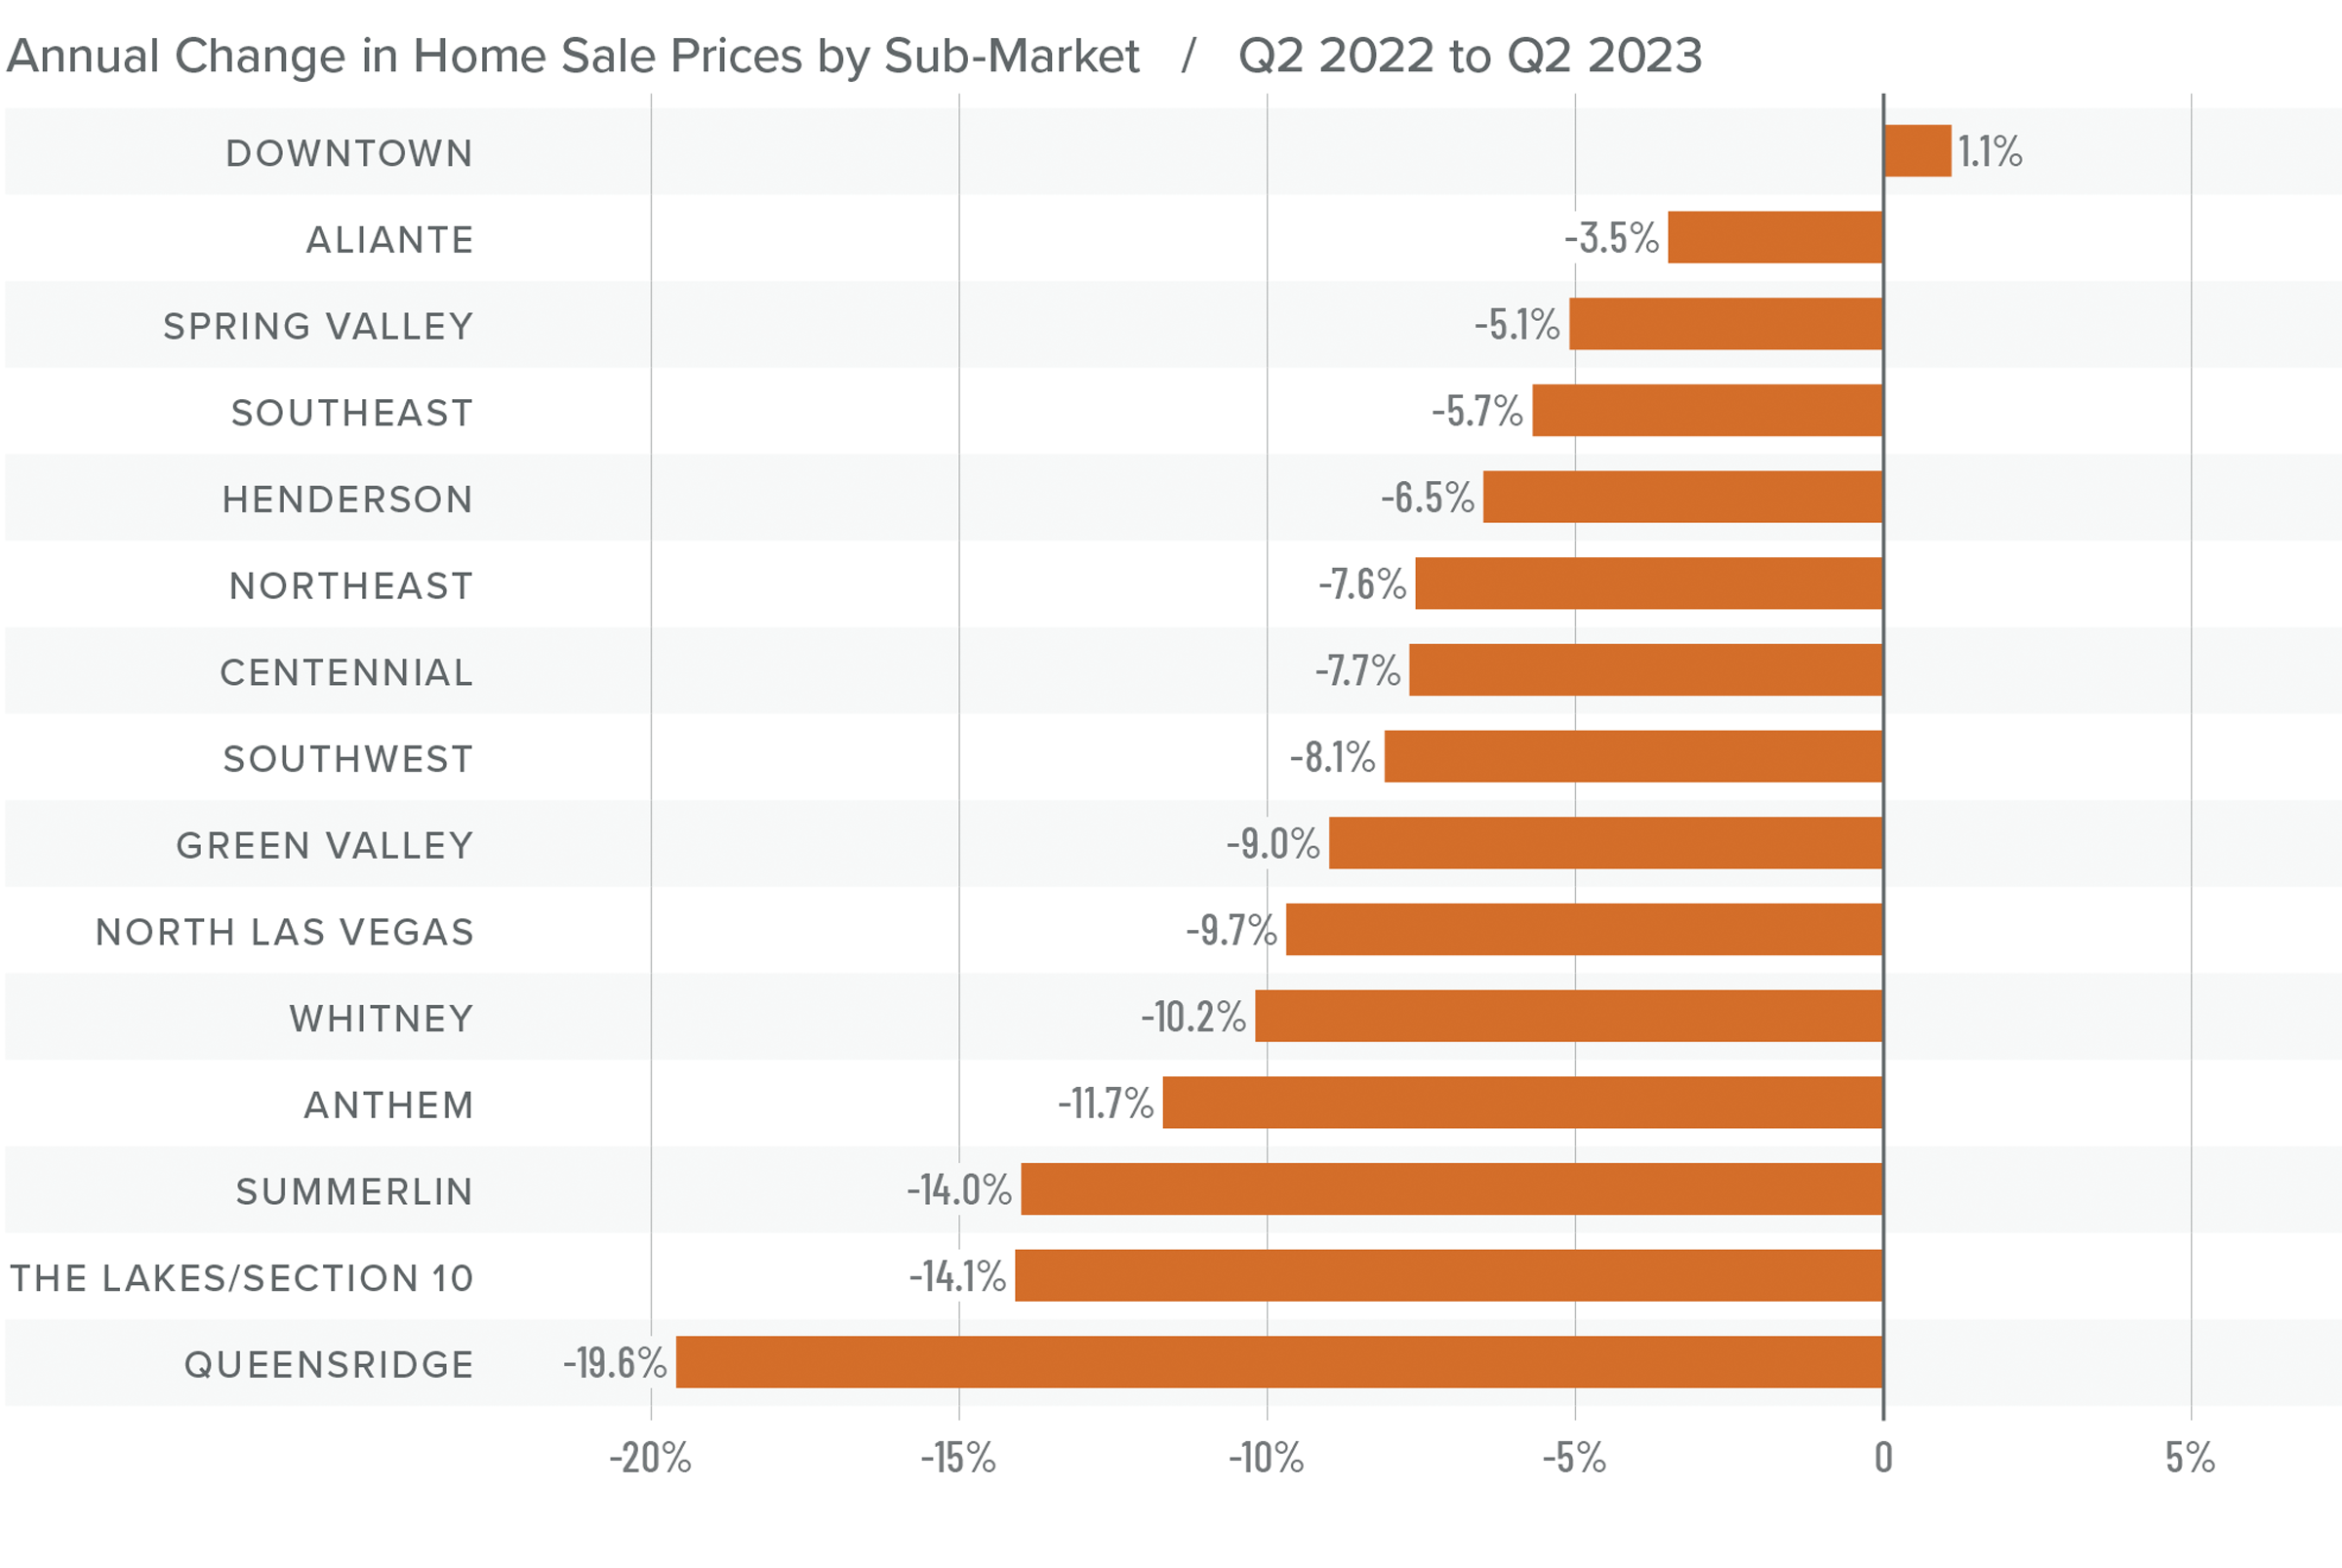
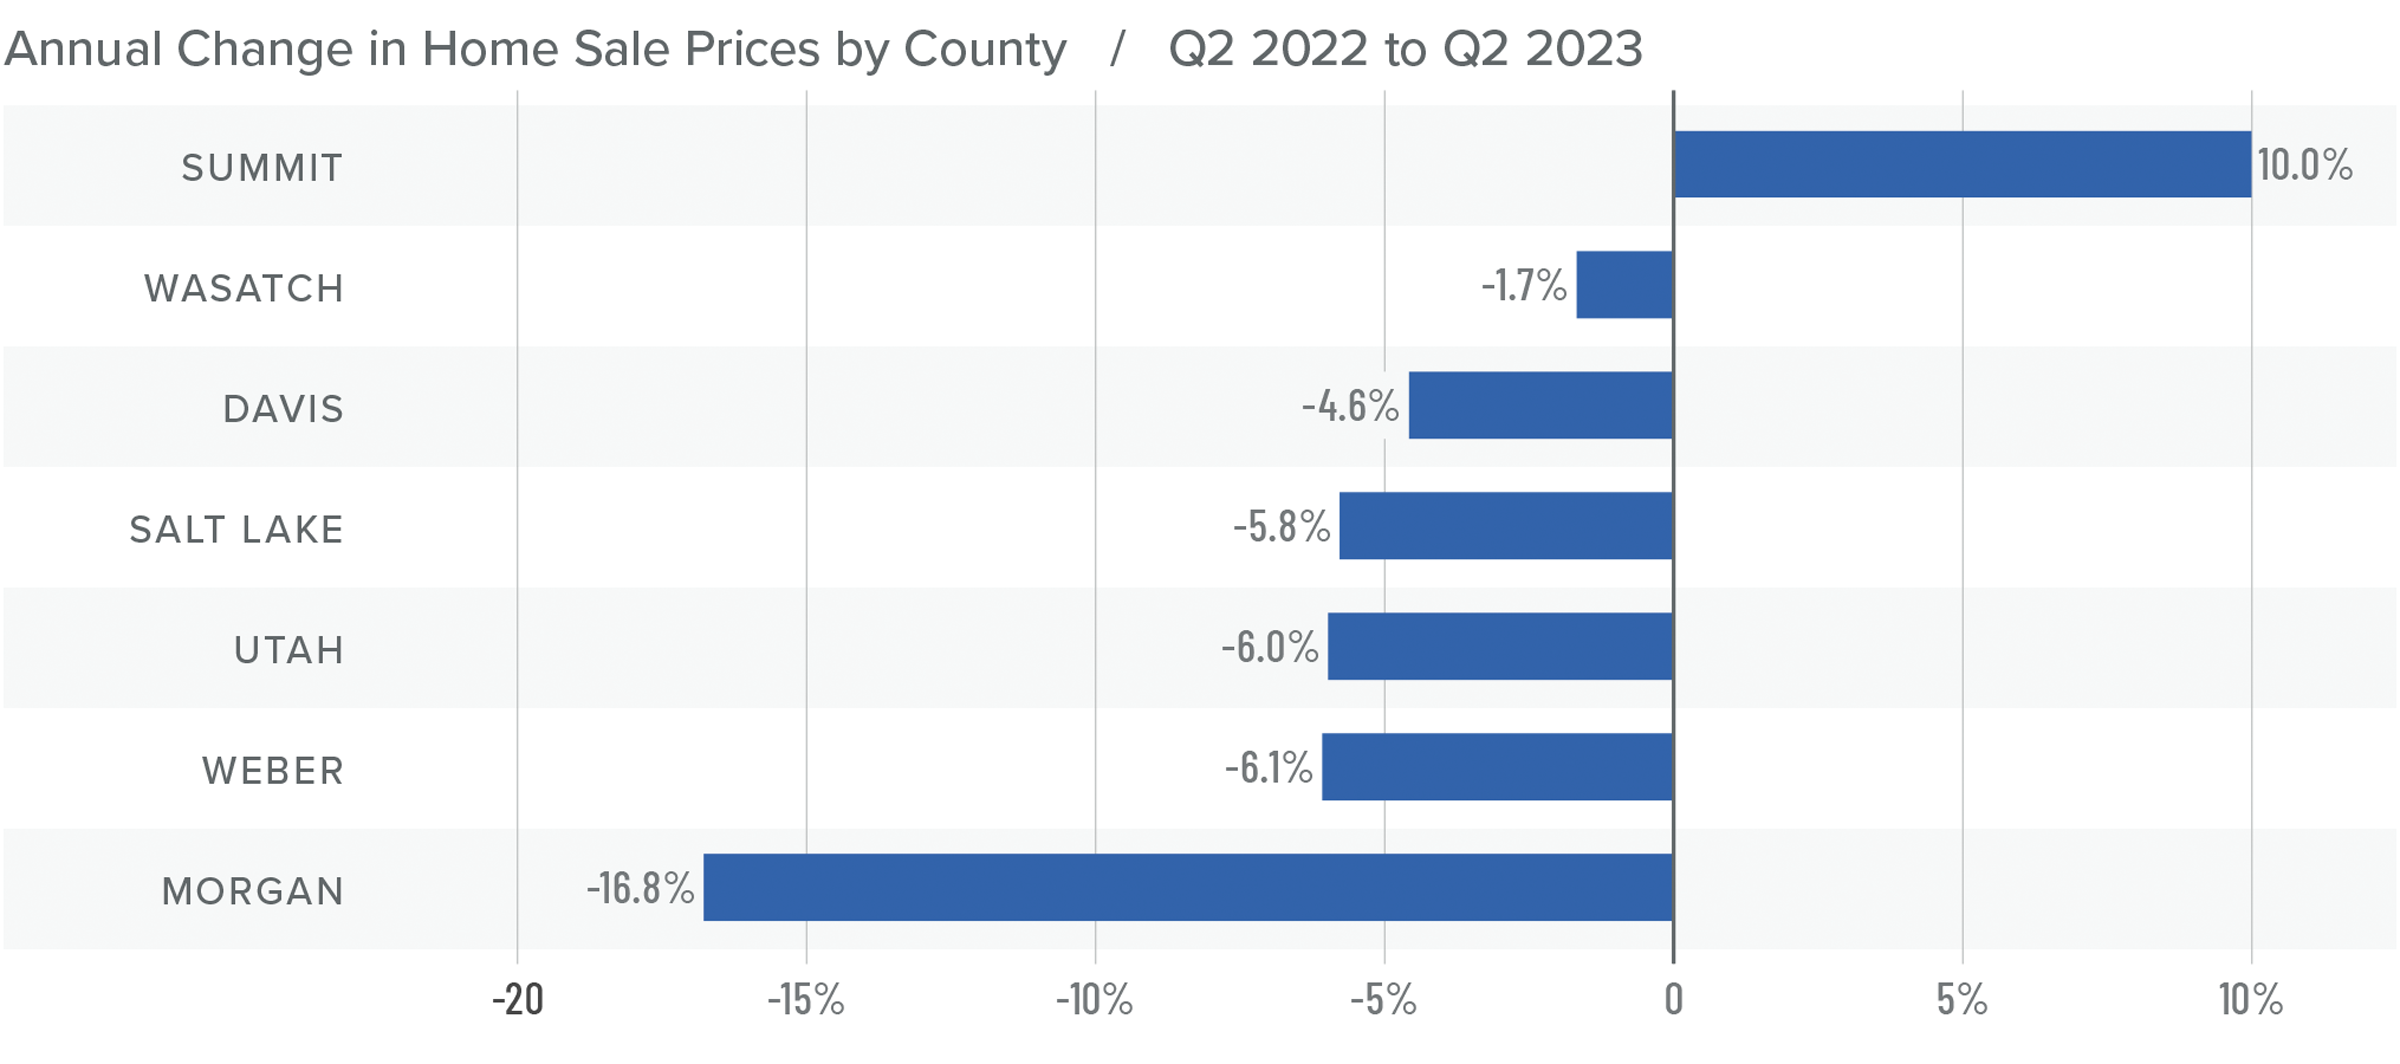
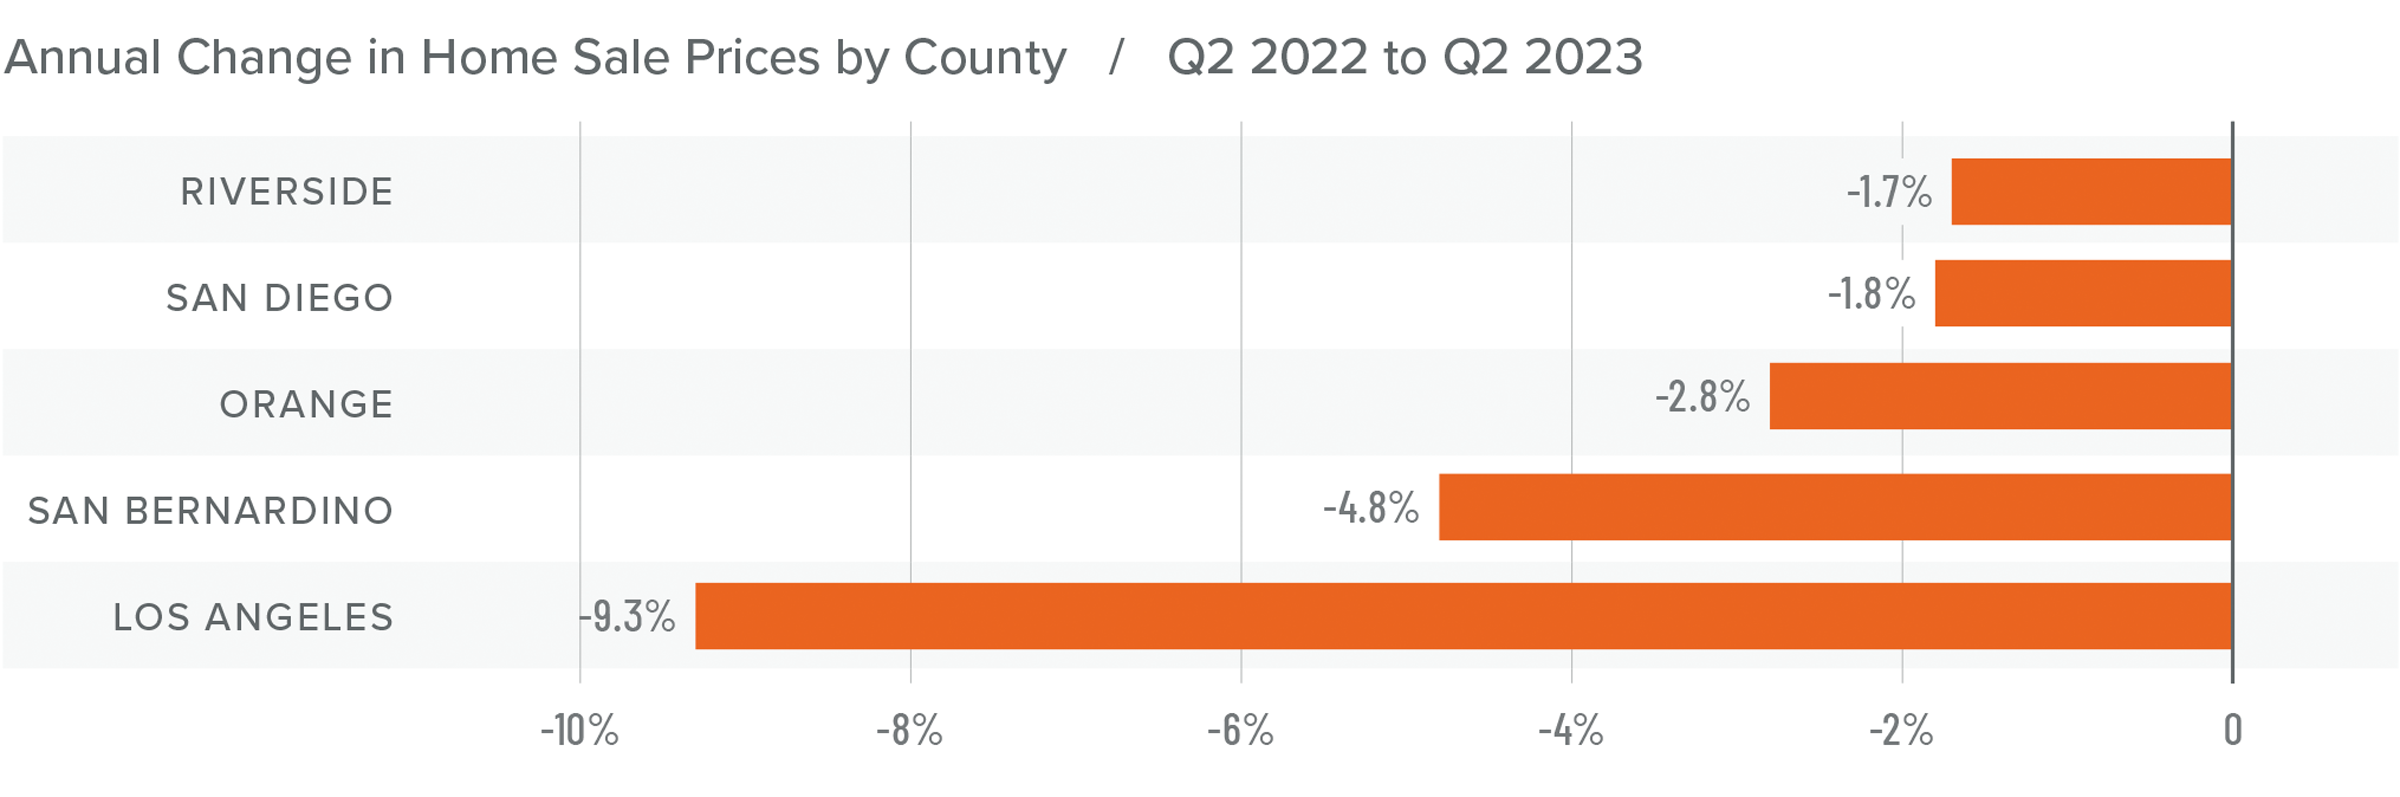
❱ Sale prices fell 10.5% year over year but rose 2.1% compared to the first quarter of 2023. The average home sale price in the area was $481,581.
❱ Median list prices rose 3.9% from the first quarter of the year. The only neighborhood where list prices fell was in Southeast Las Vegas. Even there, the decline was a very modest 1.3%.
❱ Year over year, prices fell in every market other than Downtown. However, compared to the first quarter of this year, prices rose across the board.
❱ It would be natural to think that prices should have fallen further given deteriorating affordability and far higher mortgage rates than we have seen in a number of years; however, that does not appear to be the case.
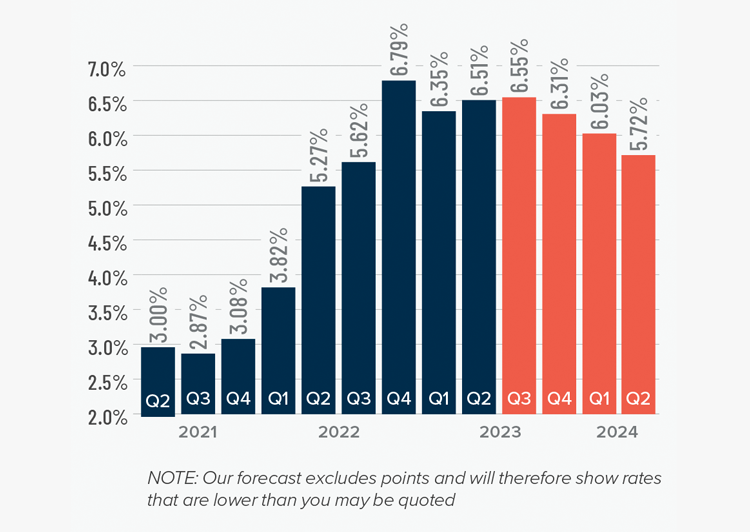
Mortgage Rates
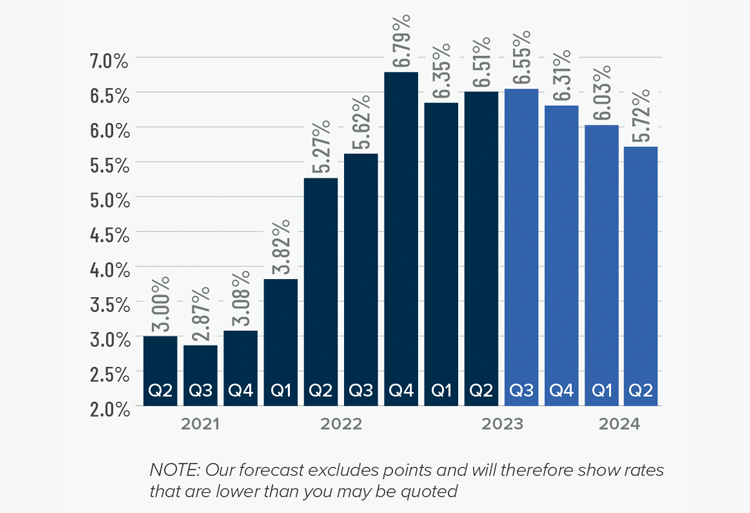
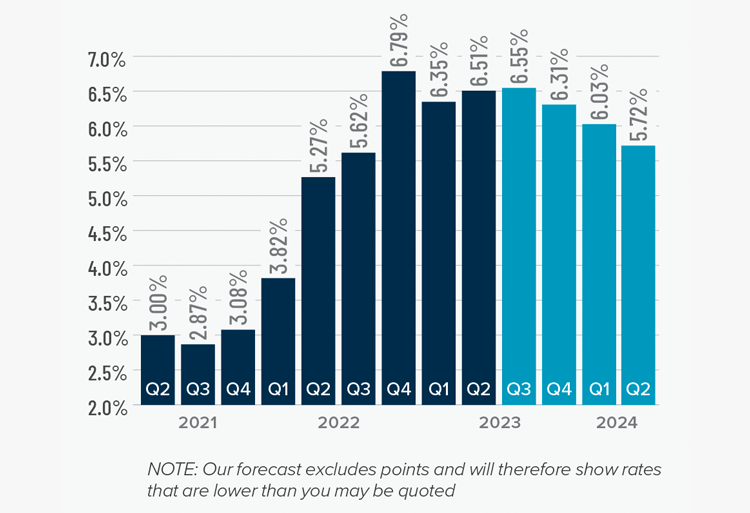
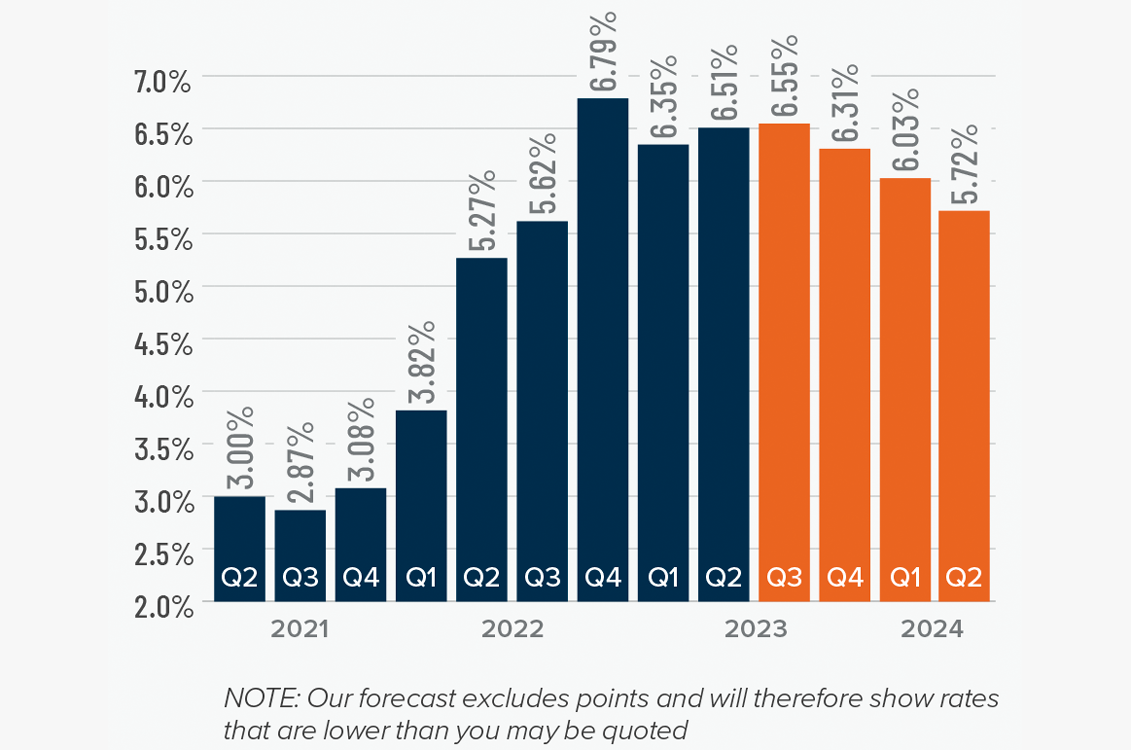
Although they were less erratic than the first quarter, mortgage rates unfortunately trended higher and ended the quarter above 7%. This was due to the short debt ceiling impasse, as well as several economic datasets that suggested the U.S. economy was not slowing at the speed required by the Federal Reserve.
While the June employment report showed fewer jobs created than earlier in the year, as well as downward revisions to prior gains, inflation has not sufficiently slowed. Until it does, rates cannot start to trend consistently lower. With the economy not slowing as fast as expected, I have adjusted my forecast: Rates will hold at current levels in third quarter and then start to trend lower through the fall. Although there are sure to be occasional spikes, my model now shows the 30-year fixed rate breaking below 6% next spring.

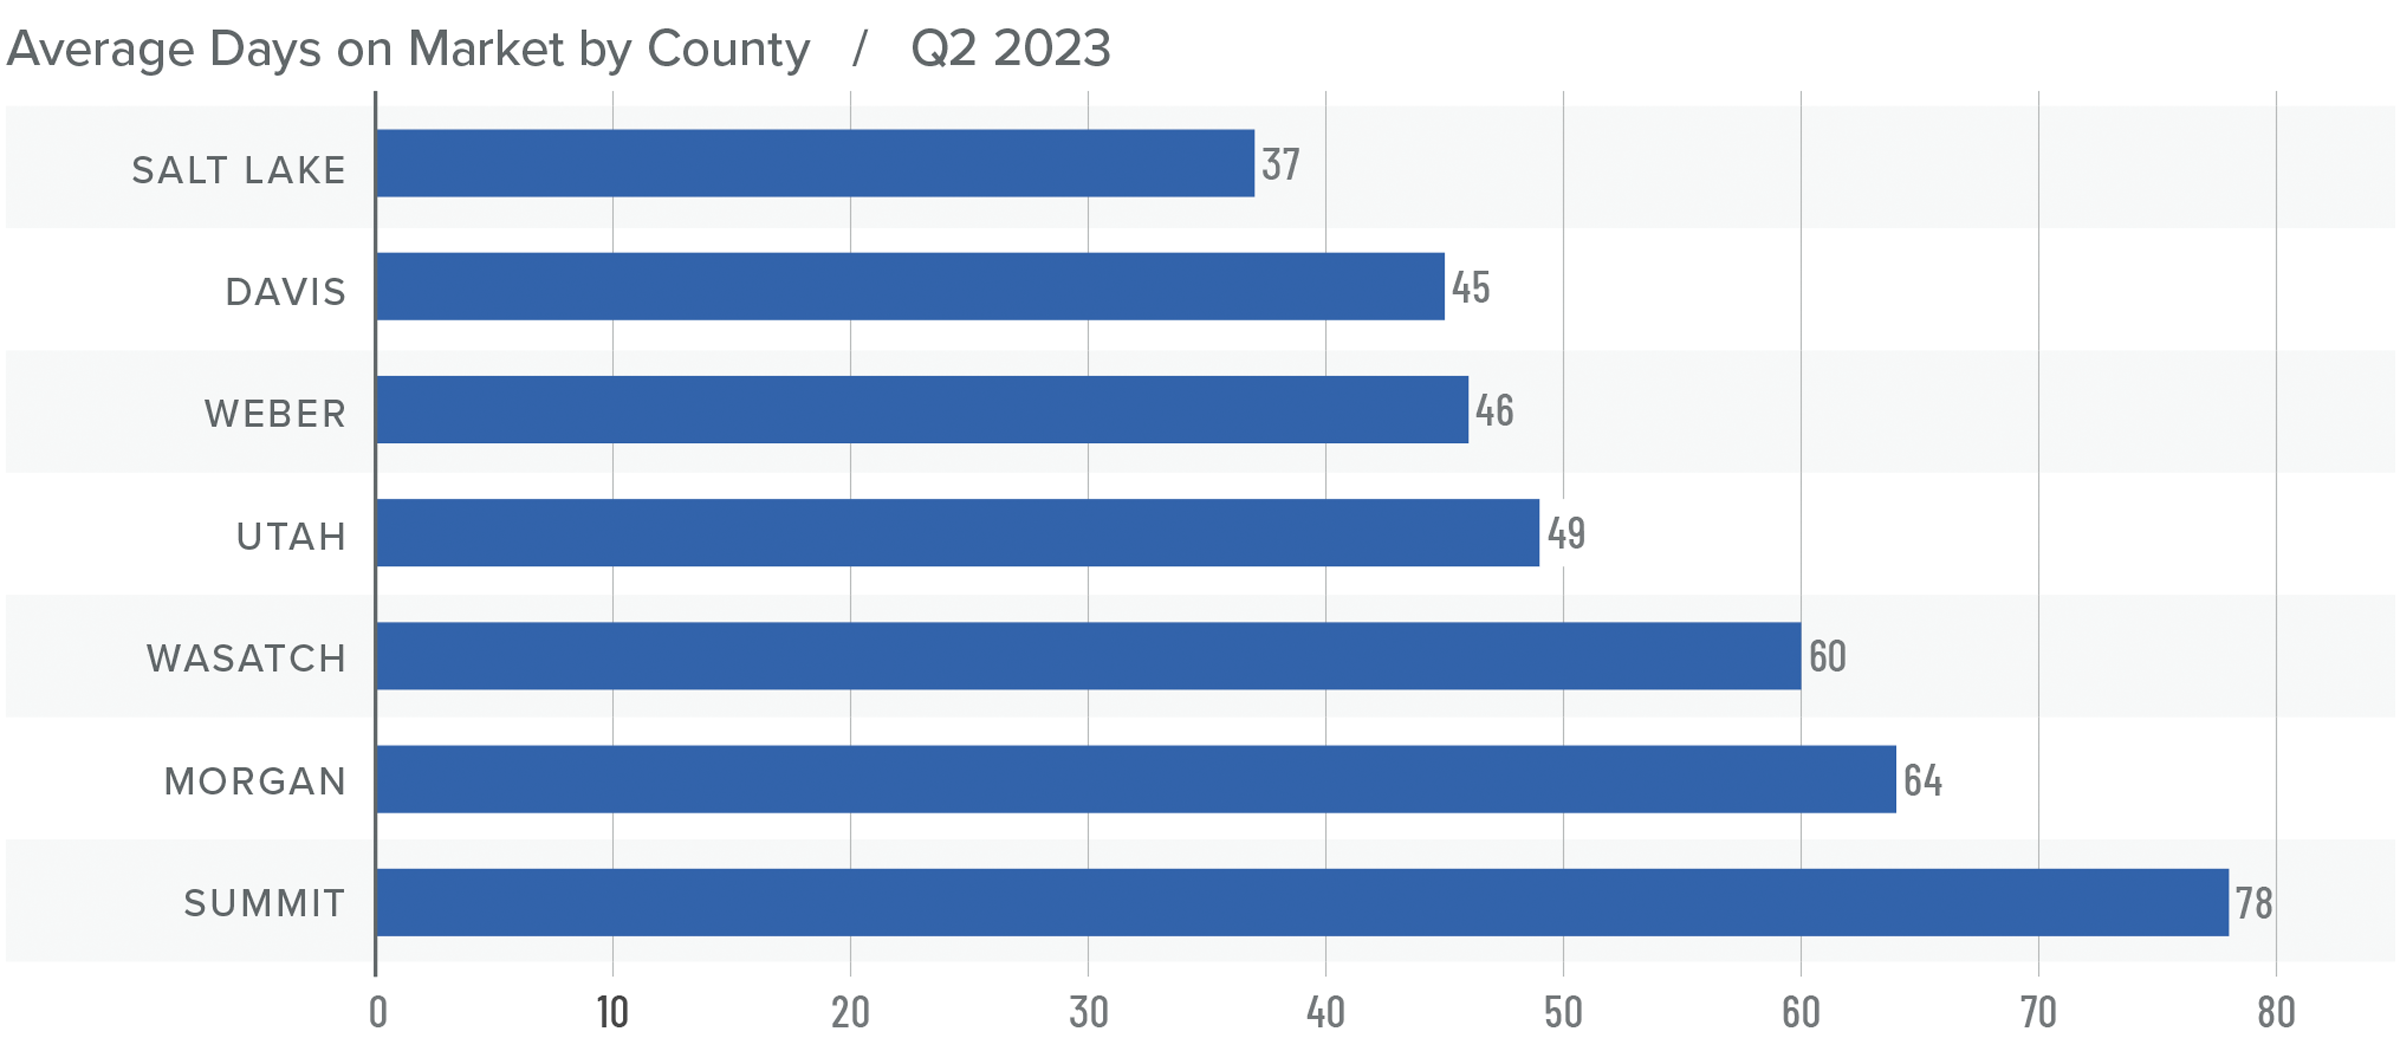
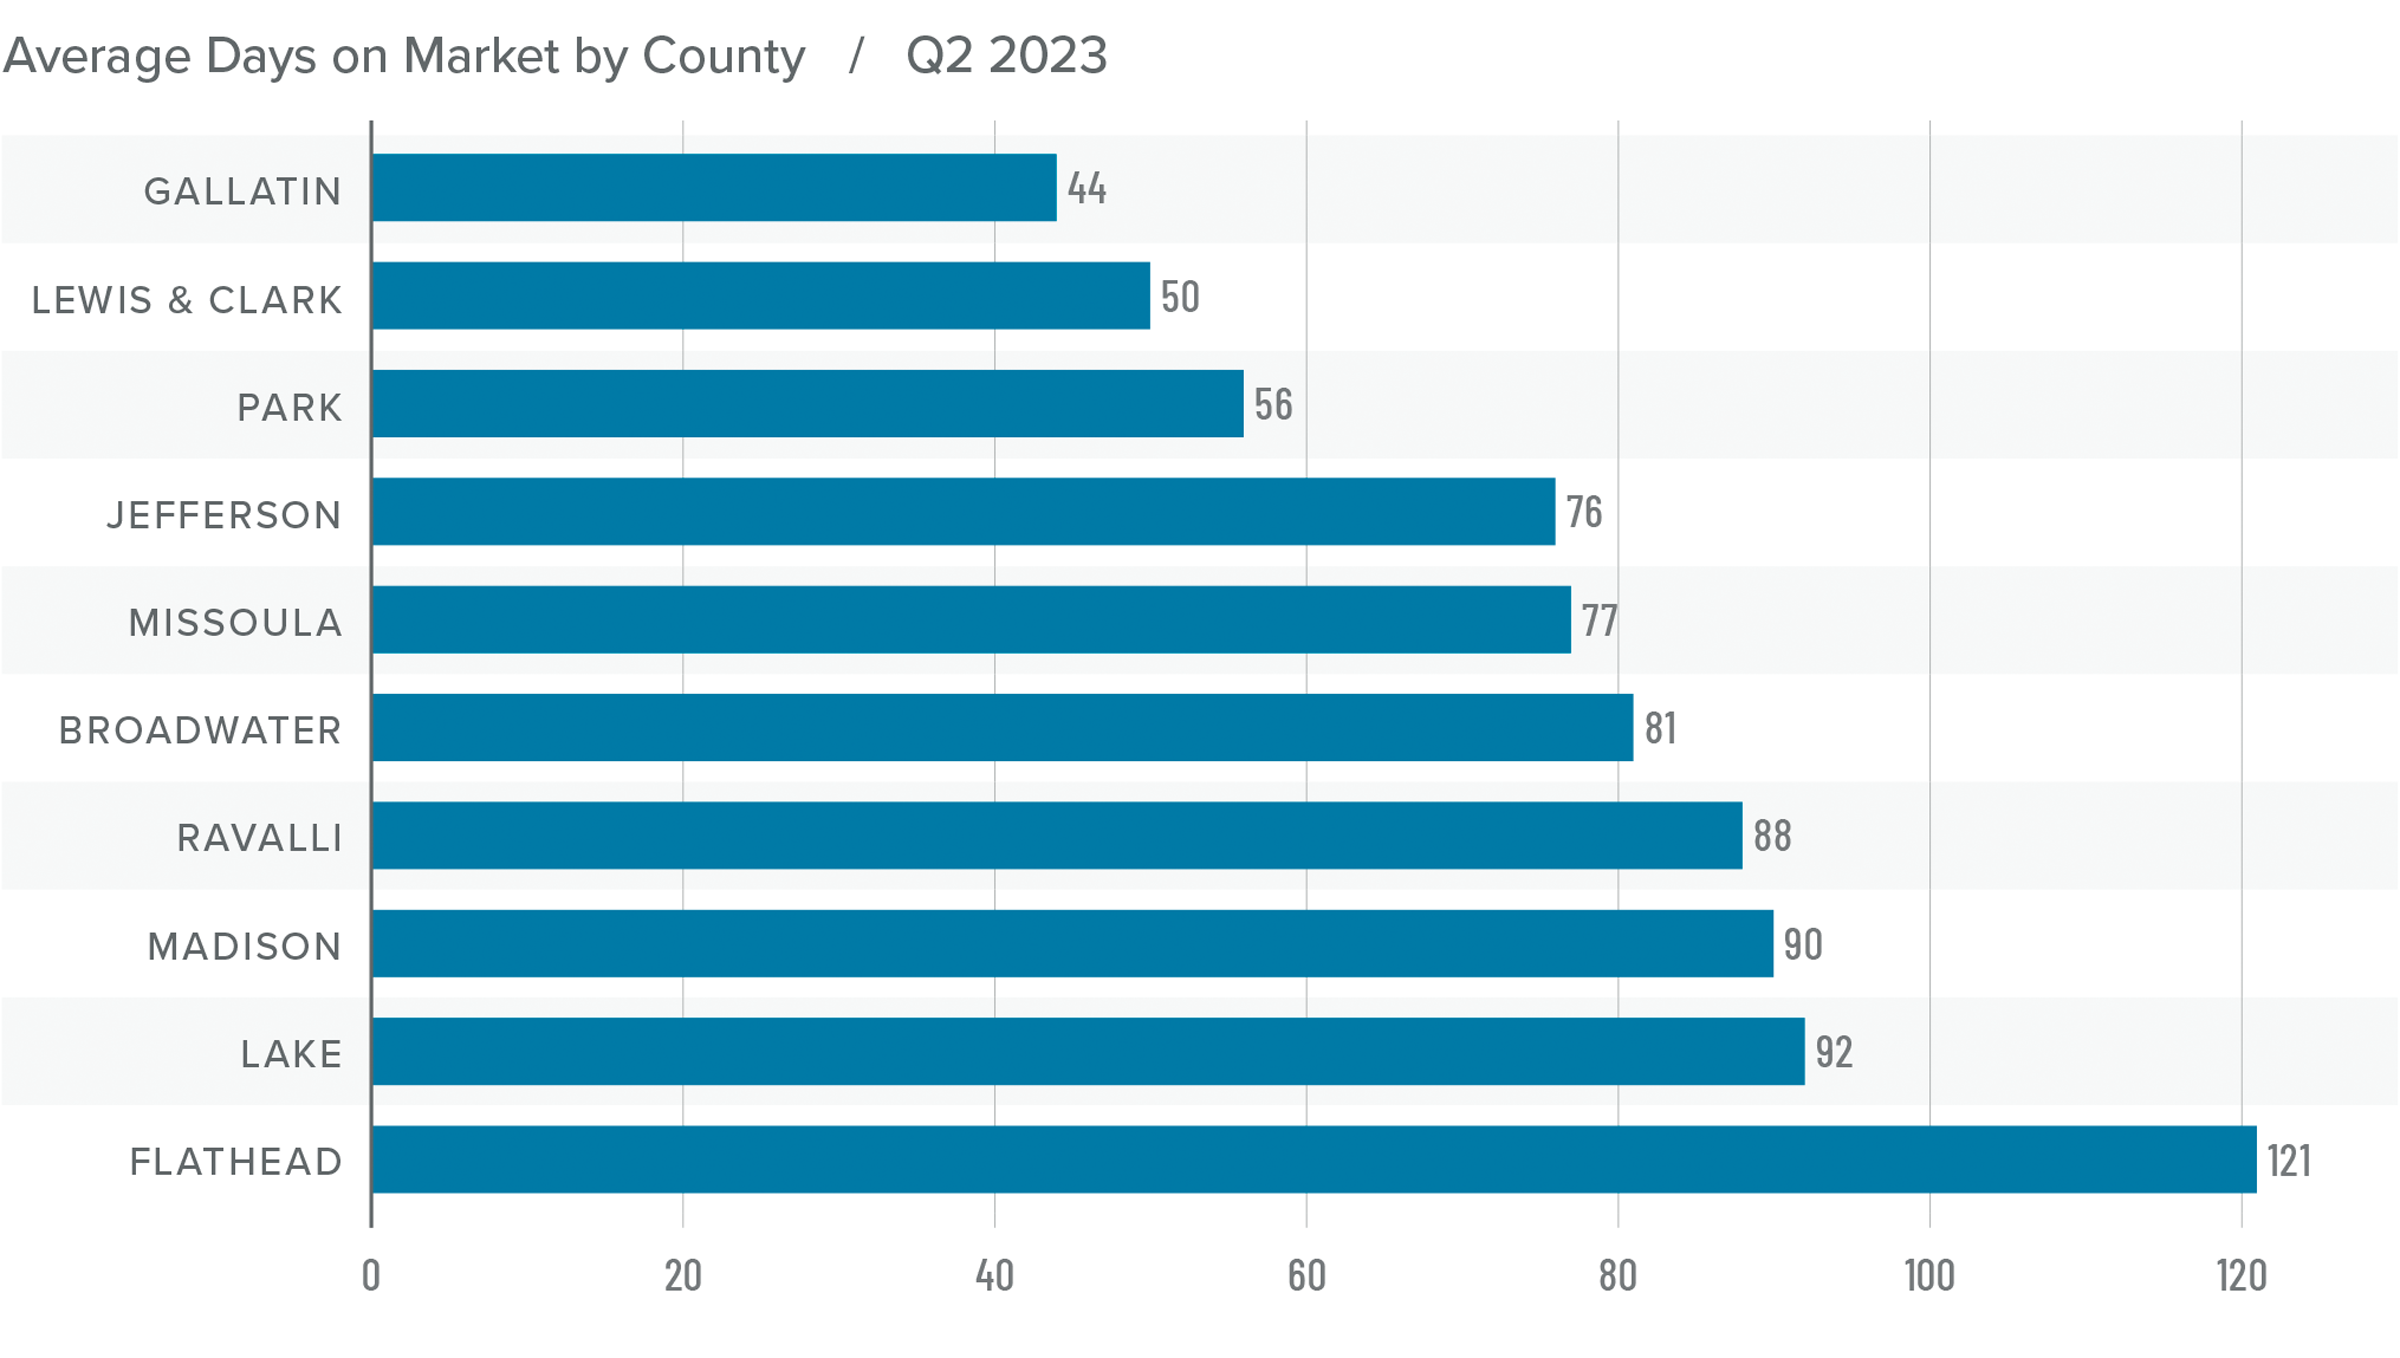
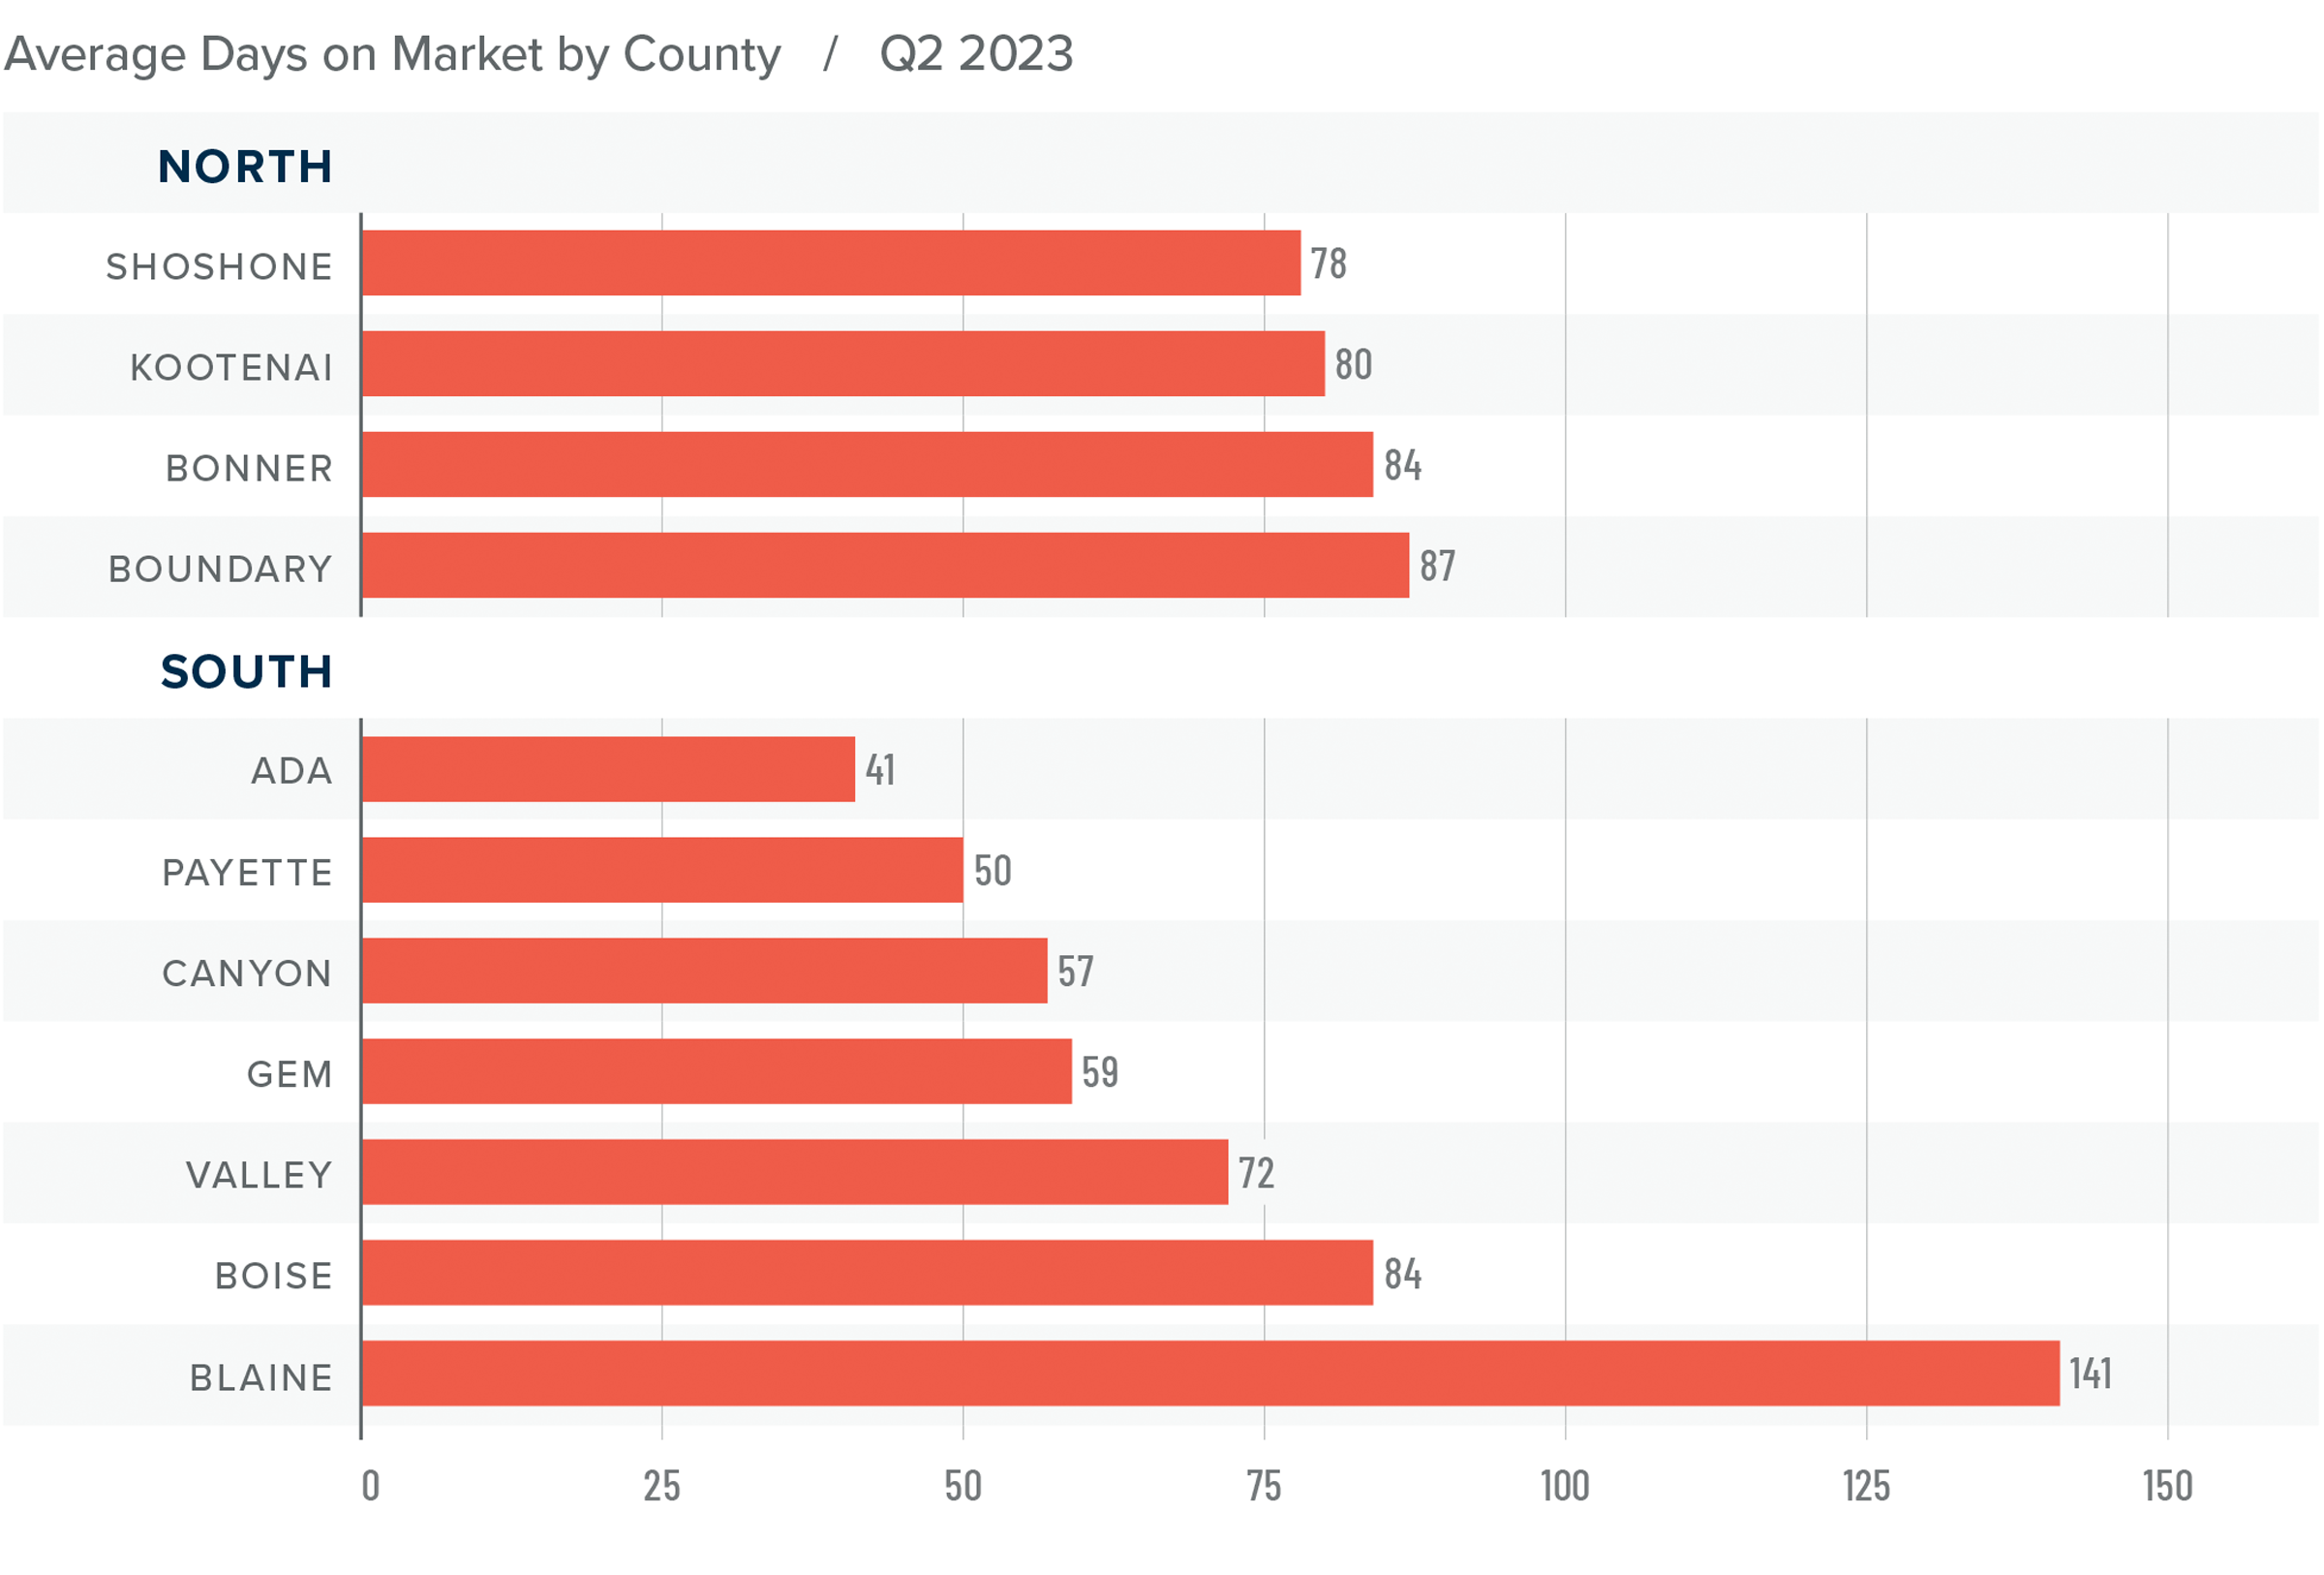
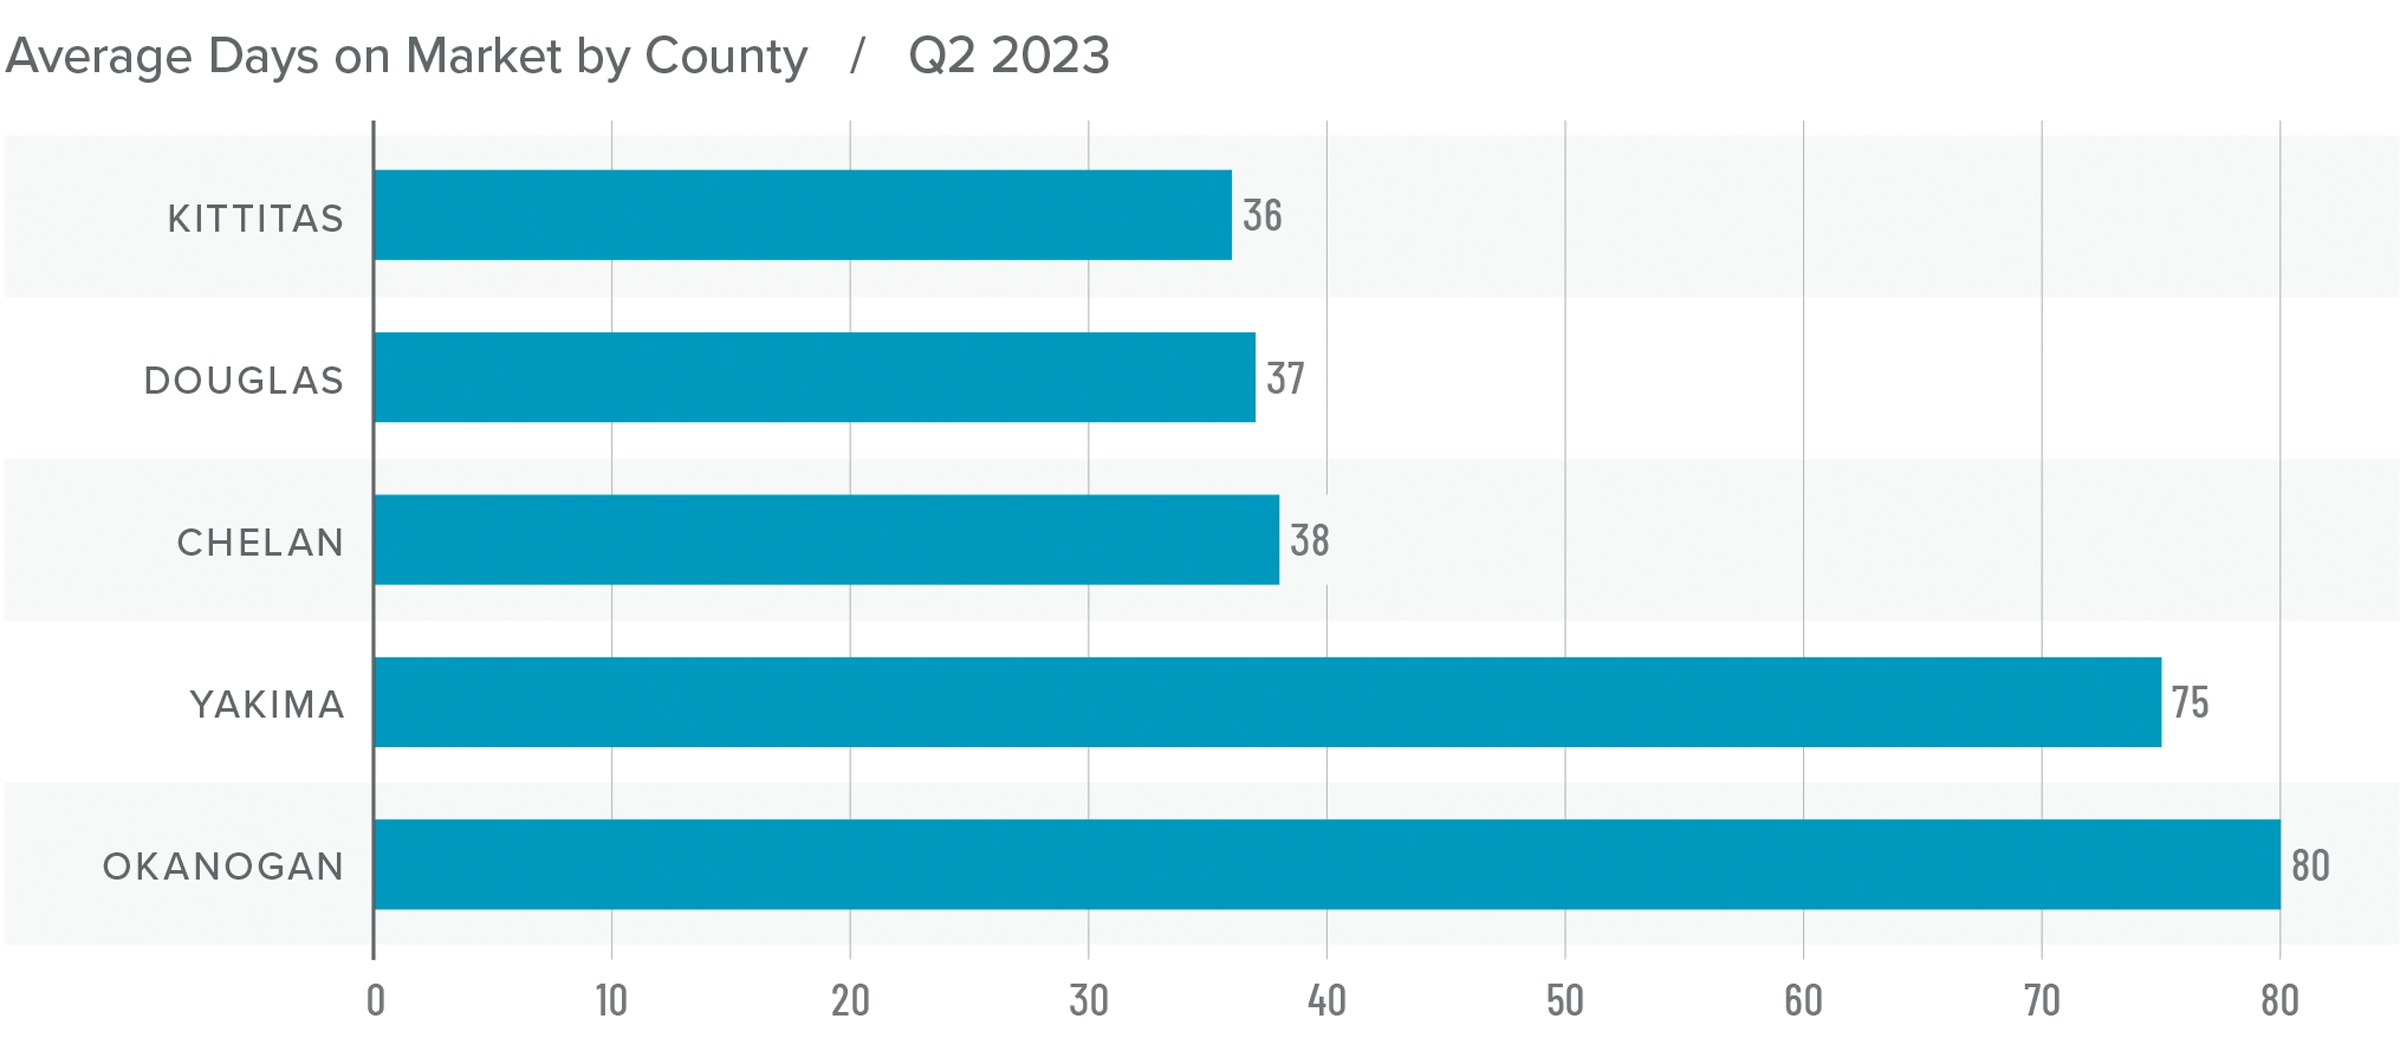
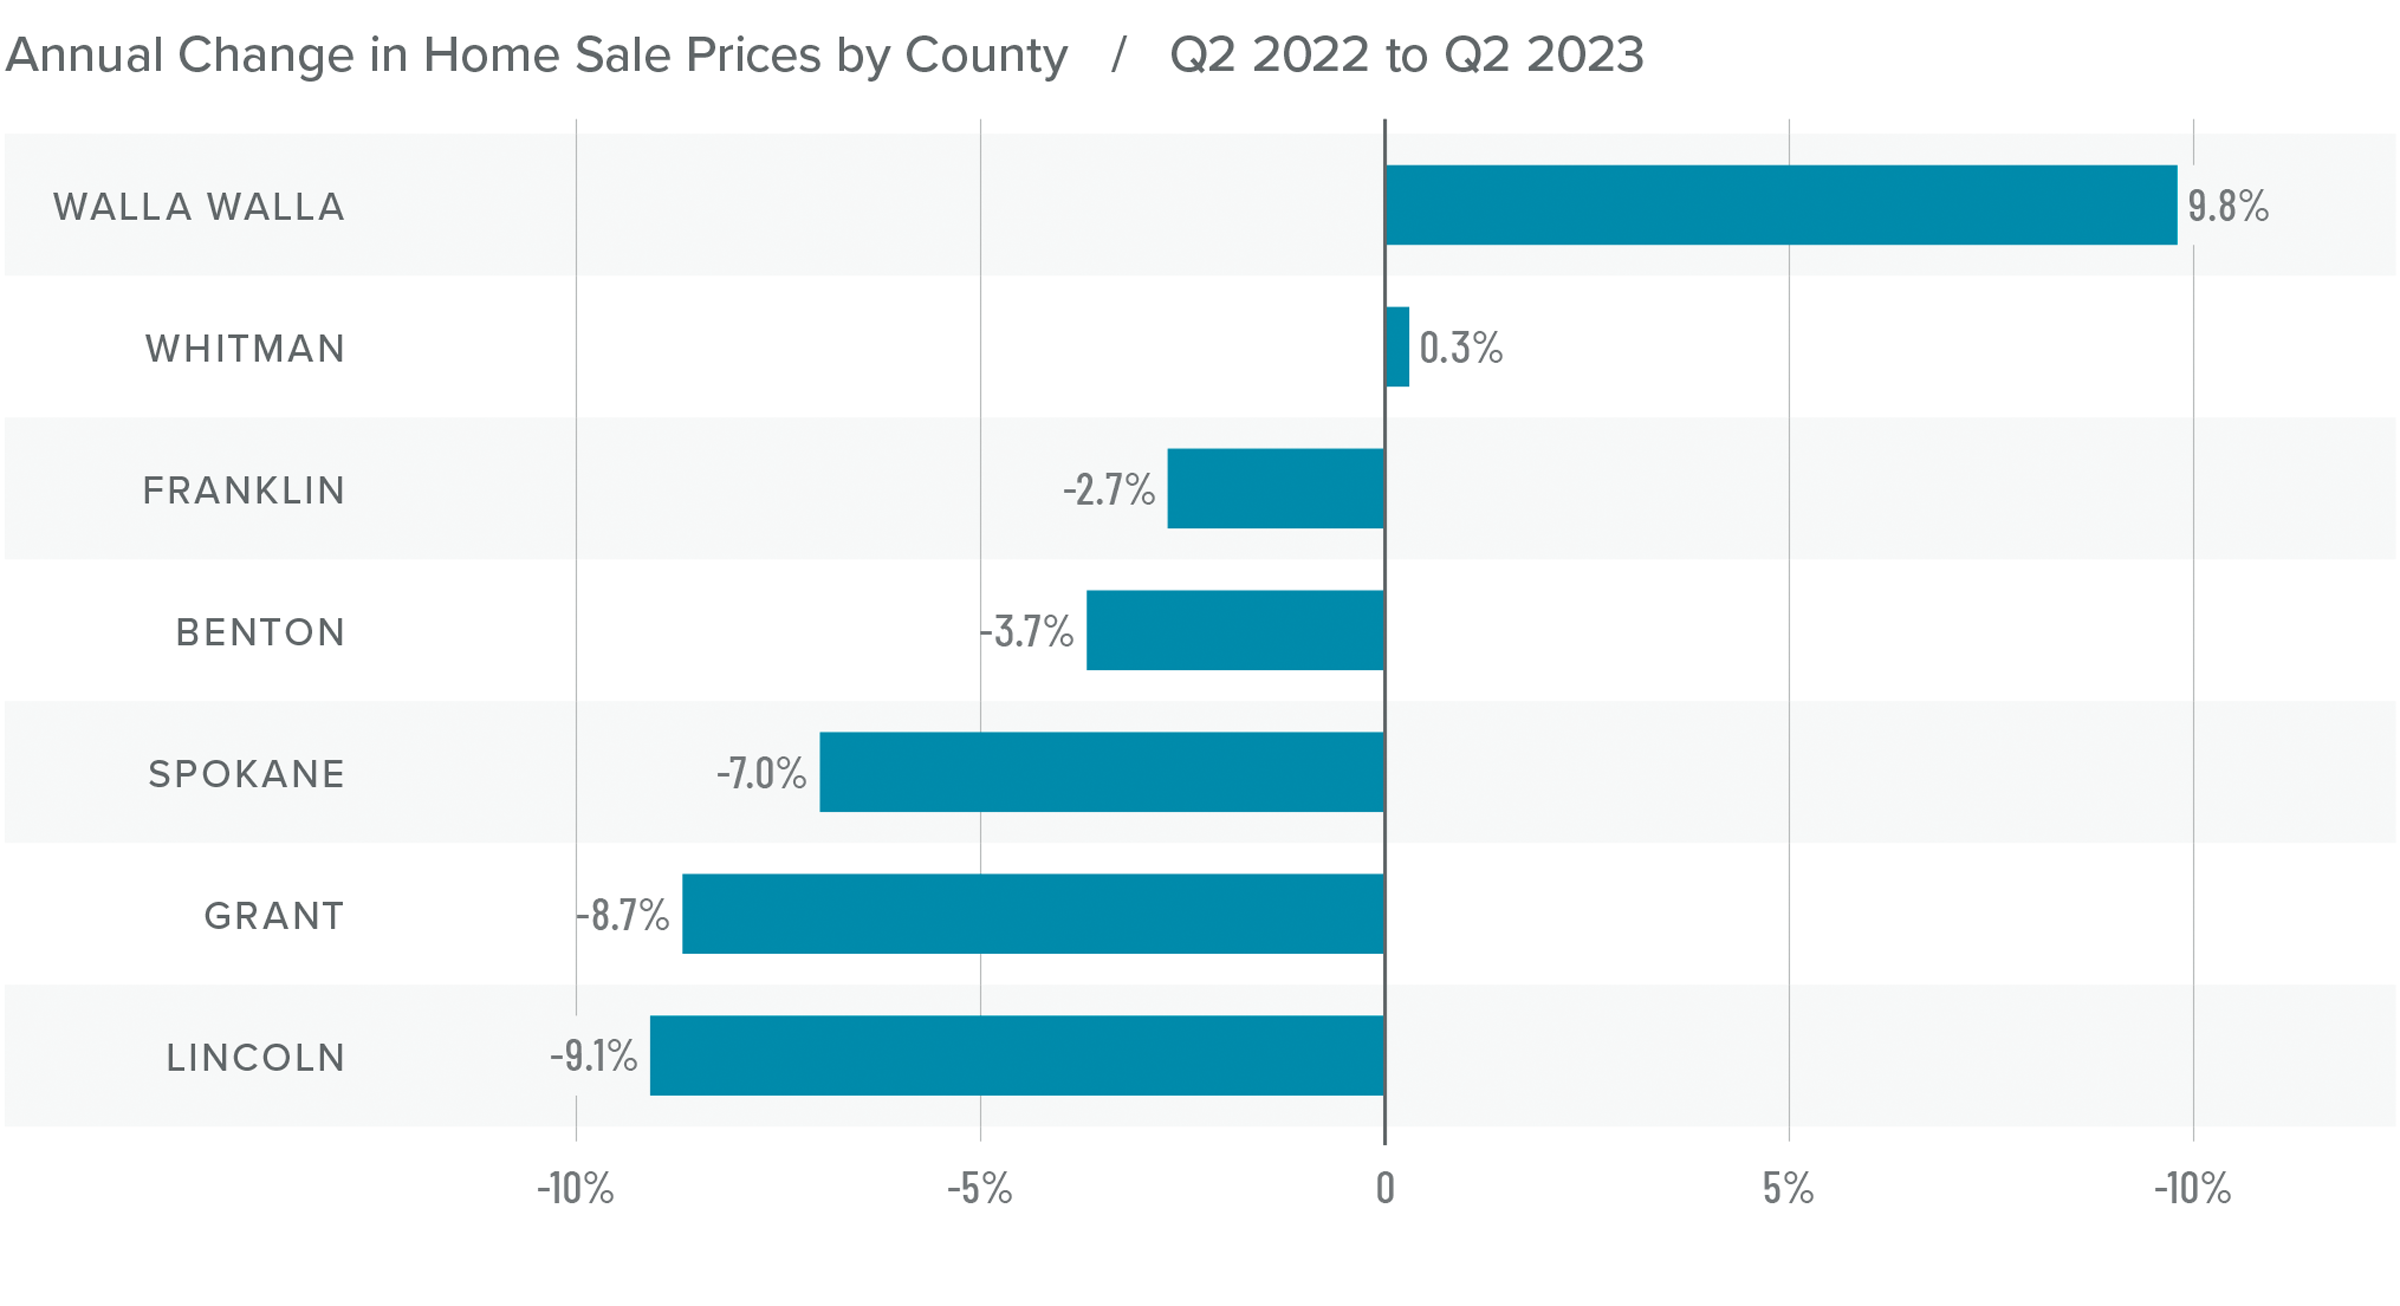
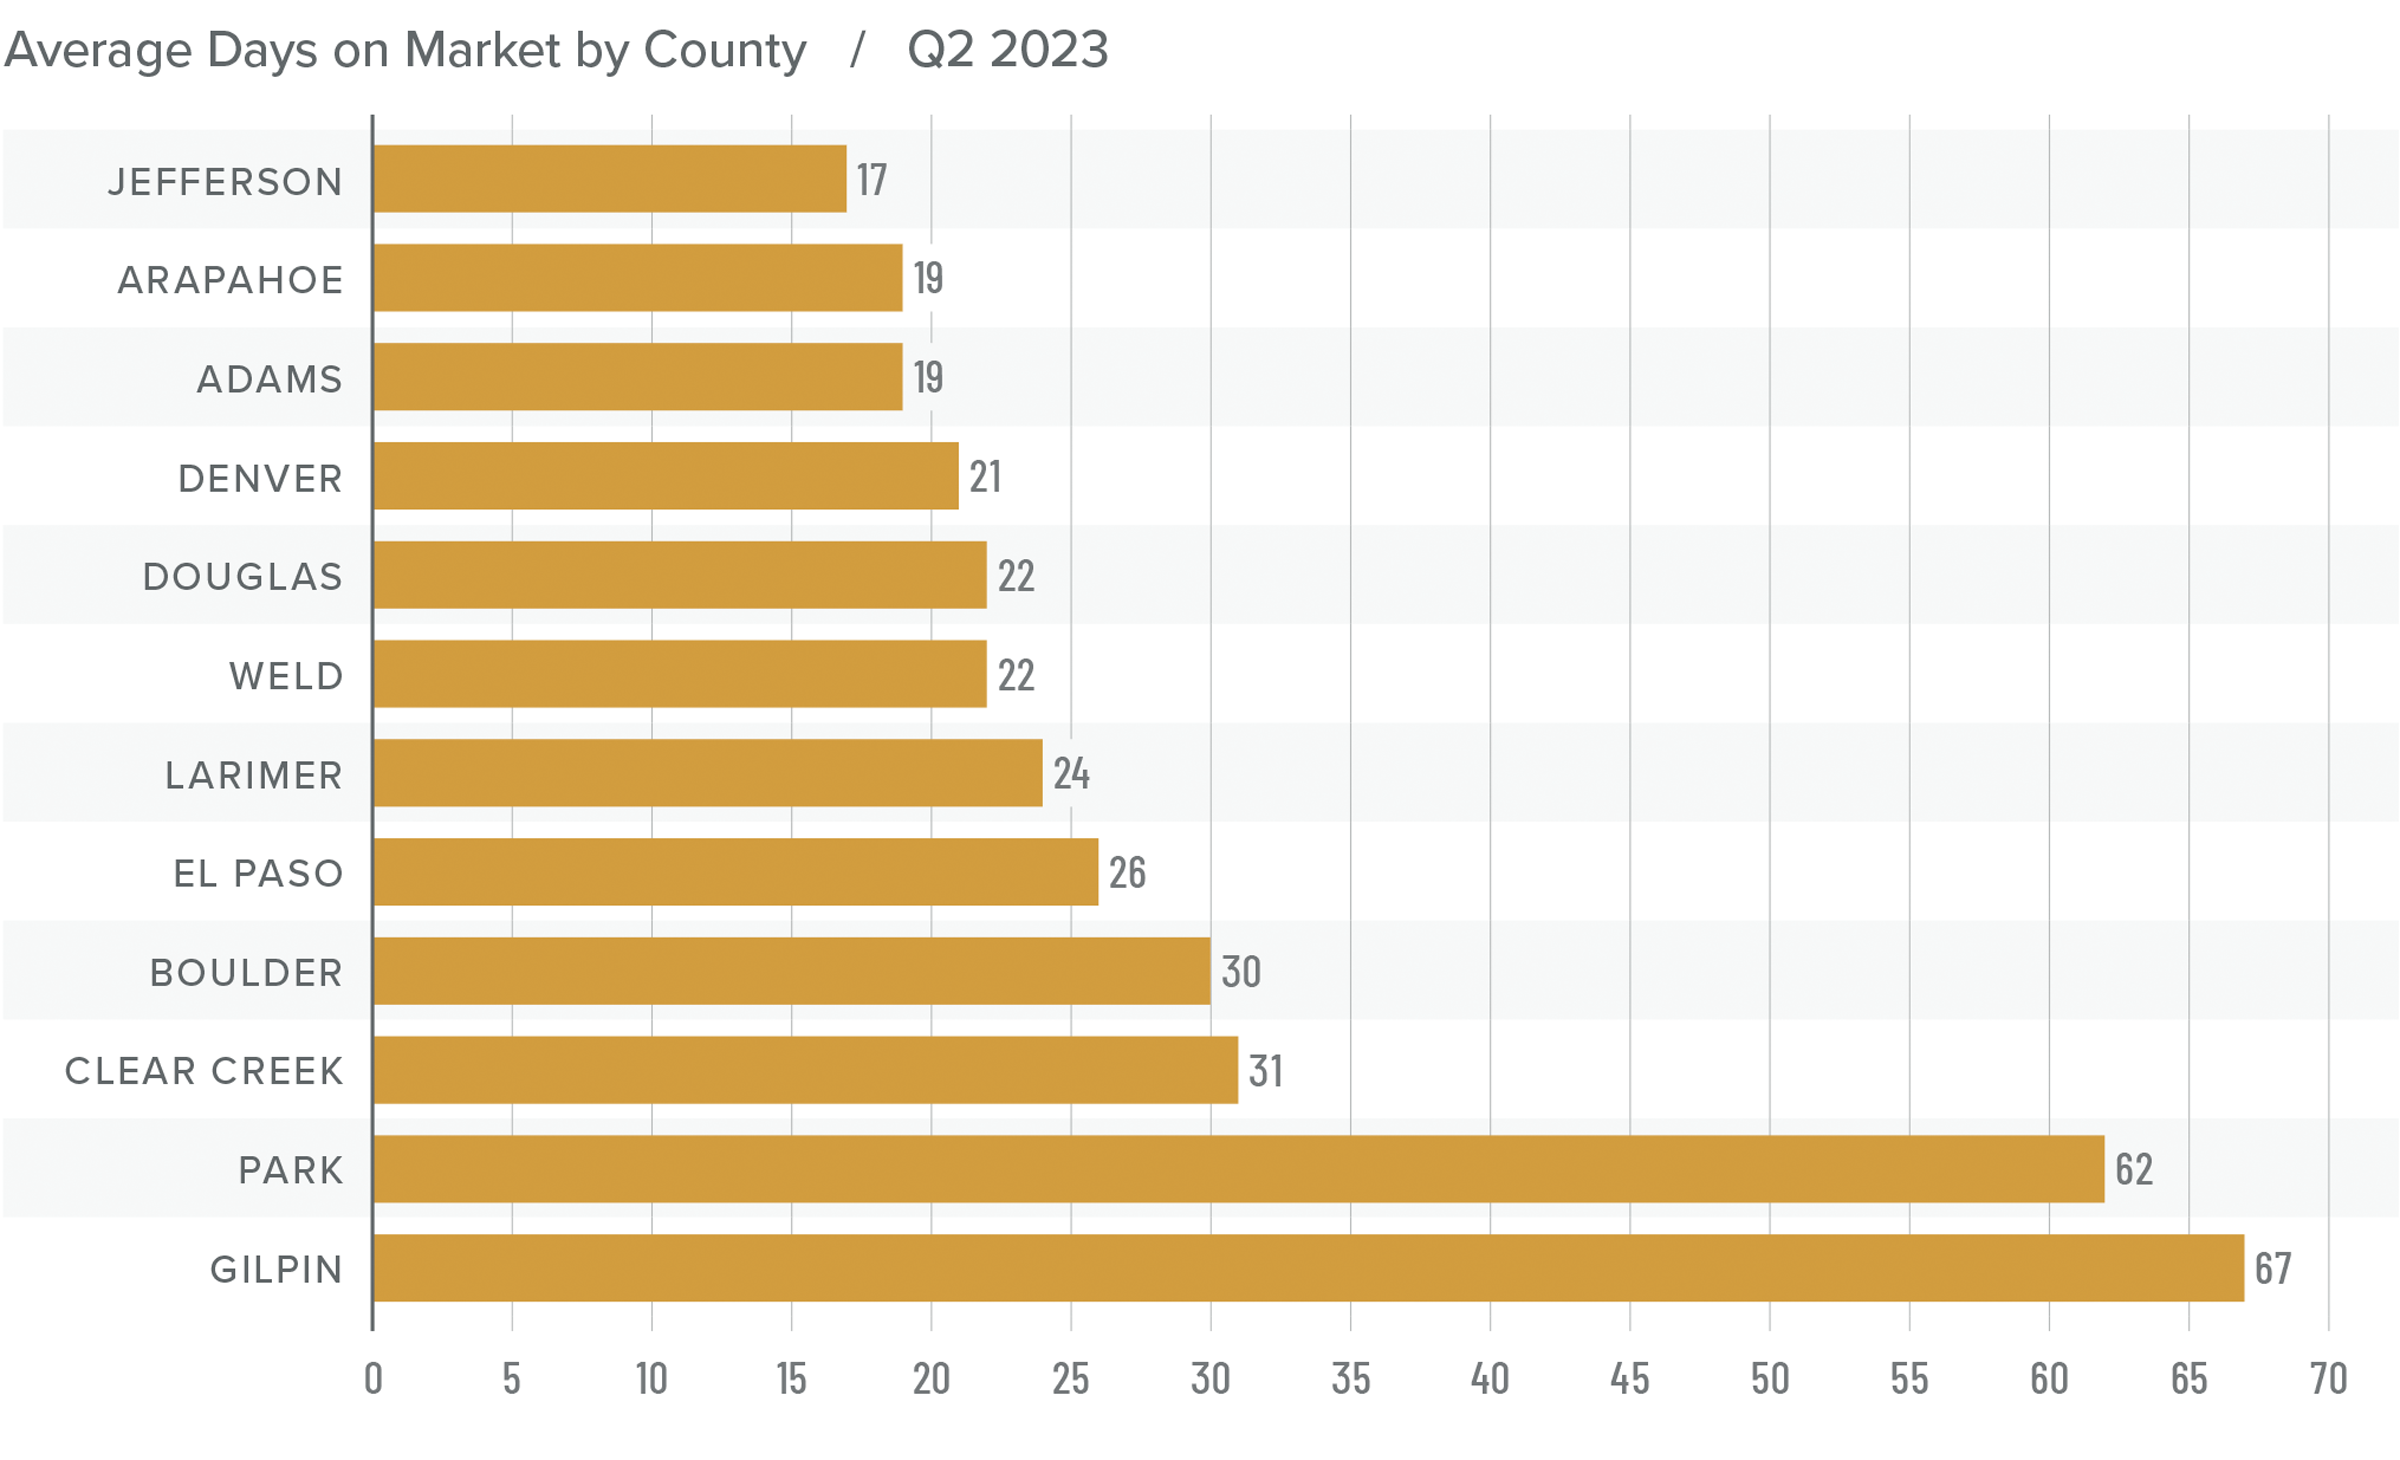
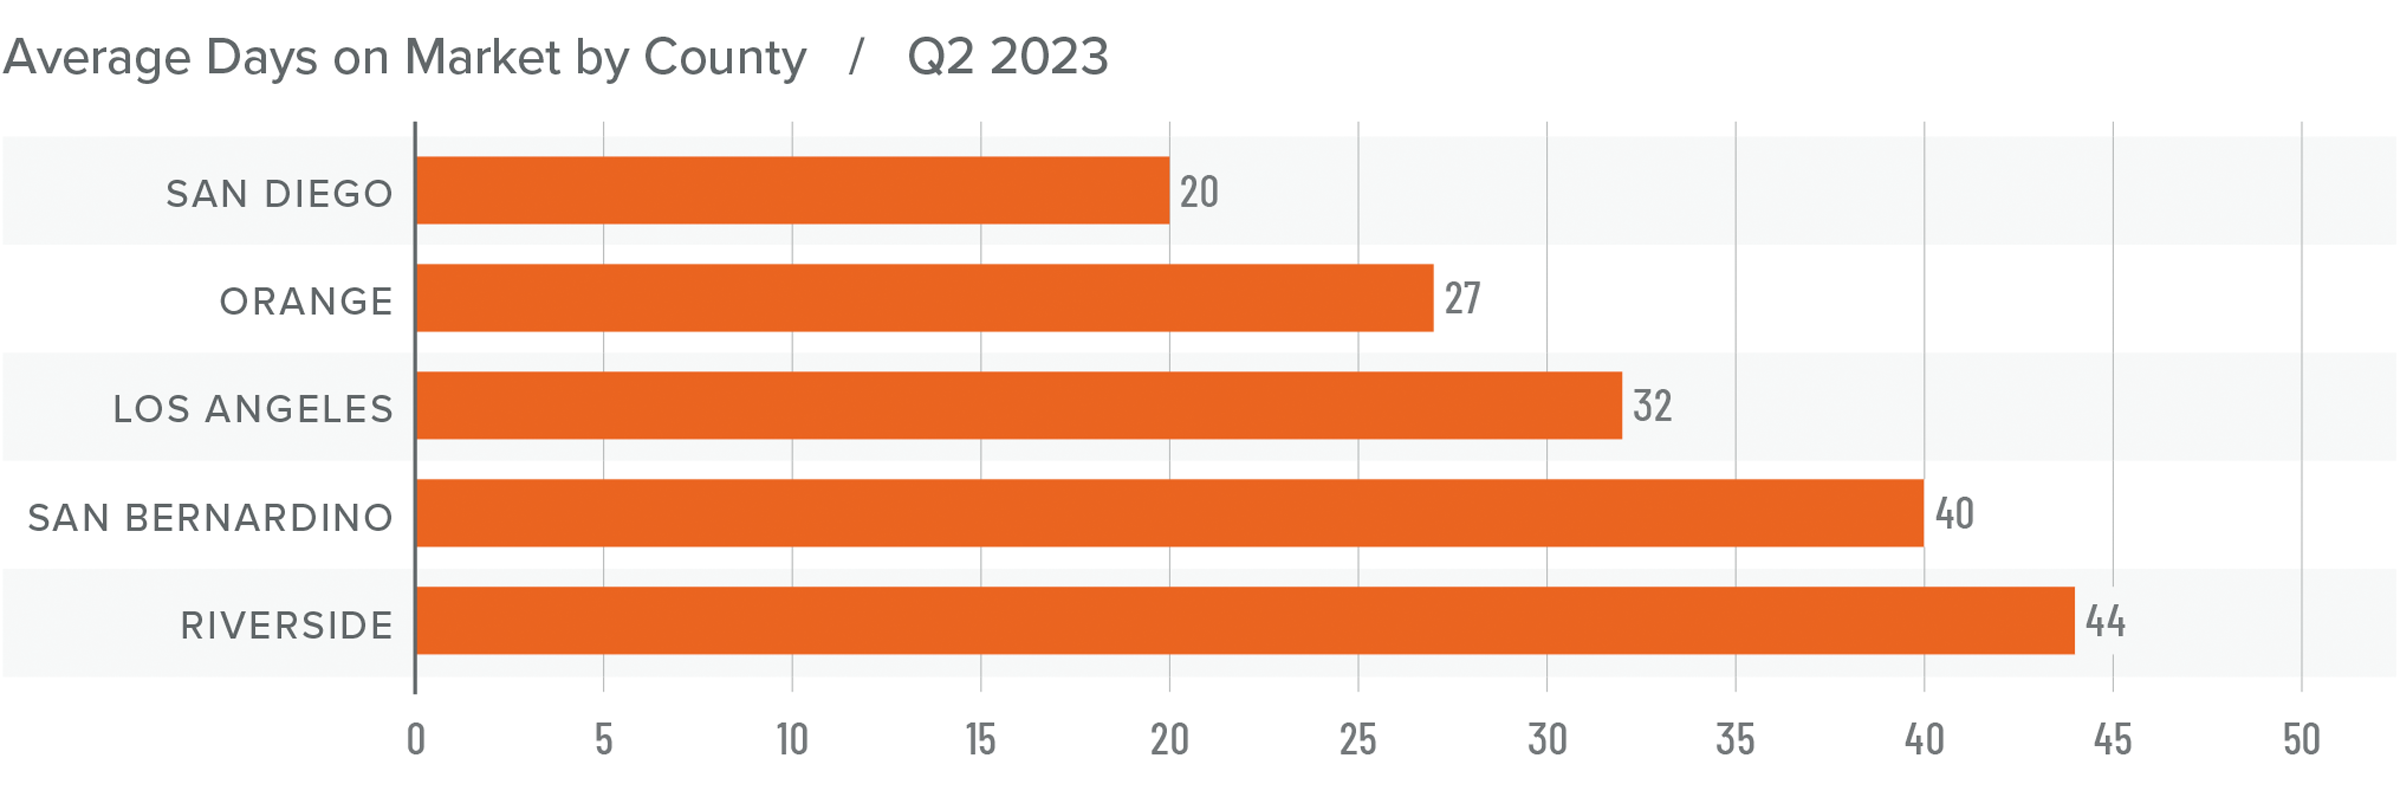
Nevada Days on Market
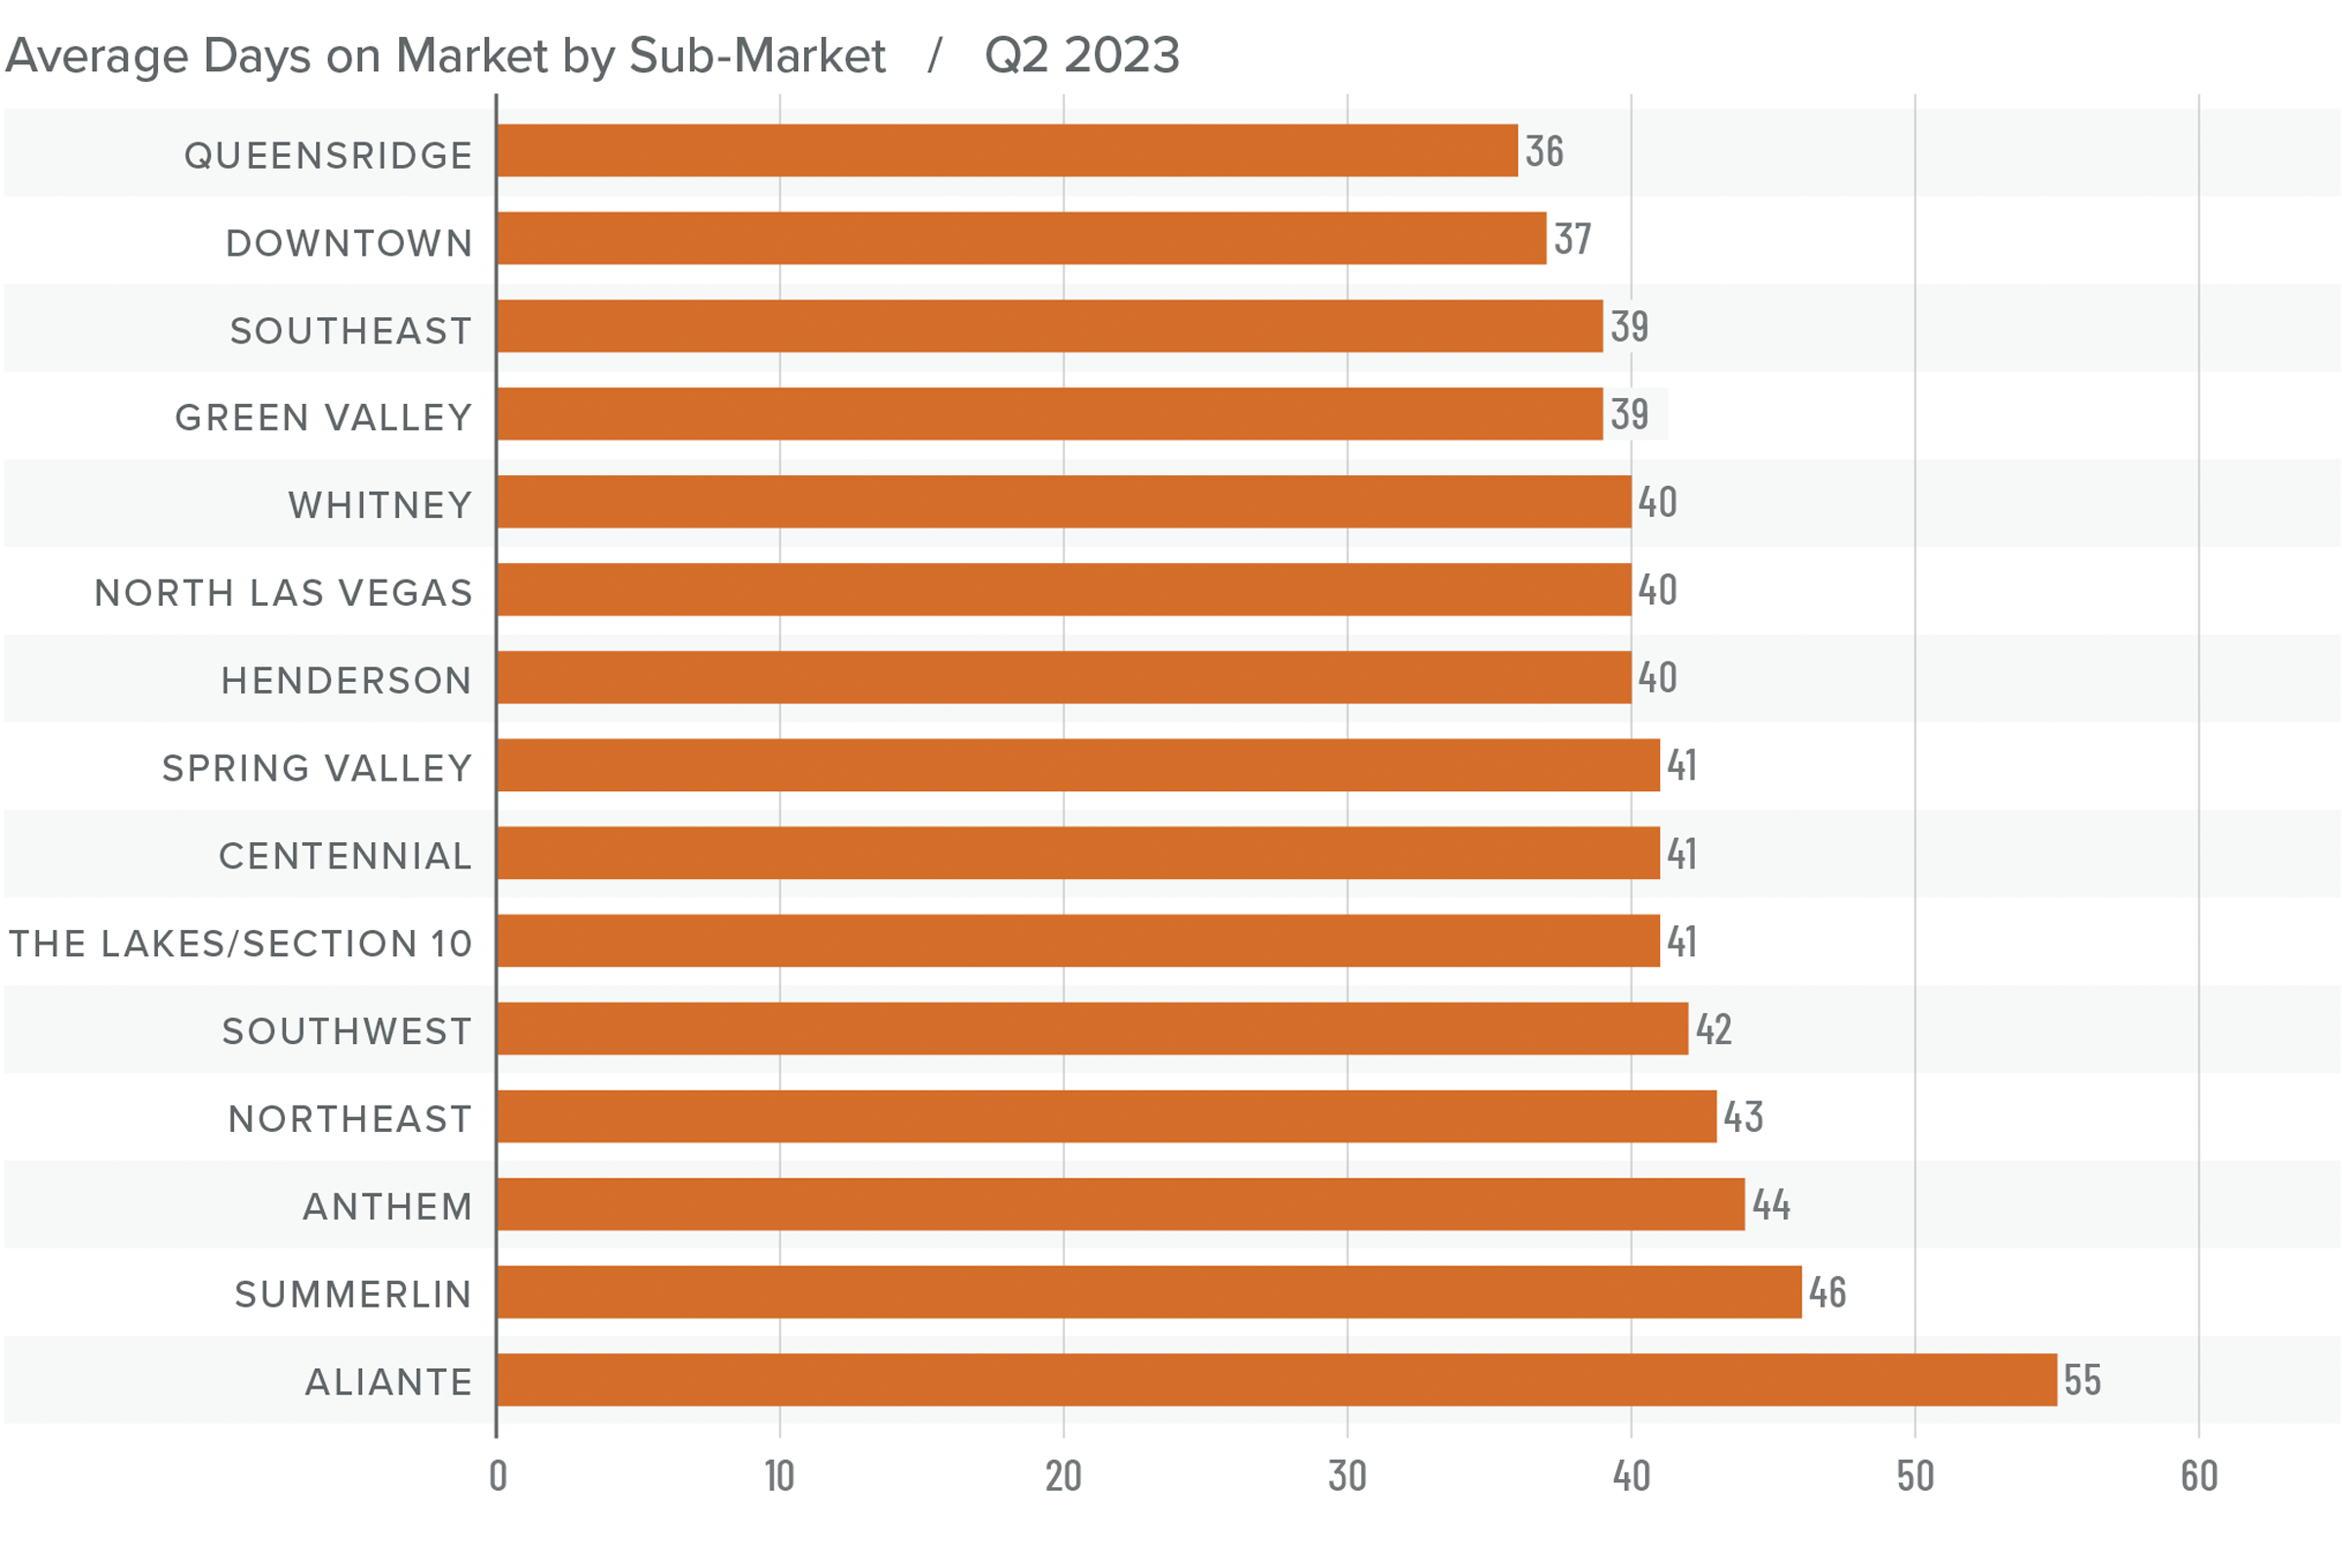
❱ The average time it took to sell a home in the region rose 26 days compared to the second quarter of 2022.
❱ It took an average of 42 days to sell a home in the second quarter, which was 13 fewer days than it took in the first quarter of 2023.
❱ Days on market rose in all neighborhoods compared to the same period in 2022. However, average market time fell in every neighborhood compared to the first quarter of this year.
❱ Tighter inventory levels are offsetting higher financing costs, which is lowering average market time.
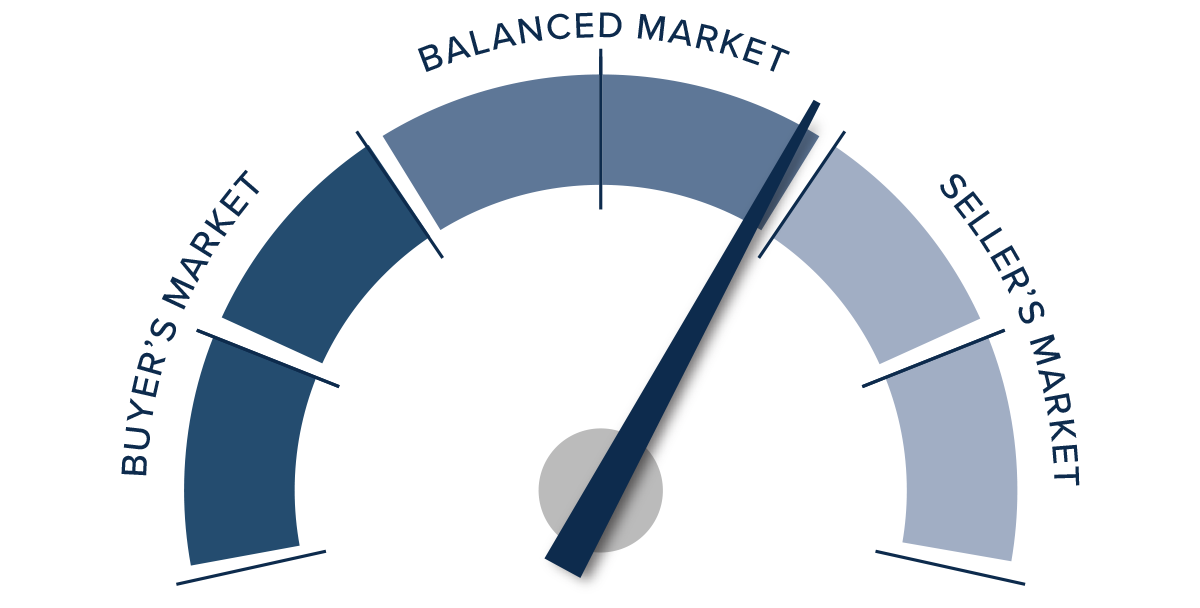
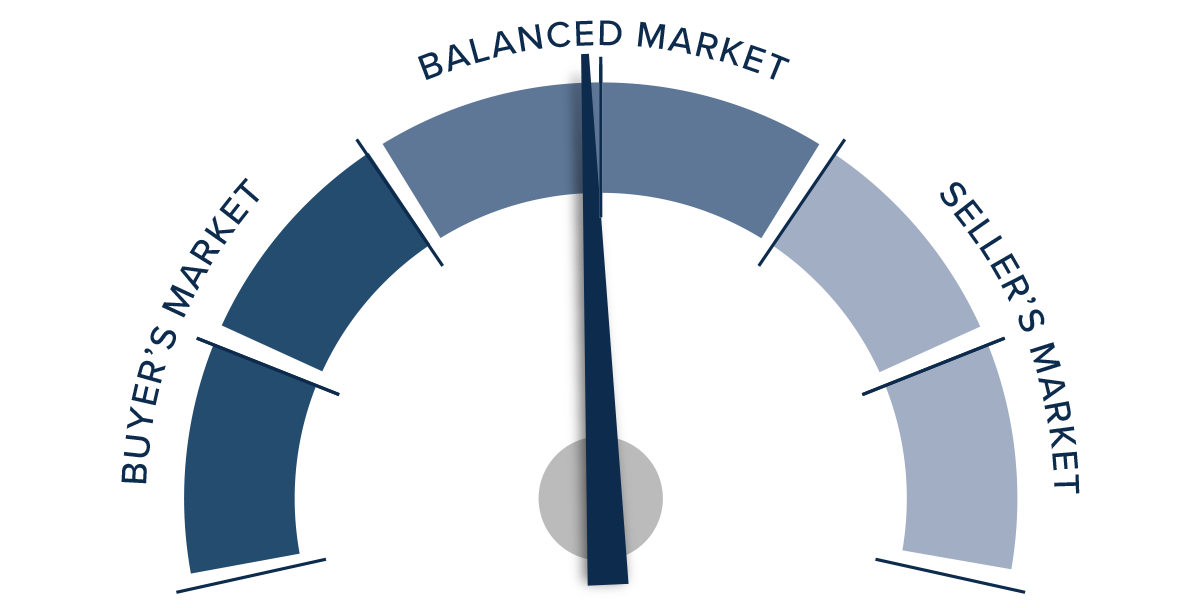
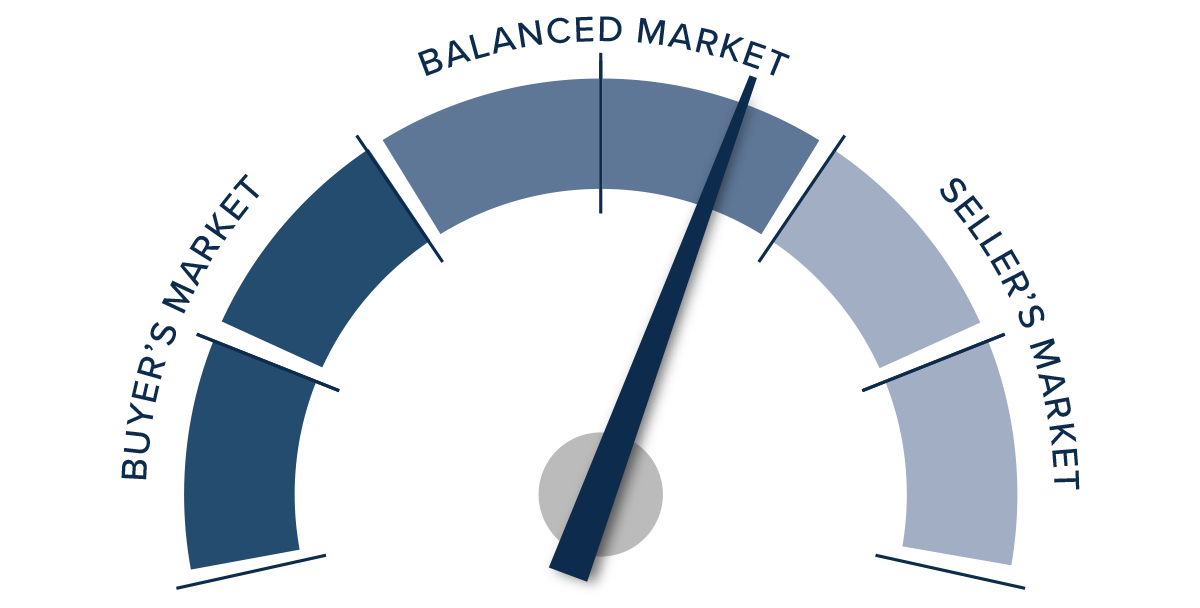
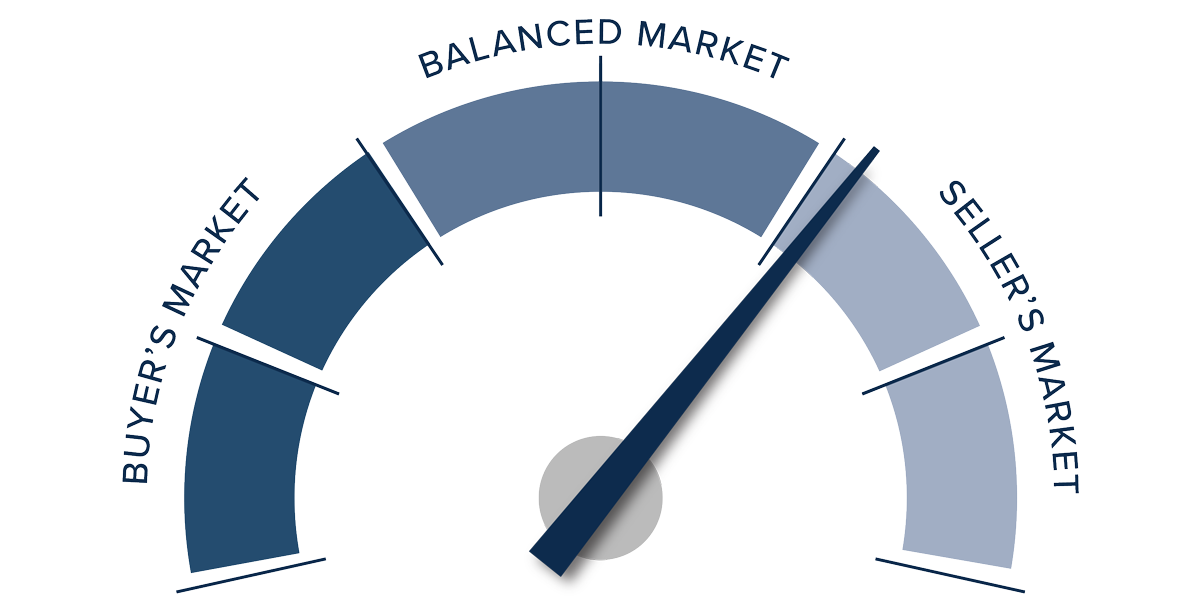
Conclusions
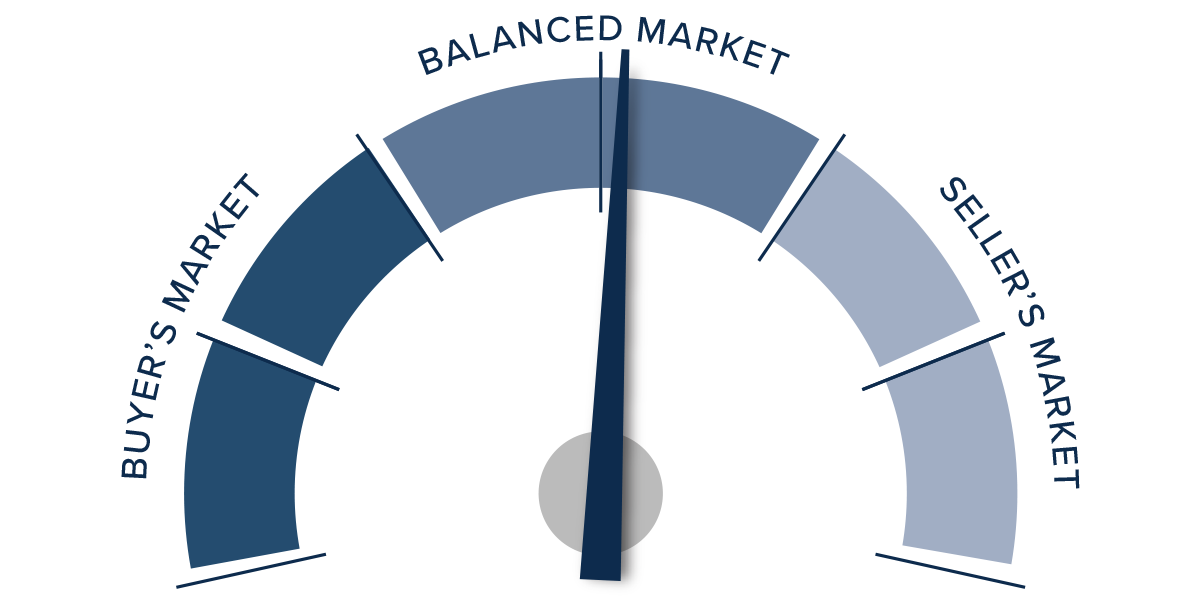
This speedometer reflects the state of the region’s real estate market using housing inventory, price gains, home sales, interest rates, and larger economic factors.
Just when you think you can write off Las Vegas, it comes back to prove you wrong. The area’s housing market is resilient and is likely to continue being that way. Every index other than mortgage rates is favoring sellers right now. Inventory levels are down. Pending and closed sales are up, as are list and sale prices.

While the market currently favors home sellers, they are not in a completely dominant position. That said, given everything I’ve shared in this report, I have pushed the needle more in their favor.
About Matthew Gardner

As Chief Economist for Windermere Real Estate, Matthew Gardner is responsible for analyzing and interpreting economic data and its impact on the real estate market on both a local and national level. Matthew has over 30 years of professional experience both in the U.S. and U.K.
In addition to his day-to-day responsibilities, Matthew sits on the Washington State Governors Council of Economic Advisors; chairs the Board of Trustees at the Washington Center for Real Estate Research at the University of Washington; and is an Advisory Board Member at the Runstad Center for Real Estate Studies at the University of Washington where he also lectures in real estate economics.


")


