You know your home is a valuable asset, but what is it actually worth? One of the most important figures to understand as you get ready to sell your home is Fair Market Value (FMV); it is key to a successful home sale. We’ll break down what Fair Market Value is and why it plays such a crucial role in the home selling process.
What Is Fair Market Value?
Fair Market Value (FMV) is the estimated price a property would sell for between a willing buyer and a willing seller, given that each party knows all the relevant information associated with the property. In other words, it’s the price your home is likely to sell for under the current conditions of your local real estate market.
So, what’s the point of this detailed analysis? Pricing your home accurately is paramount. If it’s overpriced, you may deter potential buyers and it will lose value over time as it continues to sit on the market. If it’s priced too low, you might leave money on the table. FMV helps you strike the right balance.
You can also use Automated Valuation Models (AVMs) to see what your home could be worth. (That was the last acronym in this post, we promise!) These calculators give you a general idea of your home’s value, but AVMs are not 100% accurate. They’re a great starting point, but again, your agent’s resources will ultimately determine the right price for your home.
To get an estimate of how much your home is worth, try our Home Worth Calculator here:
Fair Market Value sets the stage for smooth negotiations later in the home selling process. With a solid price in place, you’ll get reasonable offers from buyers. You and your agent will discuss whether to accept or counter the buyer’s offer and how to handle their contingencies. Finally, FMV makes the home appraisal process easier. With an accurate valuation in place, you can proceed knowing that the chances of a mismatching appraisal are low.
Several factors influence the Fair Market Value of a property. Comparable sales or “comps” play a significant role in determining FMV. Real estate professionals analyze recently sold homes in your area that are similar to yours, providing a benchmark for pricing your property. The property’s condition, its size, and location all factor into the math as well. Appraisers may also use a cost-based approach to determine FMV if they can’t find sufficient comparable homes in your area.
You can get a ballpark estimate of your home’s value by looking at tools online but determining a precise value will require the expertise of your real estate agent. To see what your home is worth, or for answers to all your home selling questions, connect with an experienced local Windermere agent today:
Some home designs reach way back through history. Greek Revival architecture is inspired by the principles of design formed in ancient Greece. These stately homes evoke a formal and traditional atmosphere akin to the feeling you get standing in the presence of the Parthenon. Let’s explore the history and features of these unique homes to understand what makes them so special.
5 Features of Greek Revival Architecture
1. Grand Entryways with Columns: The columns found in Greek Revival architecture are the defining characteristic of the style. Without these towering features, these homes simply wouldn’t feel the same. When used in a residential setting, columns help to create a feeling of grand stature by combining stories and stretching the verticality of the house. Columns were commonly found in important buildings constructed in ancient Greece, and today, they give Greek Revival architecture its timeless appeal.
2. Large Front Porches: In a residential setting, ample porch space creates a natural connection between the home and the outdoors. For all their grandeur, the way these homes are designed, there’s still a connection between them and their surrounding environment. As Greek Revival spread throughout the United States in the late 18th and early 19th centuries, different variations of the style were adopted to fit needs of the homeowners in different regions. However, porch space remained a universal feature of homes created in this style.
3. Decorative Windows: If the columns don’t give it away, the decorative dormer windows found in Greek Revival homes are a telltale sign of the style. These important features maximize natural light, which is perfectly displayed in the open layouts commonly found in these homes. The windows stretch vertically to complement the columns and give a very structured look to the exterior.
4. Ornate Details: Looking back at the most inspirational and renowned design works of ancient Greece, it’s no wonder that the opulent detailing of these magical buildings continued to be an important feature during the revival period. Intricate molding, ornate carvings, towering columns, and luxurious tile designs all reinforce the beauty of these homes. Marble was commonly used throughout these homes originally, inspired by the ancient Greeks’ preference for the rock in their building construction.
5. Greek Revival Architecture Color Scheme: The dominant color in the Greek Revival palette is white. Yes, white marble was prevalent throughout temples in ancient Greece, but the preference for white amongst the designers behind the revival movement had just as much sway in how we see this style represented today. Many Greek Revival homes found today are constructed with wood or stucco and painted white. In terms of interior design, this typically whitewashed palette gives you a clean slate to decorate on top of. Primary colors and natural, organic hues pair well with these classic buildings.
Written by: Samantha Enos – Vice President of Diversity, Equity, and Inclusion, Windermere Real Estate
Formed in partnership with the University of Washington College of Built Environments, Windermere’s Aspire internship program launched in July 2021. The internship offers financial support, mentoring, and skill-building through academic and professional office settings to students, with a focus on those from historically underrepresented or marginalized groups.
After a successful first iteration of the Aspire internship in 2021 that saw all eight University of Washington students complete the program, Aspire 2022 had more than double the number of participants. This year, the Aspire program hosted 10 students over eight weeks. The interns met with seven Windermere offices from around the greater Seattle area and three of the company’s ancillary partners (CW Title, Penrith Home Loans, and HomeSight). This year’s curriculum covered the following topics:
Raising visibility of subsidized programs for home ownership
Affordable housing design
Financial literacy for young adults and the role of building wealth through homeownership
Accessory dwelling units (ADUs) and the role for real estate agents as trusted partners
Throughout the course of the internship, the students impressively identified gaps within the housing industry and offered solutions to create meaningful change. With educational backgrounds ranging from architecture and communications to real estate and beyond, this year’s aspire students brought their unique perspectives together to propose practical solutions to some of the most pressing issues in the housing industry. To complete the program, students created presentations on diverse subjects such as access to fair housing, possible solutions to affordable housing issues, and methods of increasing financial literacy among youth. In return, they received invaluable insights into the residential real estate industry and a $3,000 scholarship to go toward their tuition at the University of Washington.
We would like to thank the Windermere owners and leadership team members who helped make this year’s Aspire internship possible. We can’t wait to work with a new group of students next year.
To learn about our DEI initiatives like the Aspire internship program, visit windermere.com/dei.
Samantha Enos currently serves on the Seattle-King County REALTORS® Board of Directors, is a member of the National Association of REALTORS® Mentorship program and is the Chairperson of the Seattle-King County REALTORS® DEI committee. She also volunteers on the Juanita High School DEI committee.
Featured Image Source: Windermere Real Estate
The leaves changing color is a sign that you may have some fall home maintenance tasks to tackle. With summer in the rearview and colder temperatures ahead, being proactive now will keep your home in pristine condition throughout the autumn days and nights. We’ve compiled a list of several tasks to tackle around your home this fall.
Fall Home Maintenance Checklist
Clean Gutters
Water damage can spell serious trouble for homeowners. And with many climates experiencing additional rainfall this time of year, it’s time to prepare accordingly.
Start by ensuring that gutters and downspouts are functioning properly. (Don’t attempt this task yourself if you have a multi-story house with a steep roof; hire a professional instead.)
If your home is surrounded by trees, you may need to clean out your gutters a few times a year, especially in the fall. Check to make sure your gutters are flush with the roof and attached securely, repairing any areas that sag or sections where the water can easily collect and overflow.
Clean out the gutters and downspouts, checking that outlet strainers are in good shape, and are firmly in place. Finally, check that your downspouts direct water away from your house, not straight along the foundation.
If you haven’t already, you may want to consider installing gutter guards. Gutter guards create a barrier so water can get through to your gutters, but debris can’t, limiting gutter buildup (and the time you spend cleaning out your gutters). There are DIY installation kits available, or you can always hire a professional to install a gutter guard system.
If you have a sump pump under your house, now is a good time to test it. Run a hose to make sure draining water travels directly to the pump and that the pump removes the water efficiently and expels it well away from the foundation. For more information about how sump pumps work, go to howstuffworks.com.
Check for Leaks
The best opportunity to catch leaks is the first heavy rain after a long dry spell, when roofing materials are contracted. Check the underside of the roof, looking for signs of moisture on joints or insulation. Mark any leaks that you find and then hire a roofing specialist to repair them. Waiting for leaks to show up on your ceiling is a recipe for disaster. By then, it’s too late to act; insulation and sheet rock will have already sustained damaged, and you could have a mold problem on your hands.
Don’t forget the basement. Check your foundation for cracks, erosion, plants growing inside, broken windows, and gaps in the window and door weatherstripping. Make sure to properly seal any leaks while the weather is nice. This will ensure materials dry properly.
Fall Home Maintenance: Pest Prevention
Rodents are determined and opportunistic, and they can do tremendous amounts of property damage (and endanger your family’s health). As temperatures cool, take measures to prevent roof rats and other critters from moving in. Branches that touch your house and overhang your roof are convenient on-ramps for invaders, so trim back branches so they’re at least four feet from the house. If you do hear scuttling overhead or discover rodent droppings in your attic, crawl space or basement, take immediate action.
Preventative maintenance is especially crucial for your home’s heating and air-conditioning systems. Fall is a smart time to have your systems checked and tuned up if necessary. Don’t wait for extreme temperatures to arrive when service companies are slammed with emergency calls. Between tune-ups, keep your system performing optimally by cleaning and/or replacing air filters as needed.
If you have a wood-burning fireplace, a professional inspection and cleaning will help prevent potentially lethal chimney fires and carbon monoxide poisoning. Even if you don’t use your fireplace often, always keep a supply of dry firewood or sawdust-composite logs so you have a backup heat source in an emergency.
Insulating your home is a cost-efficient investment, whether you’re trying to keep the interior warm in the winter or cool in the summer. Aside from more major improvements like energy-efficient windows and insulation, there are some quick fixes and projects that you can tackle DIY.
If an exterior door doesn’t have a snug seal when closed, replace the weather stripping; self-adhesive foam stripping is much simpler to install than traditional vinyl stripping. If there is a gap under the door (which can happen over time as a house settles), you may need to realign it and replace the vinyl door bottom and/or door sweep. Air also sneaks inside through electrical outlets and light switches on exterior walls. Dye-cut foam outlet seals placed behind the wall plates are a quick and inexpensive solution.
For more tips on seasonal home maintenance, home repair tips and more, visit the Living category of our blog:
Windermere Chief Economist Matthew Gardner demonstrates how the U.S. housing market is adapting to low inventory levels. He touches on the new construction industry, supply changes in large metro areas, median home sale prices, and more.
This video is the latest in our Monday with Matthew series with Windermere Chief Economist Matthew Gardner. Each month, he analyzes the most up-to-date U.S. housing data to keep you well-informed about what’s going on in the real estate market.
Low Inventory Housing Market
Hello there, I’m Windermere Real Estate’s Chief Economist Matthew Gardner and welcome to this month’s episode of Monday with Matthew. As we are all aware, the housing market has softened considerably with the number of existing homes available to buy close to record lows. Today we are going to talk about supply, and how the market is starting to adapt to low inventory levels.
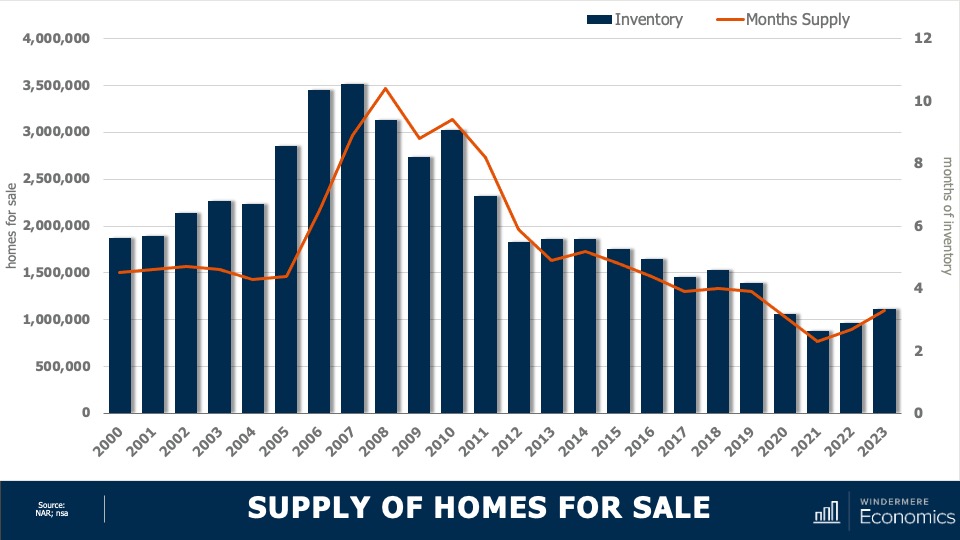
Housing Market Inventory
This chart shows the average number of homes on the market by year. Although year to date we have seen a little bit of an uptick, it’s clear the country remains supply-starved. And with just over three months of inventory—as opposed to the normal four to six—the market is clearly out of balance. But even though inventory levels have risen nationally, as I’ve said many times before, not all markets are equal.
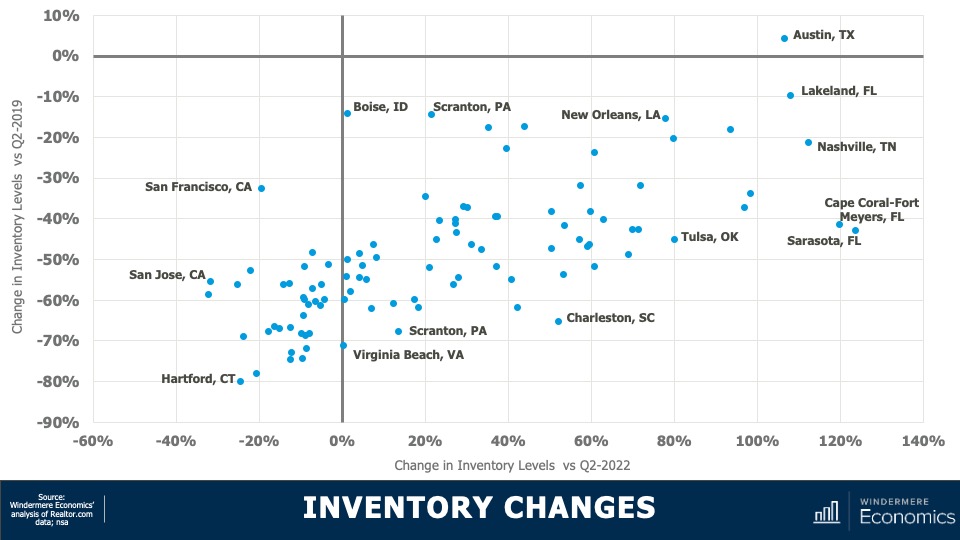
Housing Inventory Changes in Metro Areas
This chart shows how supply levels have changed. The data here is representative of the 100 largest metropolitan areas in the country. The horizontal axis shows the change in inventory versus the second quarter of 2022, while the vertical axis shows the difference and the number of homes for sale versus the second quarter of 2019. I think you’ll agree that the difference is stark. Although two-thirds of the metropolitan areas have seen the number of homes for sale improved versus the same period a year ago, just one (Austin, TX) had more homes for sale higher in the second quarter of this year than it had in the second quarter of 2019.
And even more stark was the fact that inventory levels in 53 of the 100 largest metropolitan areas were down by more than 50% compared to the same period three years ago.
Interestingly, on a percentage basis, smaller metro areas saw the greatest decline compared to three years ago. For example, in Hartford, CT, the average number of homes on the market in the second quarter was just over 900, down by 80% from the second quarter of 2019 where there was an average of over 4,400 units for sale. Supply levels were down by 78% in Stamford, CT; 75% in New Haven, CT; and 74% in Allentown, PA.
It is true that supply levels are generally higher when compared to a year ago, with the greatest increase being seen in select markets in Florida, Tennessee, Texas, and Oklahoma; however, other than in Austin, supply levels remain well below their long-term averages. So, how is the market adapting? The answer is rather interesting. Even with all the talk of escalating material, land, and labor costs, it’s the new home industry that has been taking advantage of the lack of housing supply.
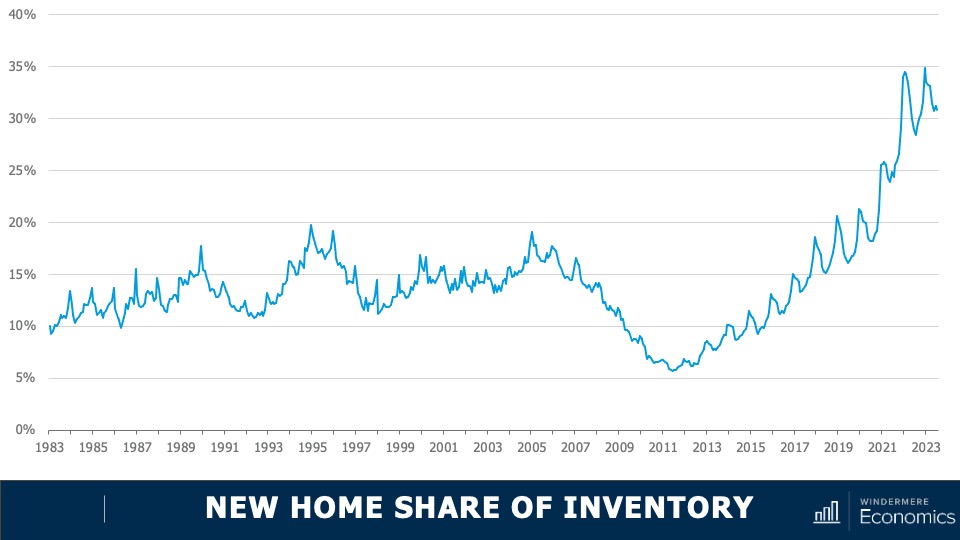
New Construction Market Trends
This chart shows the share of new homes on the market compared to their resale counterparts—here we are just looking at single-family homes. Historically, new construction makes up roughly 10% of active listings at any one time, but as you can see here, that share has been rising not just since the end of the pandemic but for the past several years. Although off the high seen a few months ago, 30% of the single-family homes for sale this July were brand new. I find this particularly interesting because, historically speaking, a premium was paid in order to buy a new home rather than an existing one.
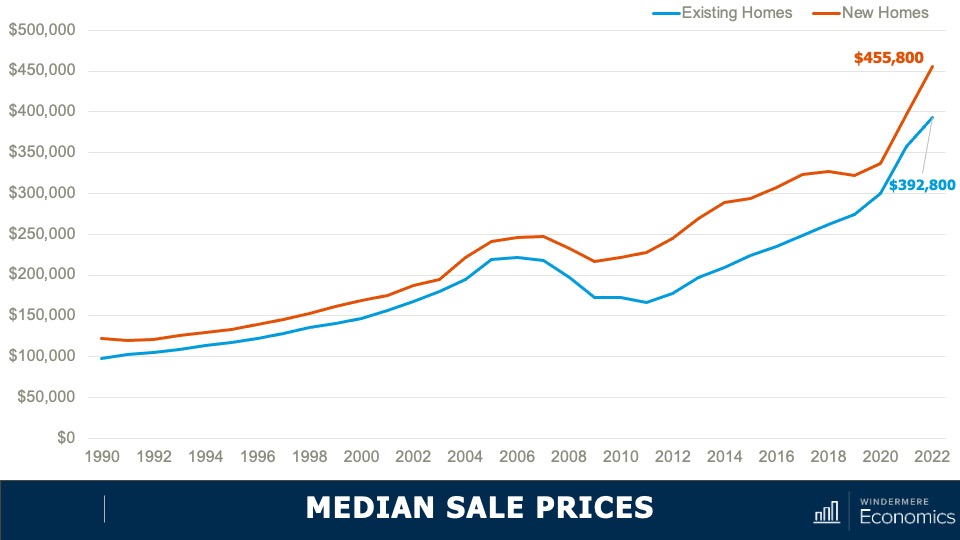
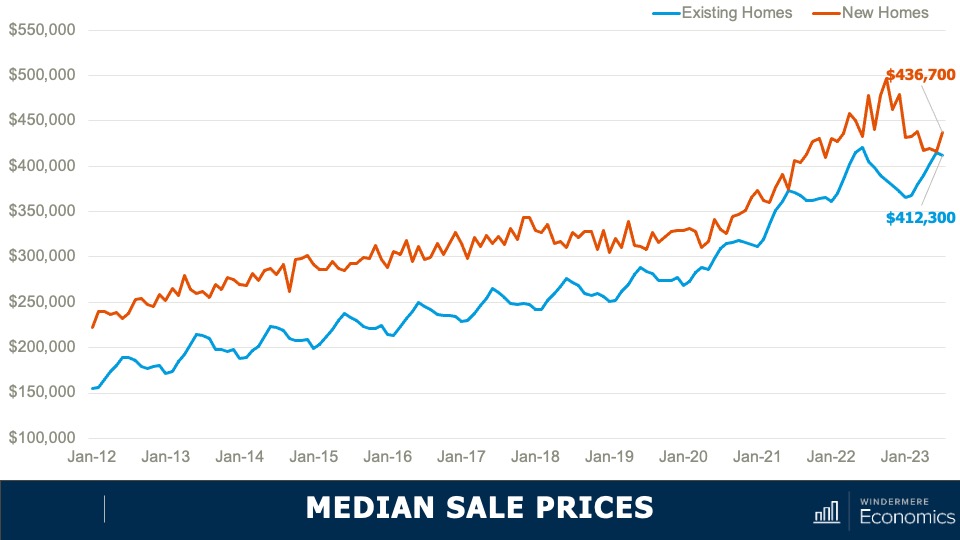
Median Sale Prices: New and Existing Homes
As you can see here, the spread in median sale prices, which was pretty stable from 1990 until the bursting of the housing bubble, grew significantly starting in 2011 and in 2022. The premium averaged 16%. But when we look a bit closer at the numbers, they gives us a somewhat different picture.
You can see here the spread has dropped to just 6%. And in June of this year, the difference was a mere $1,000.
With the share of new homes for sale holding at a four-decade high, the share of sales themselves is at a level we haven’t seen since 2005. But even though we know that there is demand for housing, shouldn’t sales be constrained by mortgage rates? Well, what is happening is that builders are attracting buyers through incentives, and here we’re talking about mortgage rate buydowns which are becoming increasingly prevalent across the country.
In fact, a recent survey from John Burns Consulting suggested that 30% of home builders reported using interest buydowns more in the second quarter of this year than they had previously. And this is attracting buyers to visit new development communities.
An example of these buydowns is the 2/1 program that DR Horton—the largest home builder in the country—is offering at some communities. This program gives buyers a mortgage rate that starts at 3% for the first year, rises to 4% in year two, and then goes to 5% for the balance of the 30-year term. That’s pretty compelling, given where mortgage rates are today.
The bottom line is that as far as I can see, the new home industry will continue to take an outsized share of the market for the balance of 2023 and likely through most of 2024. That said, once the market starts to normalize, I expect them to pull back from these incentive programs, making them more likely to start raising asking prices, and we will return to the traditional spread between the prices of new and resale homes.
Although it’s pleasing to see more homes being built, I still believe that the country will still be running a housing deficit when it comes to meeting demographic demand and this will continue to hurt first-time buyers who continue to be priced out of the market.
As always, I’d love to hear your thoughts on this subject so feel free to leave your comments below. Until next month, stay safe out there and I’ll see you soon. Bye now.
To see the latest real estate market data for your area, visit our Market Update page.
About Matthew Gardner
As Chief Economist for Windermere Real Estate, Matthew Gardner is responsible for analyzing and interpreting economic data and its impact on the real estate market on both a local and national level. Matthew has over 30 years of professional experience both in the U.S. and U.K.
In addition to his day-to-day responsibilities, Matthew sits on the Washington State Governors Council of Economic Advisors; chairs the Board of Trustees at the Washington Center for Real Estate Research at the University of Washington; and is an Advisory Board Member at the Runstad Center for Real Estate Studies at the University of Washington where he also lectures in real estate economics.
There is perhaps no other home décor style as comforting as traditional interior design. Rooted in the masterfully crafted Chippendale and Thomas Sheraton furniture designs and classic Queen Anne colors, traditional décor is one vintage style that stood the test of time. Here are five distinct features of traditional interior design.
5 Features of Traditional Interior Design
1. Dark Wood Finishes
Part of the reason for traditional design’s timeless appeal is its use of woodworking. With woodwork as a foundation, this design style feels classic but not dated. The dark, bold colors resemble the Victorian style, but traditional interiors are simpler and less ornate. The dark tones of the wood create a foundation for a more colorful decorative palette.
Image Source: AI Generated image in Traditional Interior Design Style – for inspirational use only
2. Traditional Design Color Palette
Traditional design can handle a heavier color palette while still providing comfort. The darker wood tones allow for darker color to be used elsewhere throughout a space, such as dark window coverings. Floral, plain colors, and muted plaids are all common color schemes. Walls are often covered with patterned wallpaper, floral designs, or damask. In terms of designs, traditional interiors pair well with geometrics and small, striking yet understated patterns.
3. Hardwood Flooring
This design style is classic from the floor to the ceiling. You won’t find laminate or tile flooring in the common areas of a home that adheres to the principles of traditional interior design. Complimenting the surrounding woodwork, homes designed in this style have solid hardwood flooring. How to Choose the Best Flooring
Image Source: AI Generated image in Traditional Interior Design Style – for inspirational use only
4. Traditional Decorations
The decorations used in traditional design help to reinforce its unique, classic-yet-comfortable ambiance. Table lamps and vases are typical of a traditional interior, often displayed in pairs to create symmetry. Though these accessories are bold, they are never too ornate or over-the-top enough to dominate the room.
5. Design Philosophy
Traditional design is calm and orderly. Whereas a more eclectic interior design style may offer more surprises throughout its spaces, a traditional interior is more predictable. Even the textiles used are subtle, with typical materials ranging from cotton and fur to velvet and silk.
For more inspiration and interior design tips, visit the Design category of our blog:
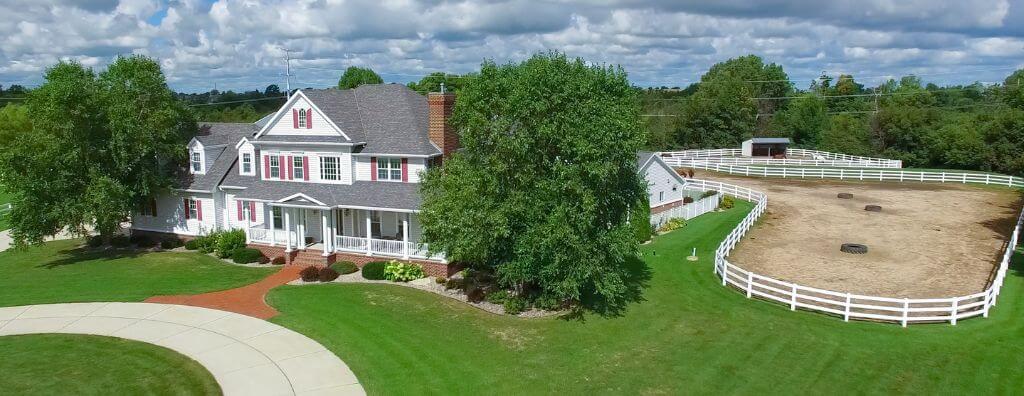
Equestrian properties are unique. If you’re thinking about buying equestrian property, you have to weigh different aspects of a listing than you would for a typical single-family home purchase. As you look at properties, you will face the dilemma of whether to prioritize the property’s land or the house itself. In the end, the right equestrian property depends on your specific needs. The following information will help you along that decision-making process to find the right home for you.
Buying an Equestrian Property
It’s vital that you work with an experienced equestrian real estate agent as you go about the process of searching for a home. Your agent will be able to pinpoint listings that match your criteria and reach out to the listing agent representing the seller. Learning more about how an equestrian property creates value for its owners will inform your discussions with your agent.
Equestrian Property: The House
A well-designed house will enhance your daily life and provide comfort for your household. Features like a spacious kitchen, an open living room area, outdoor living areas, and modern amenities can maximize your enjoyment of your time at home. Flexible interior spaces with the ability to be converted into a home gym or home office may be more valuable to you, depending on your lifestyle. If these characteristics are a top priority, communicate to your agent that these features are must-haves.
Equestrian Property: The Land
The equine lifestyle requires a property to have more than just ample backyard space. Whatever your goals as an equestrian homeowner, your horses’ experience will be dictated by the land. Consider the facilities you plan on setting up. The quality of the land and its suitability for the kinds of training you have in mind are very important, especially if your livelihood and your equestrian activities are intertwined. Different equestrian disciplines require different footing; consider each property’s ability to accommodate your specific discipline.
Equestrian operations often expand over time, so it pays to think about each property’s potential in terms of how it could grow in the future. The same can be said for customization: purchasing land with the potential to build custom equestrian facilities allows you to tailor the property to your goals and the needs of your horses.
House vs.Land
Finding the balance between the right house and the right land is a balancing act, but with the right communication between you and your agent, you’ll find it. Prioritize your needs and consider your budget throughout the process to continue to narrow down the list of fitting listings. As with any real estate purchase, location plays a significant role, but as an equestrian homeowner, you’ll be thinking about the future of your horses, your business, and your equine pursuits. If a property isn’t able to meet these standards, it may not be the right one for you.
For more information on finding the right property and for answers to all your home buying questions, connect with an experienced Equestrian Advisor:
Maintaining a tidy home not only helps it to look its best, but it also makes for a more peaceful and organized living environment. Regardless of the size of your home, these tips will help you achieve and maintain a consistently tidy and inviting living space that you, your household, and your guests will enjoy. With a few simple steps, you can go from cluttered to tidy in no time.
5 Tips for a Tidy Home
1. Start by Decluttering
The first step on your journey to tidiness is getting rid of clutter lying around your home. Go through each room and evaluate your belongings, asking yourself what is truly necessary among them. If something isn’t a keeper, consider donating, selling, or discarding it. Decluttering creates more spaces and will make cleaning up easier in the long run. Not sure where to start? Focus your initial decluttering efforts on the closets throughout your home and see how much space you can open up for belongings that are currently stored elsewhere.
Making your home tidy is one thing; keeping your home tidy is another. The difference between the two is finding and establishing a cleaning routine that works for you, whether that means doing a few upkeep chores daily or hit “reset” by dedicating a chunk of time to it once a week. Whatever you choose, consistency is key. Include quick tasks like making the bed, wiping down kitchen counters, and doing a load of laundry. Having a routine in place will help you keep up the momentum that’s required to maintain a tidy home.
Everything in your home has to go somewhere. To stay organized, store your items neatly in dedicated bins to maximize your storage efficiency. Keeping items accessible but stored out of sight will give you more room in the open areas of your home and help each room feel tidier. Use containers, shelves, and organizers to keep items like toys, books, and accessories neatly arranged. In the closet, you can maximize space by using hangers, bins, and dividers to keep your wardrobe and accessories in order.
4. Multi-Purpose Cleaning Products
Using multi-purpose cleaning products will simplify your cleaning process and get your home sparkling clean. Having a single cleaner to tackle tough stains and messes around the house can save you money too. Natural cleaning solutions that you can find in the aisles of your grocery store will streamline your cleaning efforts without spraying chemicals throughout the house. Things like lemons, salt, and vinegar will eliminate household odors and can even help to keep bugs and pests at bay. When shopping for cleaning products, look for organic solutions that won’t harm members of your household and your pets.
Turn your attention to high-traffic areas throughout the house such as the living room and the kitchen. Improvements in your home’s tidiness in these areas will go a long way in contributing to its overall cleanliness. Also, focus on cleaning your appliances. These machines are the workhorses behind a well-functioning home, so giving them some attention will help keep things tidy at home in the long run.
As you start searching for homes, you’ll likely come across different terms that describe the status of different listings. One term, “Days on Market” (DOM), can play a role in your strategy for making an offer. Knowing what this term means will help to inform your discussions with your agent as you go about finding the right home for you.
What is Days on Market (DOM)?
Days on Market (DOM) is a metric used by real estate professionals (and home buyers) to measure the time that a certain property has been listed for sale. In other words, it’s the running total number of days since a home hit the market. Different factors contribute to how long a home is on the market, including the home’s features, its location, and the local market conditions. Brush up on seller’s and buyer’s markets to understand how these market conditions affect days on market.
Buyer Hesitancy: Just like contingent and pending listings, a home with a longer Days on Market may make buyers think there is something wrong with the property. The right buyer may very well come along, not swayed in their decision by the DOM number, but for some, it raises questions about why the home hasn’t sold yet.
Market Value: Over time, Days on Market can impact the home’s listing price and how much it ultimately sells for. If a property stays on the market for an extended period, the seller may need to reduce the price to prevent it from going stale. On the other hand, the longer the DOM, the more leverage a buyer potentially has to negotiate a more favorable offer.
Local Market Conditions: Looking at trends in DOM can give both buyers and sellers a better understanding of local market conditions. If homes are flying off the market left and right with low DOM, it’s a competitive market that favors sellers. Buyers will be more likely to remove contingencies to make their offer stand out amongst the competition. If DOM is high across the board, the market is not as competitive, and buyers have more leverage.
Negotiations: The leverage created by Days on Market flows through to negotiations. If you have leverage on your side, you can expect that the seller will be more willing to negotiate on price or repairs than they would if the tables were turned. Make sure you and your agent are on the same page regarding how the DOM figures you’re seeing locally will affect your strategy for making an offer on a house.
Talk to your real estate agent for more information about Days on Market (DOM) and how long homes are staying on the market near you. This one statistic could alter your strategy for approaching the market and, when the time comes, how you put together your offer on a home. Connect with an experienced Windermere Real Estate agent today to learn more:
The desire to maximize property value among homeowners is stronger now than ever. As the movement of short-term rentals, turnkey properties, and real estate investment continue to grow in popularity, it’s worth it to take a moment and understand the regulations that dictate a property’s potential. Understanding a bit more about the process for obtaining the necessary permits to build structures on your property will help you avoid getting bogged down in legalities when trying to complete these projects.
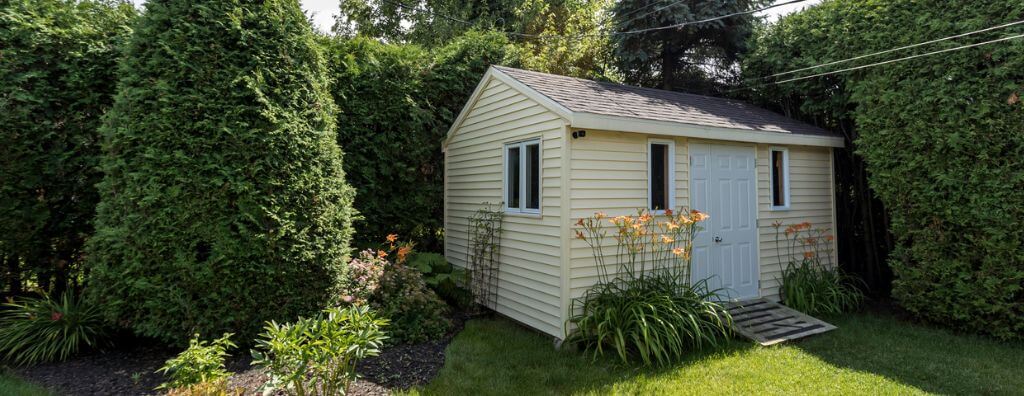
Do I need a permit to build an ADU?
Accessory Dwelling Units (ADUs) and other additional property structures have emerged as viable options for homeowners looking to maximize their property’s potential. These structures offer additional living space while creating opportunities to generate extra income or accommodate multigenerational family members. But before you break ground on your building project, here are some of the things you should keep in mind.
Permits and Regulations: No matter where you live, it is necessary to obtain the appropriate permit before you begin the construction process. Permits ensure that your project complies with local building codes and regulations. Though some guidelines are universal, keep in mind that every local area has its own specific building requirements for residential properties.
Code Compliance: Building codes aren’t just red tape for the sake of red tape; they exist to make sure that all buildings are safe. Whether you’re building the structures on your property DIY or hiring a professional to do the job, you are the one kickstarting the project, not your local municipality. But by having these codes in place, they can ensure that you’re adhering to the required standards of safety. Before you even start on your project, familiarize yourself with your local codes and regulations. Contact your local zoning department or building authority to learn more.
Applying for a Permit: The permit application process varies by location. Typically, you’re required to submit detailed plans for your project with documents that outline its scope, size, etc. Whether you submit architectural drawings, engineering plans, or some other form of detailed blueprint, be prepared for a thorough review on behalf of your local authority to make sure your project complies with the rules.
Whatever project you have in mind—ADU, garden shed, pool house—it’s important to become well-versed in the permits and regulations that will allow you to get it built hassle-free. Consult with local authorities to get the full picture of what’s required from you. Once you’ve checked all the boxes, you’ll be well on your way to maximizing the value of your property. Pair your building project with these design ideas to take your backyard to the next level:

 Facebook
 X
X
 Pinterest
 Copy Link


")


