Market News February 4, 2022

Q4 2021 Idaho Real Estate Market Update

The following analysis of select counties of the Idaho real estate market is provided by Windermere Real Estate Chief Economist Matthew Gardner. We hope that this information may assist you with making better-informed real estate decisions. For further information about the housing market in your area, please don’t hesitate to contact your Windermere Real Estate agent.


Regional Economic Overview

The Idaho economy continues to impress with employment growing by 2.1% over the past year. Comparatively, the country as a whole has grown by 4.2% during the same period; however, the U.S. still needs to recover more than 3.7 million jobs that were lost due to COVID-19, while Idaho has already fully recovered. Moreover, state employment levels are 14,500 jobs higher than the pre-pandemic peak. Given the robust employment growth, it’s not surprising that the unemployment rate was a very impressive 2.8% in November (the most recent data available). New COVID-19 cases started rising again at the start of 2022, but it’s still unclear whether that will have an impact on the economy. Instinctively, I do not see it as a significant impediment, as the latest data suggests that infection rates may have already peaked.
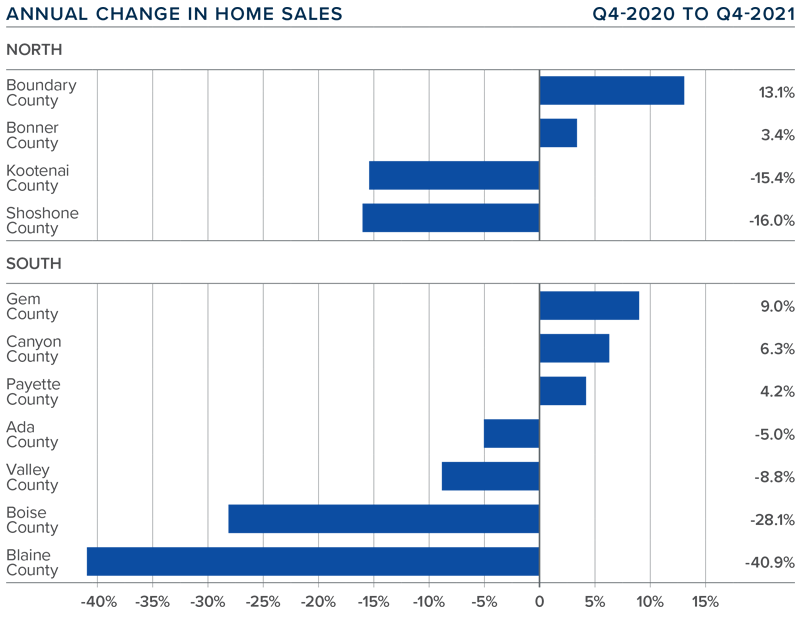
idaho Home Sales

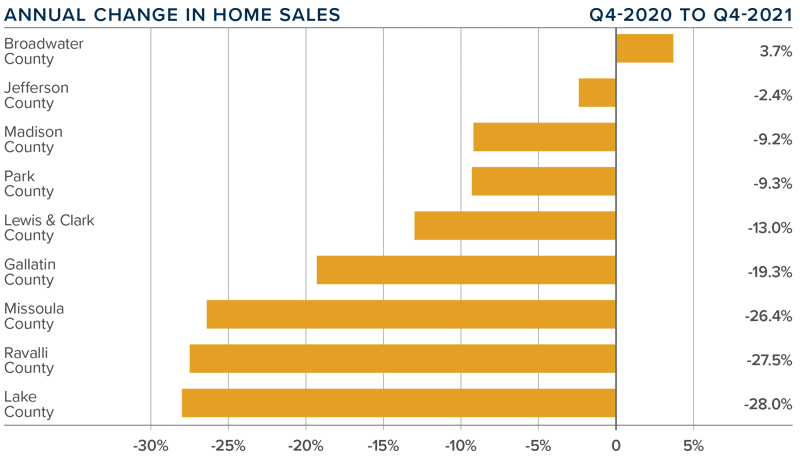
❱ In the final quarter of 2021, 6,887 homes sold. This was 5.7% lower than a year ago, and down 6.4% compared to the third quarter of last year.

❱ Quarter-over-quarter, sales rose in Bonner and Payette counties, but fell in the rest of the market areas covered by this report.

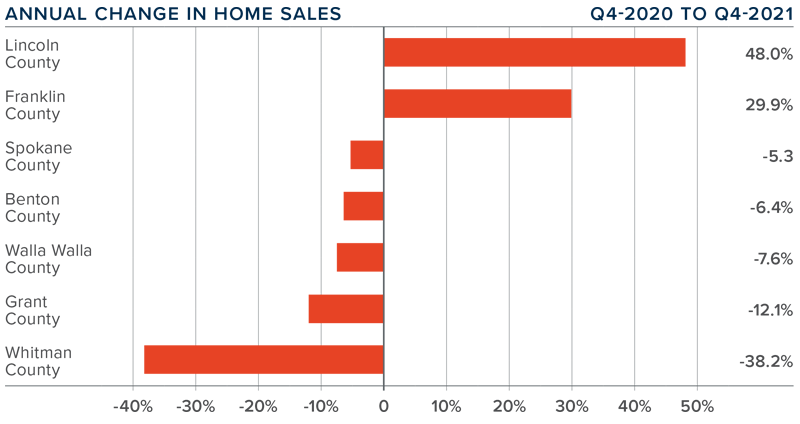
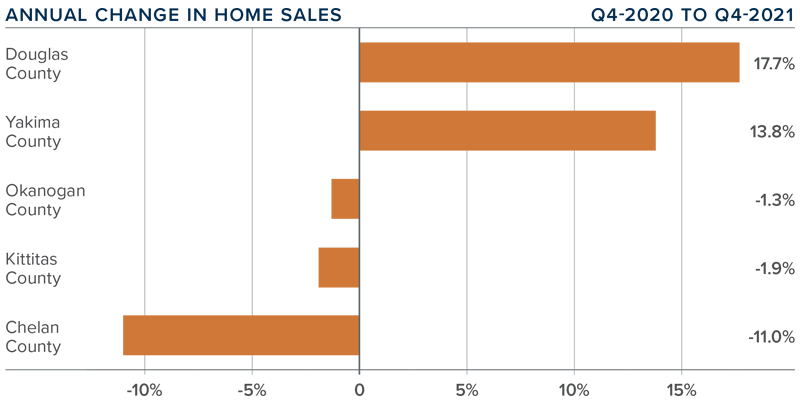
❱ Year-over-year, sales improved in Boundary and Bonner counties in the northern part of the state. Sales rose in Gem, Canyon, and Payette counties in Southern Idaho.

❱ Pending sales were 14% lower than in the third quarter, which suggests a slowing market, but this can be attributed to seasonality. Listing activity was up 41% compared to a year ago but fell 25.5% from the third quarter. The market remains very tight on the supply side.
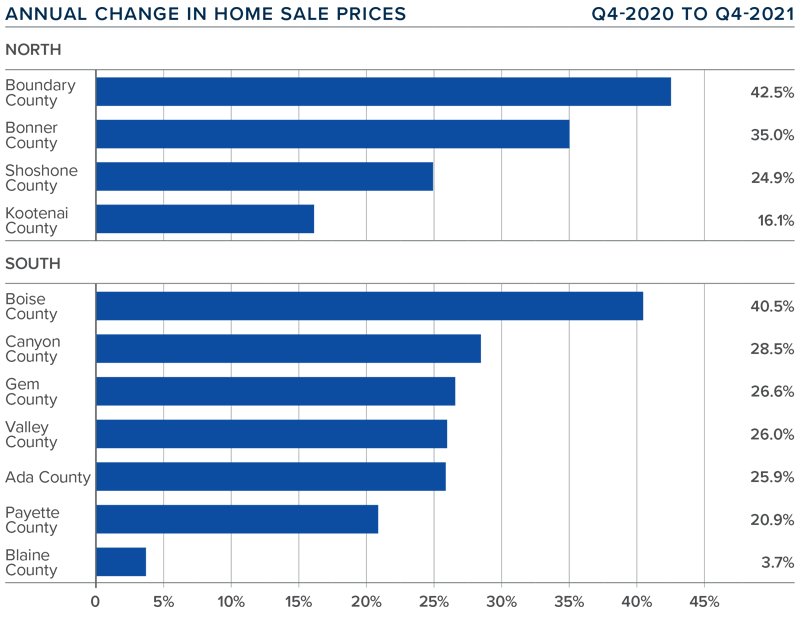
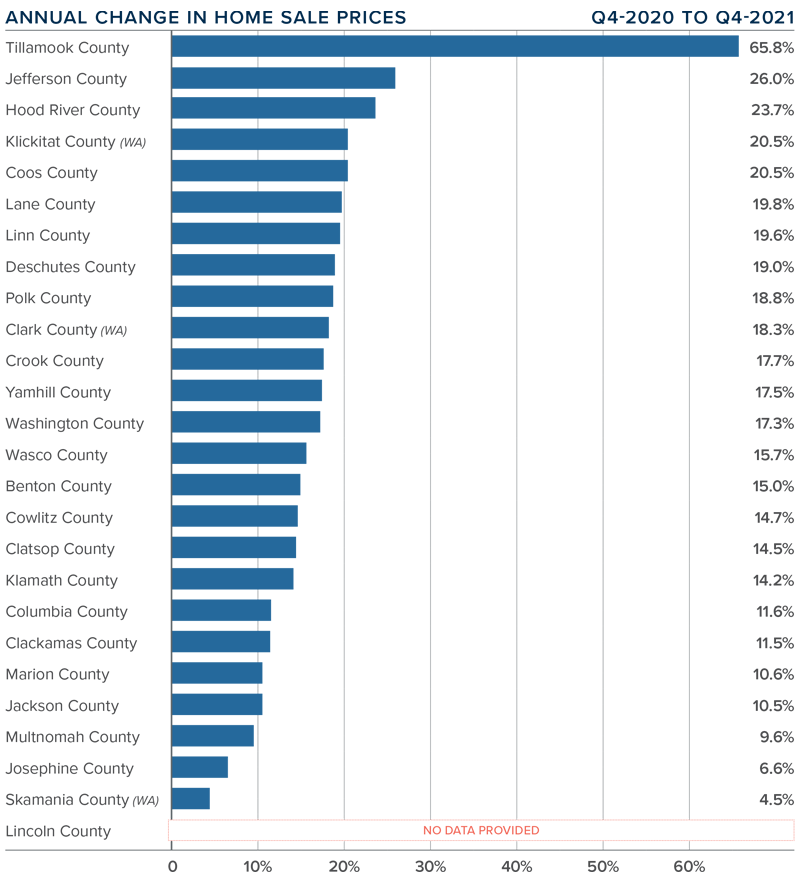
A bar graph showing the annual change in home sales in various counties in north and south Idaho during the fourth quarter of 2021.

idaho Home Prices

A map showing the real estate market percentage changes in various counties in North and South Idaho during the fourth quarter of 2021.

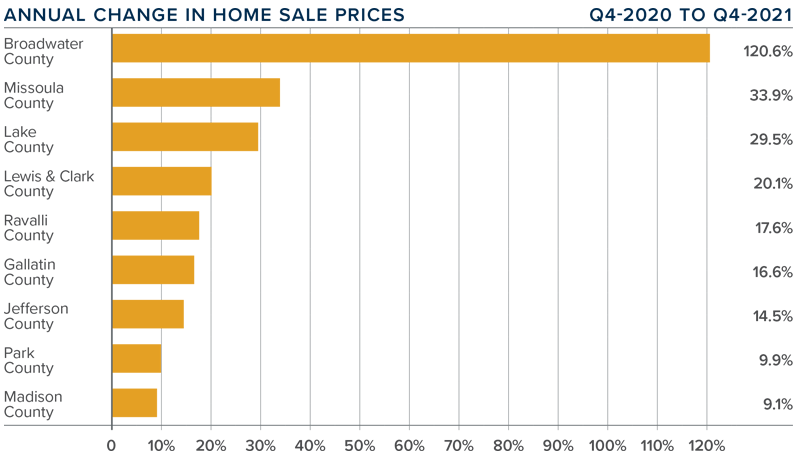
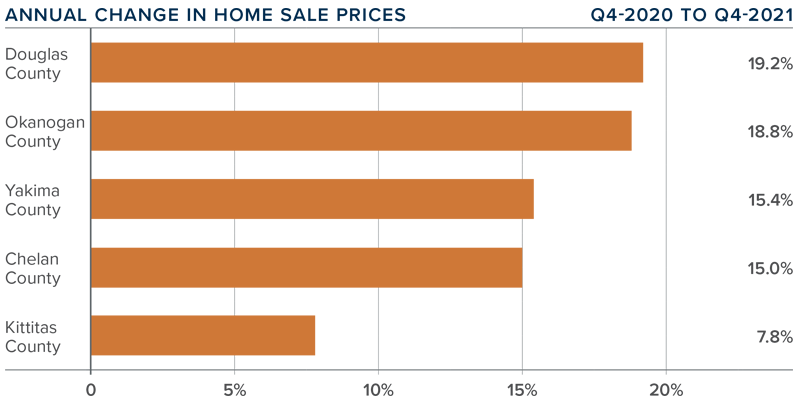
❱ The average home price in the region rose 19.6% year-over-year to $593,868 but fell 1.5% compared to the third quarter.

❱ When compared to the third quarter of 2021, prices were higher in Bonner and Boundary counties in the north, and in Payette, Canyon, and Gem counties in Southern Idaho.

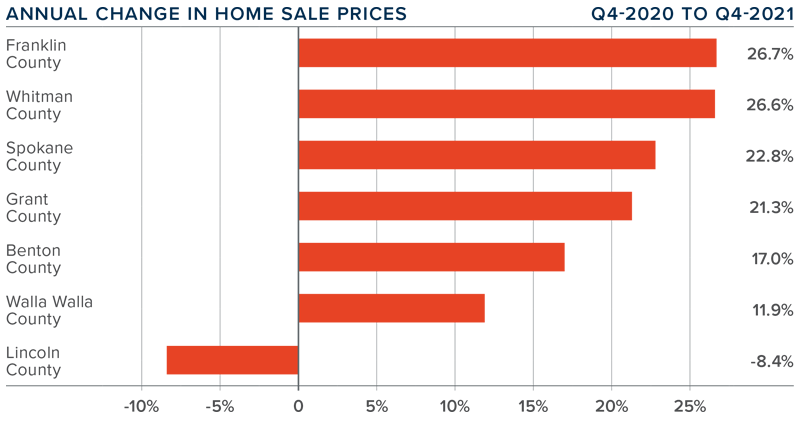
❱ Prices rose by double digits in all of the northern counties in this report, while in the southern counties, all but Blaine County saw sale prices rise by more than ten percent. In aggregate, prices rose 29.1% in the Northern Idaho counties and were up 20.1% in the southern counties.

❱ Such aggressive price appreciation is impressive given that mortgage rates rose .3% during the quarter. It’s clear the housing market is still out of balance, even as sales growth slowed. This pace of appreciation can’t go on indefinitely, and it seems we’ve reached that end. I expect price growth will trend lower as we move through 2022 due to affordability constraints and rising mortgage rates.
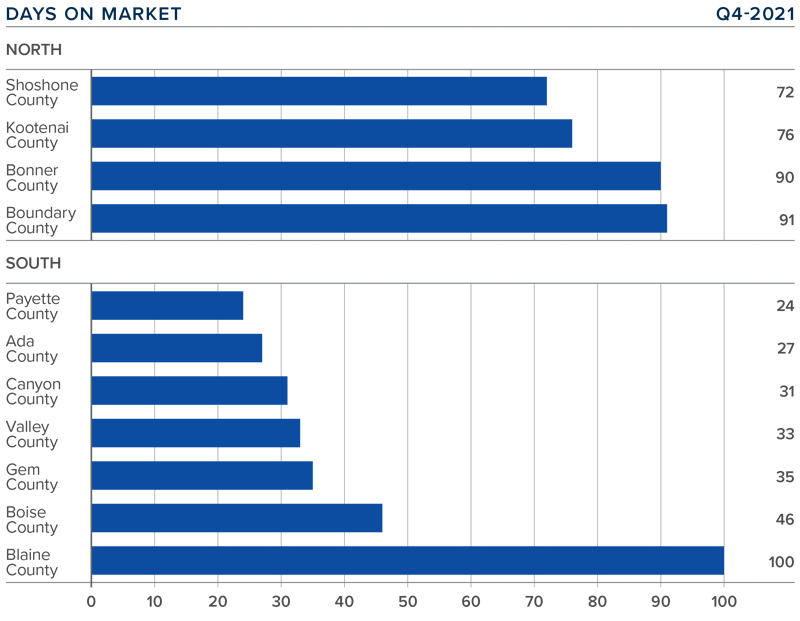
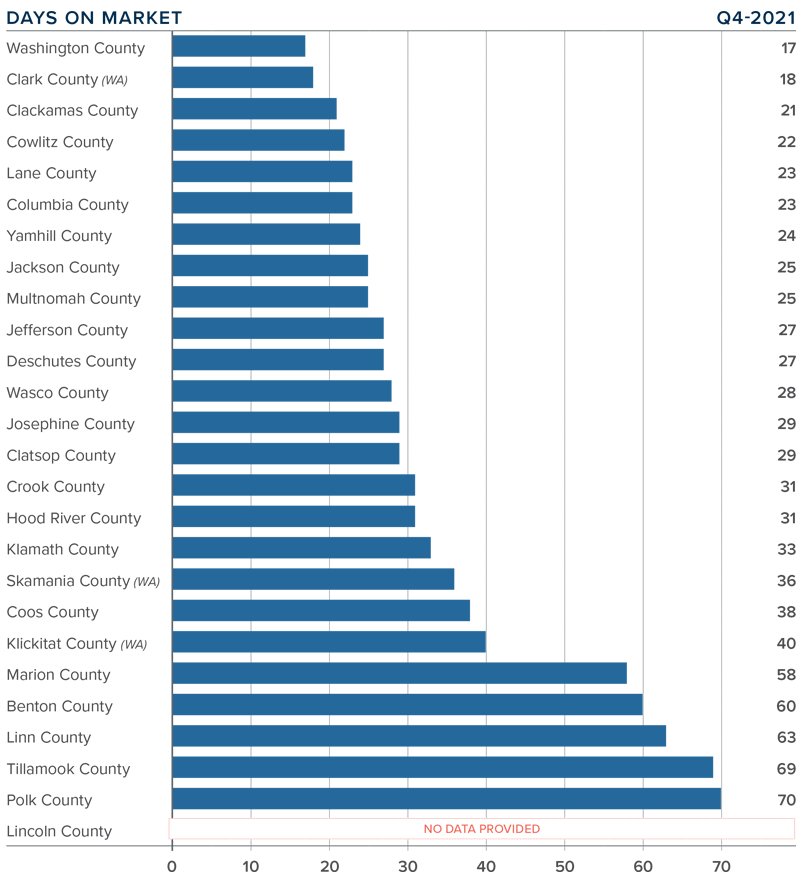
A bar graph showing the annual change in home sale prices for various counties in North and South Idaho during the fourth quarter of 2021.

Days on Market

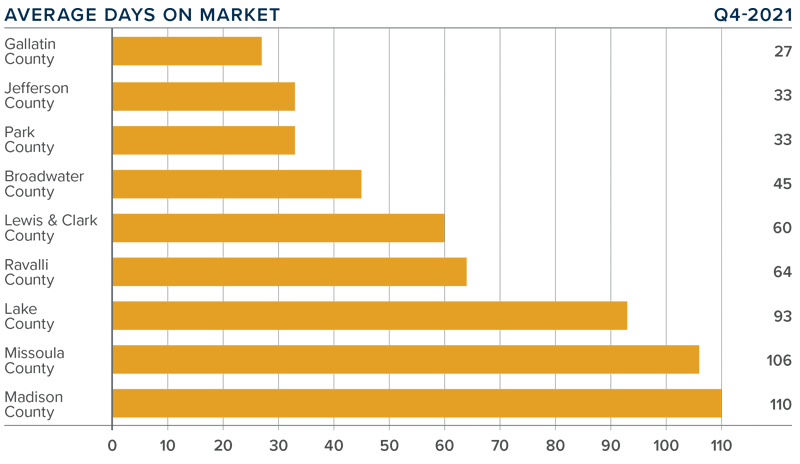
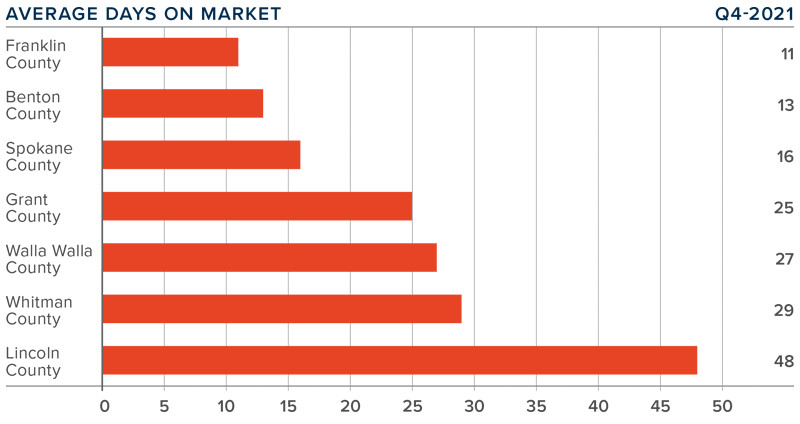
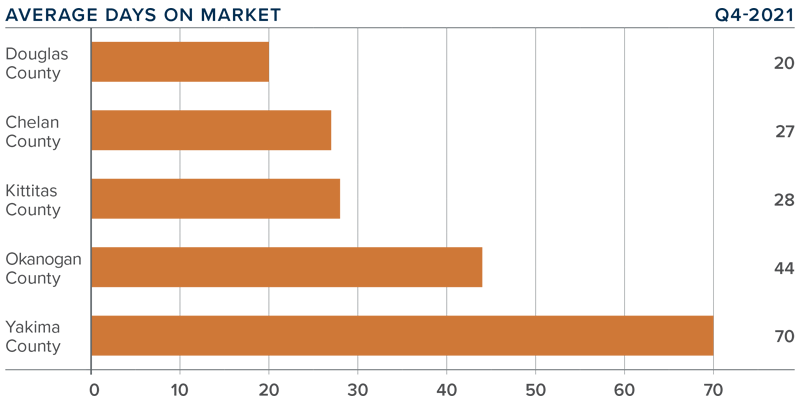
❱ It took an average of 82 days to sell a home in Northern Idaho and 42 days in the southern part of the state.

❱ The average number of days it took to sell a home in the region dropped 9 days compared a year ago but rose 11 days compared to the third quarter of 2021.

❱ In Northern Idaho, days on market dropped in all counties compared to a year ago but rose in all counties compared to the third quarter of 2021. In Southern Idaho, market time also dropped in Valley, Payette, and Blaine counties but rose in the other markets covered by this report.

❱ Homes sold the fastest in Payette County in the southern part of the state, and in Shoshone County in Northern Idaho.

A bar graph showing the average days on market for homes in various counties in North and South Idaho during the fourth quarter of 2021.

Conclusions

A speedometer graph indicating a seller's market in Idaho during the fourth quarter of 2021.

This speedometer reflects the state of the region’s real estate market using housing inventory, price gains, home sales, interest rates, and larger economic factors.

Idaho’s economy continues to fire on all cylinders. Such robust growth has caused the housing market to perform extremely well—as demonstrated by the rapid pace of home price appreciation.

In-migration to Idaho has been impressive. Much of this has been driven by the ability for employees to continue working remotely. For many workers leaving more expensive markets, price points in Idaho are a major draw. Although mortgage rates will continue to climb higher in 2022, my forecast calls for home prices in Idaho’s southern counties to see low double-digit percentage gains while the northern part of the state can expect increases in the high teens. Good news for sellers, but buyers will likely not be so happy.

Even with the prospect of more homes coming to market in the spring, Idaho remains staunchly a seller’s market and I am moving the needle a little more in their favor.

About Matthew Gardner

Matthew Gardner - Chief Economist for Windermere Real Estate

As Chief Economist for Windermere Real Estate, Matthew Gardner is responsible for analyzing and interpreting economic data and its impact on the real estate market on both a local and national level. Matthew has over 30 years of professional experience both in the U.S. and U.K.

In addition to his day-to-day responsibilities, Matthew sits on the Washington State Governors Council of Economic Advisors; chairs the Board of Trustees at the Washington Center for Real Estate Research at the University of Washington; and is an Advisory Board Member at the Runstad Center for Real Estate Studies at the University of Washington where he also lectures in real estate economics.

Market News February 4, 2022

Q4 2021 Montana Real Estate Market Update

The following analysis of select Montana real estate markets is provided by Windermere Real Estate Chief Economist Matthew Gardner. We hope that this information may assist you with making better-informed real estate decisions. For further information about the housing market in your area, please don’t hesitate to contact your Windermere Real Estate agent.


Regional Economic Overview

Jobs continue to return to Montana. The latest data shows the state needs only 3,700 more jobs to reach its pre-pandemic peak. As I have mentioned in past reports, the pace of the job recovery has been slowing—particularly in the Great Falls and Missoula metro areas—but this has been offset by growth in Billings and other parts of the state. The latest unemployment numbers showed only 2.8% of the workforce out of work, which is significantly better than the country as a whole. In the metro areas contained in this report, the lowest jobless rate was in Billings at 1.8%, followed by Great Falls at 1.9%, and Missoula at 2%. I still anticipate a full job recovery but, when placed alongside extremely low unemployment rates, the recent slowdown suggests that a lack of workers is the biggest hurdle for employers. I anticipate a return to pre-pandemic employment levels toward the end of 2022.

montana Home Sales

❱ In the final quarter of 2021, 1,479 homes sold in the markets contained in this report, which is 17.6% below the level a year ago and 14.1% lower than the previous quarter.

❱ Sales did manage to rise in Broadwater County, but it was only by one unit. Compared to the third quarter, sales were lower in every county other than Lake.

❱ Lower quarter-over-quarter sales are not surprising given seasonal factors. The drop in sales compared to a year ago is likely due to low inventory levels, which were down 47%.

❱ Year-over-year, listings were down between 30% and 82% in the counties contained in this report. Buyers are still looking, but if there isn’t a significant increase in the number of homes coming to market in the spring, things will remain very competitive for buyers.

A bar graph showing the annual change in home sales for various counties in Montana during the fourth quarter of 2021.

montana Home Prices

A map showing the real estate market percentage changes in various counties in Montana during the fourth quarter of 2021.

❱ With the supply limitations discussed above, it’s hardly surprising to see prices rise 17% year over year to an average of $721,634. Prices were also 8.3% higher than in the third quarter of 2021.

❱ When compared to the third quarter of 2021, home sale prices were lower in Ravalli, Lewis and Clark, Broadwater, and Jefferson counties, but rose in the remaining markets.

❱ Average home sale prices rose by double digits in all but two of the counties contained in this report. Broadwater County saw prices more than double.

❱ Mortgage rates trended higher in the final quarter of the year, which I expect to continue as we move through 2022. This should act as a headwind to home price growth, but my current forecast suggests that prices will continue to rise by an average of 15% in 2022.

A bar graph showing the annual change in home sale prices for various counties in Montana during the fourth quarter of 2021.

Days on Market

❱ The average time it took to sell a home in fourth quarter dropped by seven days compared to the previous year.

❱ Homes sold fastest in Gallatin County and slowest in Madison County. Days on market dropped in Ravalli, Lake, Lewis and Clark, and Jefferson counties, but rose in the balance of the counties contained in this report.

❱ It took an average of 64 days to sell a home in the region during fourth quarter.

❱ Relative to the third quarter of 2021, market time dropped in Ravalli, Broadwater, and Jefferson counties, but rose in all other markets.

A bar graph showing the average days on market for homes in various counties in Montana during the fourth quarter of 2021.

Conclusions

A speedometer graph indicating a seller's market in Montana during the fourth quarter of 2021.

This speedometer reflects the state of the region’s real estate market using housing inventory, price gains, home sales, interest rates, and larger economic factors.

The job recovery in Montana continues and, at this point, is only limited by the number of available workers. In addition, according to the Montana Secretary of State, a record number of new businesses were registered in 2021. With a growing economy, it’s no surprise that there is a strong demand for housing. Even as mortgage rates continue to rise, there are clearly more buyers than sellers, which sets the stage for home prices to rise at well-above average rates.

As mentioned earlier, I would not be surprised if prices rose by an average of 15% this year as supply and demand remain out of balance. Given all these factors, I have decided to move the needle further toward home sellers.

About Matthew Gardner

Matthew Gardner - Chief Economist for Windermere Real Estate

As Chief Economist for Windermere Real Estate, Matthew Gardner is responsible for analyzing and interpreting economic data and its impact on the real estate market on both a local and national level. Matthew has over 30 years of professional experience both in the U.S. and U.K.

In addition to his day-to-day responsibilities, Matthew sits on the Washington State Governors Council of Economic Advisors; chairs the Board of Trustees at the Washington Center for Real Estate Research at the University of Washington; and is an Advisory Board Member at the Runstad Center for Real Estate Studies at the University of Washington where he also lectures in real estate economics.

Market News February 3, 2022

Q4 2021 Eastern Washington Real Estate Market Update

The following analysis of the Eastern Washington real estate market is provided by Windermere Real Estate Chief Economist Matthew Gardner. We hope that this information may assist you with making better-informed real estate decisions. For further information about the housing market in your area, please don’t hesitate to contact your Windermere Real Estate agent.


Regional Economic Overview

The Eastern Washington economy has proved remarkably resilient to the effects of the pandemic, having recovered all of the jobs that were lost and adding more than 20,500 more. Every county except Whitman shows employment levels above their pre-pandemic peak. It should be added that this report considers total employment, not just non-agricultural jobs, so the numbers are higher than might be expected. With the job market expanding at a solid pace, it is not a surprise to see the unemployment rate continuing to trend lower. As of November 2021 (the most recent data available), only 3.4% of the workforce was unemployed—down from the pandemic peak of 14.9%.

eastern washington Home Sales

❱ In the final quarter of 2021, 3,714 homes sold, down 5.1% compared to the same period in 2020. Sales were also 10.3% lower than in the third quarter, but this was mainly due to seasonal changes in the market.

❱ The number of home sales was disappointing, and though we might suspect the slowing is due to a lack of homes for sale, listings were down by less than 1%, which makes the drop in sales somewhat puzzling.

❱ Year-over-year, sales rose in two counties but fell in the other five. Compared to the third quarter, sales fell everywhere but Franklin County.

❱ Whether it was the rise of new COVID-19 infections, inclement weather, or rising mortgage rates, the main culprit behind the slowdown in sales is unclear. I will be very interested to see how the market performs in the first quarter of the new year.

A bar graph showing the annual change in home sales for various counties in Eastern Washington during the fourth quarter of 2021.

eastern washington Home Prices

A map showing the real estate market percentage changes for various counties in Eastern Washington during the fourth quarter of 2021.

❱ Year-over-year, the average home price in Eastern Washington rose a very significant 21.3% to $423,870 but pulled back by a modest .4% compared to the third quarter of the year.

❱ When compared to third quarter, prices rose in Benton, Franklin, and Walla Walla counties. Prices remained static in Lincoln County and dropped in the rest of the market areas.

❱ Lincoln County saw prices drop compared to the previous year, but it is a small market, which makes it prone to significant swings. The balance of the counties contained in this report saw prices rise at double-digit rates across the board.

❱ Mortgage rates rose .3% between October and the end of the year, which may have impacted near-term price growth. That said, Spokane County is now technically unaffordable for a buyer making the median income and every county other than Lincoln is unaffordable for first-time buyers. Price growth is likely slowing due to lower affordability.

A bar graph showing the annual change in home sale prices for various counties in Eastern Washington during the fourth quarter of 2021.

Days on Market

❱ The average time it took to sell a home in Eastern Washington in the final quarter of 2021 was 24 days.

❱ During the quarter, it took seven fewer days to sell a home in Eastern Washington than it did a year ago.

❱ All markets other than Lincoln saw the average number of days-on-market drop compared to the same period in 2020, with significant declines in Walla Walla (-23 days) and Whitman (-13 days) counties.

❱ It took ten more days to sell a home in the quarter than it did during the third quarter of this year.

A bar graph showing the average days on market for homes in various counties in Eastern Washington during the fourth quarter of 2021.

Conclusions

A speedometer graph indicating a seller's market in Eastern Washington during the fourth quarter of 2021.

This speedometer reflects the state of the region’s real estate market using housing inventory, price gains, home sales, interest rates, and larger economic factors.

Solid employment gains continue in Eastern Washington, but the housing market appears to have taken somewhat of a breather. Housing data for the winter months can be a little frenetic, but the signs of a slowdown are there. Although it is far too early to suggest that this is the case, it will be interesting to see how the market performs in the spring, especially considering rising mortgage rates and falling affordability levels.

Ultimately, only time will tell, but it seems that the Eastern Washington market is poised for a move back to some sort of balance—at least given the current data. As such, I have moved the needle a little toward home buyers, but it remains a seller’s market.

About Matthew Gardner

Matthew Gardner - Chief Economist for Windermere Real Estate

As Chief Economist for Windermere Real Estate, Matthew Gardner is responsible for analyzing and interpreting economic data and its impact on the real estate market on both a local and national level. Matthew has over 30 years of professional experience both in the U.S. and U.K.

In addition to his day-to-day responsibilities, Matthew sits on the Washington State Governors Council of Economic Advisors; chairs the Board of Trustees at the Washington Center for Real Estate Research at the University of Washington; and is an Advisory Board Member at the Runstad Center for Real Estate Studies at the University of Washington where he also lectures in real estate economics.

Market News February 3, 2022

Q4 2021 Central Washington Real Estate Market Update

The following analysis of the Central Washington real estate market is provided by Windermere Real Estate Chief Economist Matthew Gardner. We hope that this information may assist you with making better-informed real estate decisions. For further information about the housing market in your area, please don’t hesitate to contact your Windermere Real Estate agent.


Regional Economic Overview

Central Washington employment rose 7.7% compared to a year ago, and employment levels remain well above the pre-pandemic peak. Across the five counties that make up this report, total employment is now around 4,000 more than before the pandemic. A significant number of jobs were lost in November, which gives me pause. Data for the region is not adjusted for seasonality, which may have played a part in the contraction, but we will have to wait until the spring to see if this was an anomaly or whether a pattern has emerged. Even with the slowdown, the unemployment rate was 4.4%, which is still a decent number. The lowest jobless rate was in Kittitas County at 3.6%. The highest rate was in Yakima County, where 4.9% of the labor force was unemployed.

central washington Home Sales

❱ Sales in Central Washington rose 3.9% versus a year ago, with 1,599 homes trading hands. Sales fell 2.1% compared to the third quarter of 2021, but seasonal factors likely impacted the number.

❱ Pending sales fell 19.7% compared to the third quarter, suggesting that closings in the first quarter of the year may not show much improvement.

❱ Compared to a year ago, sales rose in Douglas and Yakima counties but fell in all other markets covered by this report. Compared to the third quarter of last year, sales fell in every county other than Okanogan, which registered an impressive 22% increase.

❱ I was pleased to see inventory levels rise 16.9% year over year, but they were down 20.9% compared to the third quarter of 2021. This likely contributed to the drop in pending sales.

A bar graph showing the annual change in home sales for various counties in Central Washington during the fourth quarter of 2021.

central washington Home Prices

A map showing the real estate market percentage changes in various counties in Central Washington during the fourth quarter of 2021.

❱ The average home price in Central Washington rose 11.1% year over year to $489,443 and was .4% higher than in the third quarter of the year.

❱ While home prices in the area continue to rise, we are starting to see the pace of growth slow. This is likely because mortgage rates rose .3% during the quarter. I anticipate that rates will continue to climb as we move through 2022. This will act as a headwind to the rampant pace of price growth that we have seen for the past few years.

❱ Every county except Kittitas saw double-digit increases in sale prices. Chelan and Kittitas counties showed higher sale prices than in the third quarter.

❱ All counties other than Yakima are now technically unaffordable for a household making median income, and no market is affordable for a first-time buyer. This is also likely to have a slowing effect on price growth in 2022.

A bar graph showing the annual change in home sale prices for various counties in Central Washington during the fourth quarter of 2021.

Days on Market

❱ The average time it took to sell a home in Central Washington in the final quarter of 2021 was 38 days.

❱ During the quarter, it took 11 fewer days to sell a home in Central Washington than it did a year ago.

❱ All counties other than Yakima saw the length of time it took to sell a home drop compared to a year ago, with noticeable improvements in Chelan and Okanogan counties. Compared to the third quarter, market time rose in all areas, but seasonal changes were likely the cause.

❱ It took seven more days to sell a home in the fourth quarter than it did in the third.

A bar graph showing the average days on market for homes in various counties in Central Washington during the fourth quarter of 2021.

Conclusions

A speedometer graph indicating a seller's market in Central Washington during the fourth quarter of 2021.

This speedometer reflects the state of the region’s real estate market using housing inventory, price gains, home sales, interest rates, and larger economic factors.

Due to seasonal changes, it is always hard to get a clear picture of the market from the winter sales numbers. However, it does appear as if the market may be coming off the frenetic pace of price growth that we’ve seen over the past two years. Inventory levels were higher, which, in concert with rising mortgage rates, may have slowed price appreciation—albeit modestly—in the quarter.

As mentioned previously, I anticipate that mortgage rates will continue to move higher through 2022. Combined with low levels of affordability in the area, this is likely to further slow home price growth.

As such, I am moving the needle a little more toward buyers. However, owners looking to sell a well-positioned and appropriately priced home are unlikely to have much of a problem finding a buyer.

About Matthew Gardner

Matthew Gardner - Chief Economist for Windermere Real Estate

As Chief Economist for Windermere Real Estate, Matthew Gardner is responsible for analyzing and interpreting economic data and its impact on the real estate market on both a local and national level. Matthew has over 30 years of professional experience both in the U.S. and U.K.

In addition to his day-to-day responsibilities, Matthew sits on the Washington State Governors Council of Economic Advisors; chairs the Board of Trustees at the Washington Center for Real Estate Research at the University of Washington; and is an Advisory Board Member at the Runstad Center for Real Estate Studies at the University of Washington where he also lectures in real estate economics.

Design February 2, 2022

Hiring a Contractor for Your Remodel

Much has been said about the benefits of taking a DIY approach to home remodeling projects. It instills pride of ownership, builds the sweat equity you’ve put into your home, and can be more affordable than hiring a professional. The reality is, however, that sometimes, projects simply require a pro to be done right. Whether it’s the magnitude of the project, the caliber of skill required to successfully complete the job, or a combination of the two, certain projects are best executed in the hands of a professional. So, what do you need to keep in mind when hiring a contractor? Here are some quick tips:

Preparing to Hire a Contractor

Have your plans ready when you begin meeting with contractors. This will show them that you are prepared and fully invested in the project. Conduct phone interviews and meet in-person with potential candidates to give yourself the opportunity to gauge their professionalism and expertise. Here are some helpful questions to ask to get you started:

  • What prior experience do you have with this particular remodeling project?
  • Is your company licensed?
  • What is your timeline for starting and completing this job?
  • How long have you worked with your current subcontractors?
  • Could you provide a list of references that can speak to your quality of work?

Contractor Contracts and Implied Warranty

It is important that you understand the contract you’re agreeing to, and that you examine its finer points, such as the warranty terms. These terms will spell out what course of action will result should there be an issue with the contractor’s work. In the U.S., we have a legal concept known as “implied warranty” that protects those who hire out contractors. “Implied warranty” essentially means that it is understood that the contractor will perform quality work and that the home will continue to be safe to live in as a result of the repairs. These implied warranties are known as “good workmanship” and “habitability” respectively.

A good contract will have a detailed description of the labor and materials required to perform the job, a project schedule, the names of suppliers and subcontractors the contractors plan to use, and the payment schedule you have agreed upon. 


A man and a woman shake hands with two contractors as they go over their remodeling plans.

Image Source: Getty Images – Image Credit: shynesher


Setting a Payment Schedule

When it comes to the cost of labor and materials, you won’t have much room for negotiation. The payment schedule, however, is one area where you can negotiate. Before the work begins, agree on a payment structure with your contractor. Good contractors want to perform high-quality work, completed on-time, and the agreement you reach together can incentivize their work. For example, you can stipulate that a certain percentage of the total job cost is paid out when certain stages of the project are completed.

The Potential for Temporary Housing

For large-scale remodeling projects, contractors need space to work at a high standard. Accordingly, it may be best for everyone involved if you and your household move out of your home temporarily until the work is complete. A home during a remodel is a noisy and chaotic place to be. Dust is flying, saws are buzzing, sheetrock is crashing to the floor, walls are being knocked out, and hammers are hammering. Trying to coexist with the remodel may be more trouble than it’s worth, since your usage of your home will be severely limited for the time being. If you plan on hiring a contractor to perform a large-scale remodel, search for housing alternatives far in advance to ensure that you and your household will have a place to stay.


For more information on remodeling your home, read our guide to remodeling your bathroom:

A Guide to Remodeling Your Bathroom

Market News February 2, 2022

Q4 2021 Colorado Real Estate Market Update

The following analysis of the Metro Denver & Northern Colorado real estate market is provided by Windermere Real Estate Chief Economist Matthew Gardner. We hope that this information may assist you with making better-informed real estate decisions. For further information about the housing market in your area, please don’t hesitate to contact your Windermere Real Estate agent.


Regional Economic Overview

Following a decent summer when Colorado added around 14,000 jobs each month, the pace of recovery has slowed. That said, the latest data shows that more than 320,000 of the 376,000 jobs shed due to the pandemic have now returned. The state still needs to add a little more than 54,000 jobs in order to get back to pre-pandemic employment levels. Even though there has been a slowdown in the job recovery, which is likely due to the rise of new COVID-19 variants, I am still forecasting the state will return to its prior employment peak by the end of the summer. As jobs return, the employment rate continues to drop; it was 5.1% in November, well below the pandemic peak of 12.1%. Although it would be nice to see a lower rate, more people have returned to the workforce and are actively looking for work, which can stall job growth rates. From a regional perspective, unemployment levels range from a low of 3.8% in Boulder, to a high of 5.2% in Grand Junction.

colorado Home Sales

❱ In the final quarter of the year, 11,714 homes sold, representing a drop of 5.3% compared to the fourth quarter of 2020 and a drop of 17.6% compared to the third quarter of the year.

❱ While sales slowed region-wide, 4 of the 12 counties included in this report actually experienced significant sales increases.

❱ I’m not concerned that sales slowed compared to third quarter, as seasonal factors were likely the cause. It’s also likely that the year-over-year decline was due to the fact that there were 30% fewer homes for sale in the fourth quarter of 2021 than there were the previous year.

❱ Pending sales, which are an indicator of future closings, fell 29% compared to the third quarter, suggesting that closings in the first quarter of 2022 may also be light.

A bar graph showing the annual change in home sales for various counties in Colorado during the fourth quarter of 2021.

colorado Home Prices

A map showing the real estate market percentage changes in various counties in Colorado during the fourth quarter of 2021.

❱ The pace of home-price growth continued to slow, albeit modestly. The average sale price rose 14.8% year over year, to an average of $610,275. Prices also rose .8% from the previous quarter.

❱ Boulder County’s price growth was noteworthy, but of even greater interest was that average sale prices are holding above the $1 million ceiling.

❱ Year-over-year, prices rose across all markets covered by this report, with double-digit gains in all but three counties.

❱ The number of homes for sale remains woefully low in most areas, which continues to put upward pressure on home prices. That said, the pace of appreciation slowed through most of 2021. This trend is likely to continue in 2022.

A bar graph showing the annual change in home sale prices for various counties in Colorado during the fourth quarter of 2021.

Days on Market

❱ The average number of days it took to sell a home in the markets contained in this report fell five days compared to the final quarter of 2020.

❱ The length of time it took to sell a home dropped in every county other than Clear Creek County compared to the same quarter a year ago.

❱ It took an average of only 21 days to sell a home in the region. Although the pace dropped year over year, it rose 9 days compared to the previous quarter.

❱ Ongoing supply limitations and strong demand have caused the pace of sales to remain brisk. That said, the length of time it took to sell a home rose compared to the third quarter. I don’t think this is a major concern and can likely be attributed to seasonal factors.

A bar graph showing the average days on market for homes in various counties in Colorado during the fourth quarter of 2021.

Conclusions

A speedometer graph indicating a seller's market in Colorado during the fourth quarter of 2021.

This speedometer reflects the state of the region’s real estate market using housing inventory, price gains, home sales, interest rates, and larger economic factors.

Inventory is still lacking, which is causing prices to rise at well-above-average rates. That said, despite how few homes are for sale, the pace of appreciation has been slowing and will likely continue to do so as mortgage rates climb.

My current forecast is for 30-year rates to stairstep higher as we move through the year, which will act as a headwind to price growth. Although I do not see rates getting above 4% until 2023, the increase in borrowing costs will start to have a greater impact on home prices.

In addition to rising mortgage rates, the significant growth in prices over the past year has started to impact housing affordability. Although the market will continue to perform well, rising financing costs and lower affordability may slowly move the market back toward some sort of balance.

All things considered, I am moving the needle a little toward buyers, but it still heavily favors home sellers.

About Matthew Gardner

Matthew Gardner - Chief Economist for Windermere Real Estate

As Chief Economist for Windermere Real Estate, Matthew Gardner is responsible for analyzing and interpreting economic data and its impact on the real estate market on both a local and national level. Matthew has over 30 years of professional experience both in the U.S. and U.K.

In addition to his day-to-day responsibilities, Matthew sits on the Washington State Governors Council of Economic Advisors; chairs the Board of Trustees at the Washington Center for Real Estate Research at the University of Washington; and is an Advisory Board Member at the Runstad Center for Real Estate Studies at the University of Washington where he also lectures in real estate economics.

Market News February 2, 2022

Q4 2021 Southern California Real Estate Market Update

The following analysis of the Southern California real estate market is provided by Windermere Real Estate Chief Economist Matthew Gardner. We hope that this information may assist you with making better-informed real estate decisions. For further information about the housing market in your area, please don’t hesitate to contact your Windermere Real Estate agent.


Regional Economic Overview

Following significant job gains in the summer months, the fall continued to show an economy in recovery. As of the most recent data (November), the southern California region had added more than 212,000 jobs, which is very notable as it exceeds the growth in the previous quarter (and we still have to add the December numbers). So far, the market has recovered more than 1.66 million of the 2.02 million jobs that were lost during the pandemic, and we need only 347,000 more to get back to where we were before the pandemic hit. The region’s unemployment rate in November was 5.9% and has been trending lower since June 2021. All the markets contained in this report saw unemployment numbers drop. The lowest jobless rates were again in Orange County (4.1%) and San Diego County (4.6%). The highest rate was again in Los Angeles County, where it was 7.1%. The fall was a solid season for the regional job market, and I hope this trend continues. Of course, the latest iteration of COVID-19 arrived in December and any impacts to the economy—and specifically the job market—were not reflected in the most recent data. I hope it won’t significantly slow the job recovery, as the region is now on pace to get back to its pre-COVID employment level by this summer.

southern california Home Sales

❱ In the final quarter of the year, 46,517 homes sold, which was down 7.6% from a year ago and 7.5% lower than in the third quarter of the year.

❱ Pending home sales, which are an indicator of future closings, were 17.3% lower than the third quarter, suggesting that sales activity in the early spring may also be lackluster.

❱ Year-over-year, sales fell in all markets; this was also the case compared to the third quarter. Although this may seem disconcerting, much of the blame can be placed on the lack of homes for sale. Inventory was down 33.5% compared to a year ago and 26.3% lower than in the third quarter.

❱ Supply constraints continue to limit sales activity. The issue is not demand, rather it’s a lack of homes for sale that’s holding the market back. Although I expect to see the number of home sales pick up, it is unlikely the region will see total transactions in 2022 exceed 2021 numbers.

A bar graph showing the annual change in home sales for various counties in Southern California during the fourth quarter of 2021.

southern california Home Prices

A map showing the real estate market percentage changes in various counties in Southern California during the fourth quarter of 2021.

❱ The average home sale price in the region was $982,272, which is 17.8% higher than a year ago and 1.1% higher than in the third quarter.

❱ Average mortgage rates rose by almost a quarter point between the third and fourth quarters, but this has yet to slow down price growth. As we move through 2022, I expect rates to continue to stairstep higher. Although rates will likely end the year at close to 4%, the question is whether this level is high enough to slow price growth.

❱ The region saw double-digit price growth across the board. The fastest growth was in Orange County where prices were up 6.3% compared to the previous quarter.

❱ Rising financing costs—combined with more businesses clarifying their work-from-home policies—may result in more home buyer activity. However, if inventory levels do not rise significantly, the market will remain out of balance, which could lead price growth to continue to trend above the long-term average.

A bar graph showing the annual change in home sale prices for various counties in Southern California during the fourth quarter of 2021.

Days on Market

❱ In the final quarter of 2021, the average time it took to sell a home in the region was 21 days, which was 6 fewer days than a year ago but 4 days more than in the third quarter.

❱ The other three counties also saw the time it took to for a seller to find a buyer drop compared to a year ago, but market time rose across the board compared to the third quarter of 2021.

❱ Homes in San Diego County continue to sell at a faster rate than other markets in the region. In the fourth quarter, it took an average of 17 days to sell a home there—2 fewer days than it took a year ago.

❱ Longer days on market may be due to the significant increase in list prices during the quarter in all markets other than Riverside County. Low supply levels have allowed sellers to dictate pricing, but longer market time and fewer transactions could indicate that buyers may be starting to push back.

A bar graph showing the average days on market for homes in various counties in Southern California during the fourth quarter of 2021.

Conclusions

A speedometer graph indicating a seller's market in Southern California during the fourth quarter of 2021.

This speedometer reflects the state of the region’s real estate market using housing inventory, price gains, home sales, interest rates, and larger economic factors.

Jobs continue to return in the region and the housing market remains remarkably tight. As mentioned previously, sellers have been raising prices significantly, but lower sales and longer market time suggest to me that buyers are becoming more selective in the homes they decide to make an offer on. I do not see supply levels increasing significantly, at least not to the degree that matches demand. However, affordability levels continue to drop, which, in concert with rising mortgage rates, may start to slow price growth even as the number of listings remains below the norm.

Considering these factors, I have decided to leave the needle in the same position as the previous quarter. Although it appears that the market may be starting to shift slowly back to balance, I want to see how the spring market performs before I consider moving the needle towards buyers.

About Matthew Gardner

Matthew Gardner - Chief Economist for Windermere Real Estate

As Chief Economist for Windermere Real Estate, Matthew Gardner is responsible for analyzing and interpreting economic data and its impact on the real estate market on both a local and national level. Matthew has over 30 years of professional experience both in the U.S. and U.K.

In addition to his day-to-day responsibilities, Matthew sits on the Washington State Governors Council of Economic Advisors; chairs the Board of Trustees at the Washington Center for Real Estate Research at the University of Washington; and is an Advisory Board Member at the Runstad Center for Real Estate Studies at the University of Washington where he also lectures in real estate economics.

Market News February 1, 2022

Q4 2021 Oregon and Southwest Washington Real Estate Market Update

The following analysis of the Oregon and Southwest Washington real estate market is provided by Windermere Real Estate Chief Economist Matthew Gardner. We hope that this information may assist you with making better-informed real estate decisions. For further information about the housing market in your area, please don’t hesitate to contact your Windermere Real Estate agent.


Regional Economic Overview

Slow and steady is how I would describe Oregon’s job recovery following the massive COVID-19-related job losses that were seen in the spring of 2020. To date, more than 224,000 of the 285,000 jobs that were lost have returned. I’m not forecasting a full job recovery until early next year due to labor shortages and a gap between current job openings and the skills of the labor force. That said, I still expect jobs will be added in reasonable numbers as we move through 2022. Given that Southwest Washington is a far smaller market, I’m not surprised that it has already recovered all the pandemic-induced job losses, and subsequently grown by an additional 4,000 jobs. Even though the pace of the job recovery in Oregon has been relatively muted, the unemployment rate continues to trend lower and now stands at 4.2%. While this is a decent number, it is still well above the pre-pandemic low of 3.4%. The jobless rate in Southwest Washington was a solid 3.5%.

oregon and southwest washington Home Sales

❱ During the final quarter of 2021, 17,862 homes sold, a drop of 3.6% compared to a year ago. This was mainly a result of a lack of homes for sale rather than an indication that the market is softening.

❱ Compared to the third quarter of 2021, all but four counties saw lower sales activity, which is likely due to seasonality changes in the market.

❱ Total sales were down from a year ago; however, several counties did report increases. Although most of these counties sold a relatively low number of homes, it was good to see that the drop was not across the entire region.

❱ Listing activity remains well below normal levels. Some of the drop in listings may be due to the rise of the Omicron variant of COVID-19.

A bar graph showing the annual change in home sales for counties in Oregon and Southwest Washington during the fourth quarter of 2021.

oregon and southwest washington Home Prices

A map showing the real estate market percentage changes in various counties in Oregon and Southwest Washington during the fourth quarter of 2021.

❱ Price growth continued the downward trend that started last summer but prices still rose by 14.6%, which is well above the long-term average.

❱ Compared to the third quarter of last year, 11 counties saw lower sale prices, which is likely due to seasonality changes in the market. The remaining 15 counties experienced price growth.

❱ All counties contained in this report had higher sale prices than a year ago, with very significant increases in Tillamook County. All but three counties showed double-digit appreciation.

❱ Mortgage rates in the quarter rose from 2.87% to 3.18%, which may also have contributed to the slowdown in the rapid pace of appreciation in the region.

A bar graph showing the annual change in home sale prices for various counties in Oregon and Southwest Washington during the fourth quarter in 2021.

Days on Market

❱ The average number of days it took to sell a home in the region dropped 13 days compared to the final quarter of 2020. It took 2 more days for a home to sell compared to the third quarter of the year.

❱ The average time it took to sell a home in the final quarter of 2021 was 33 days.

❱ All counties except one (Polk) saw the length of time it took to sell a home drop compared to a year ago. Market time in all but four counties increased compared to the third quarter of 2021.

❱ Homes again sold the fastest in Washington County, where it took an average of only 17 days for a home to go under contract. An additional 13 counties saw the average market time drop to below a month.

A bar graph showing the average days on market for home in various counties in Oregon and Southwest Washington during the fourth quarter of 2021.

Conclusions

A speedometer graph indicating a seller's market in Oregon and Southwest Washington during the fourth quarter of 2021.

This speedometer reflects the state of the region’s real estate market using housing inventory, price gains, home sales, interest rates, and larger economic factors.

Although Oregon’s job recovery has not been as robust as many would like, its impact on the housing market really has been minimal as demand remains strong and buyers continue to take advantage of historically low mortgage rates.

Strong demand—in concert with low levels of supply and favorable financing rates—has caused prices to rise at well-above average rates. In the coming year, I believe the pace of growth will slow in the face of rising mortgage rates, which I have forecasted will reach 3.7% by fourth quarter. In addition to this, many markets are experiencing affordability constraints, which could also slow the pace of price increases.

As we move into 2022, I still believe prices will continue to rise, but the significant increases we’ve experienced over the past two year are likely behind us. While home sellers still have the upper hand, I am moving the needle a little more toward the center. The spring buying season will be a good test for buyers and sellers alike and should give me more clarity as to what the year will hold.

About Matthew Gardner

Matthew Gardner - Chief Economist for Windermere Real Estate

As Chief Economist for Windermere Real Estate, Matthew Gardner is responsible for analyzing and interpreting economic data and its impact on the real estate market on both a local and national level. Matthew has over 30 years of professional experience both in the U.S. and U.K.

In addition to his day-to-day responsibilities, Matthew sits on the Washington State Governors Council of Economic Advisors; chairs the Board of Trustees at the Washington Center for Real Estate Research at the University of Washington; and is an Advisory Board Member at the Runstad Center for Real Estate Studies at the University of Washington where he also lectures in real estate economics.

Market News January 31, 2022

Q4 2021 Western Washington Real Estate Market Update

The following analysis of the Western Washington real estate market is provided by Windermere Real Estate Chief Economist Matthew Gardner. We hope that this information may assist you with making better-informed real estate decisions. For further information about the housing market in your area, please don’t hesitate to contact your Windermere Real Estate agent.


Regional Economic Overview

Just when we thought COVID was starting to pull back, the Omicron variant made its presence known. It is still too early to suggest that this has affected the region’s economic recovery—we won’t likely know for certain until we get more job data. I remain hopeful that this latest spike in infections will not have too much of an impact, but only time will tell. To date, the region has recovered all but 51,000 of the 297,000 jobs that were lost due to the pandemic. Some of the region’s smaller counties, including Grays Harbor, Cowlitz, Thurston, San Juan, and Clallam, have seen a full job recovery. The most recent data (November) shows the regional unemployment rate at a very respectable 3.3%, which is below the pre-pandemic low of 3.7%. The lowest unemployment rates were in King and San Juan Counties, where 2.9% of the labor force was out of work. The highest rate was in Grays Harbor County, which registered 5.1%. I still expect to see a full job recovery by this summer. However, there is a growing labor shortage holding the area back. Hopefully, this will change, but some industry sectors—especially hospitality—continue to find it hard to attract workers.

western washington Home Sales

❱ In the final quarter of the year, 22,161 homes sold, representing a drop of 5.2% compared to the same period in 2020 and down 18.8% from the third quarter.

❱ The reason there were lower year-over-year sales is simply because the number of homes for sale was down more than 30%. The drop between third and fourth quarters is likely due to seasonality changes in the market.

❱ Although home sales were lower in most markets, there was a significant uptick in Grays Harbor and Thurston counties. The number of homes sold dropped across the board compared to the third quarter.

❱ The ratio of pending sales (demand) to active listings (supply) showed sales outpacing listings by a factor of 5.2. The market is supply starved and unfortunately, it’s unlikely enough homes will be listed this spring to satisfy demand.

A bar graph showing the annual change in home sales for various counties in Western Washington during the fourth quarter of 2021.

western washington Home Prices

A map showing the real estate market percentage changes in various counties in Western Washington during the fourth quarter of 2021.

❱ Home prices rose 15.1% compared to a year ago, with an average sale price of $711,008. This was 2.1% lower than in the third quarter of 2021.

❱ When compared to the same period a year ago, price growth was strongest in San Juan and Jefferson counties. All but two markets saw prices rise more than 10% from a year ago.

❱ Relative to the third quarter, every county except Island (-8.6%), Mason (-5.2%), Lewis (-2.9%), King (-2.1%), Cowlitz (-1.7%), and Kitsap (-0.9%) saw sale prices rise.

❱ Mortgage rates rose more than .2% between the third and fourth quarters, which may have impacted prices. Affordability constraints continue to grow, which is also likely to have played a part in slowing gains.

A bar graph showing the annual change in home sale prices for various counties in Western Washington during the fourth quarter of 2021.

Days on Market

❱ It took an average of 23 days for homes to sell in the final quarter of 2021. This was 8 fewer days than in the same quarter of 2020, but 6 more days than in the third quarter of last year.

❱ Snohomish, Thurston, King, and Kitsap counties were the tightest markets in Western Washington, with homes taking an average of between 13 and 16 days to sell. The greatest drop in market time compared to a year ago was in San Juan County, where it took 33 fewer days for a seller to find a buyer.

❱ All counties contained in this report saw the average time on market drop from the same period a year ago. Every county except Whatcom saw market time rise compared to the third quarter.

❱ Longer days on market might suggest that things are starting to slow, but I don’t actually think this is the case. I believe buyers are being a little more selective before making offers, and many may be waiting in the hope that supply levels will improve in the spring.

A bar graph showing the average days on market for homes in various counties in Western Washington during the fourth quarter of 2021.

Conclusions

A speedometer graph indicating a seller's market in Western Washington during the fourth quarter of 2021.

This speedometer reflects the state of the region’s real estate market using housing inventory, price gains, home sales, interest rates, and larger economic factors.

The housing market remains in a state of imbalance, but, as I look at the data, I believe the frenetic pace of sales and price appreciation may start to soften in 2022.

This will likely be due to financing costs and affordability acting as headwinds to price growth. Mortgage rates have started to rise again, and I have forecasted them to reach 3.7% by fourth quarter. This alone will slow price growth as affordability in many areas declines.

One thing that remains unknown that could have a significant impact on the market is long-term work-from-home policies. Many businesses have not yet determined their plans for remote working, but once they do, potential home buyers who have been waiting to see how frequently they have to commute to work could immediately start their search. In addition to boosting sales, this could add inventory to the market as well.

All things considered, I am moving the needle just a notch toward buyers. However, as you can see, we are still in a market that heavily favors home sellers.

About Matthew Gardner

Matthew Gardner - Chief Economist for Windermere Real Estate

As Chief Economist for Windermere Real Estate, Matthew Gardner is responsible for analyzing and interpreting economic data and its impact on the real estate market on both a local and national level. Matthew has over 30 years of professional experience both in the U.S. and U.K.

In addition to his day-to-day responsibilities, Matthew sits on the Washington State Governors Council of Economic Advisors; chairs the Board of Trustees at the Washington Center for Real Estate Research at the University of Washington; and is an Advisory Board Member at the Runstad Center for Real Estate Studies at the University of Washington where he also lectures in real estate economics.

More January 27, 2022

Windermere Real Estate Celebrates 50th Anniversary


In honor of our 50th anniversary, Windermere set a goal to reach $50 million in giving and officially announced our third generation of leadership during our 2022 Kick-Off event. 


Seattle – On Wednesday, January 26, we hosted a virtual event for our agents, franchise owners, and staff, to kick off 2022 and celebrate our 50th anniversary. More than 4,400 people attended the virtual event to hear from several speakers, including company founder, John Jacobi, Windermere Chief Economist, Matthew Gardner, and keynote speakers Matthew Ferrara and Candace Doby. Second-generation leaders, OB Jacobi, Jill Jacobi Wood, and Geoff Wood kicked off the event by reflecting on Windermere’s 50-year history and the pride that comes from still being a family-run organization. They also introduced Lucy Wood, daughter of Jill and Geoff, and the third generation to take on a leadership role within our company.

Founded in 1972 by John Jacobi, Windermere started with seven agents in a single office in Seattle, WA. Over the next two decades, Jacobi would grow Windermere into Seattle’s largest real estate brokerage and eventually the largest in the Pacific Northwest. But according to son, OB, his dad never had aspirations of becoming a large company. “My dad’s goal was to build a real estate office where the agents were respected on the same level as other business professionals, so he made it a priority to hire people who were above all else, professional,” said OB Jacobi, adding, “It was because of the quality of the people who joined Windermere that the company began to grow and thrive.”

Fifty years later, Windermere is the largest regional real estate company in the Western U.S. with over 6,500 agents and 300+ offices in 10 states. Last year we exceeded $43 billion in sales.

During the January 26 event, the second-generation leaders talked about how their dad set out to change the real estate industry. According to son, OB Jacobi, his dad didn’t believe in awards and felt the highest achievement an agent could earn is repeat and referral business from their clients. He also thought it was the responsibility of real estate agents to make their communities a better place to live, and in 1989, through the creation of the Windermere Foundation, pioneered a giving model that is now used by real estate companies around the country.

“My dad and his team came up with an idea that would make it really easy for agents to give back,” said Jill Jacobi Wood. “It was simple but sort of ingenious; every time an agent sold a home, a small donation from their commission would automatically be made to the Windermere Foundation. All that the agents had to do was sign up to donate and we handled the rest.”

Jacobi Wood added that the goal was to create a system that would allow Windermere to make a big difference without being a financial burden on any one person. In its first year (1989), the Windermere Foundation raised $90,000 for low-income and homeless families. In 2021, our network collectively raised over $2.5 million for a total of $46 million in donations. In honor of our 50th anniversary, the Windermere network has been given a new challenge: to reach $50 million in donations by the end of 2022.  

Windermere CEO, Geoff Wood, closed the 50th anniversary event by saying, “Great companies don’t stagnate or stay the same. They are constantly evolving and looking for ways to improve, grow, and give back. Over the past 50 years we have done just that; here’s to 50 more.”