
 Facebook
 X
X
 Pinterest
 Copy Link

The following analysis of the Central Washington real estate market is provided by Windermere Real Estate Chief Economist Matthew Gardner. We hope that this information may assist you with making better-informed real estate decisions. For further information about the housing market in your area, please don’t hesitate to contact your Windermere Real Estate agent.
Regional Economic Overview
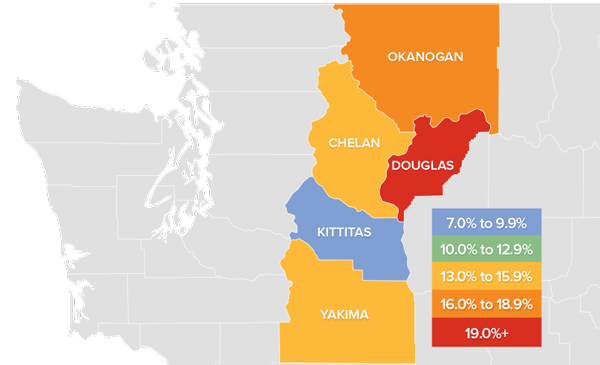
Central Washington employment rose 7.7% compared to a year ago, and employment levels remain well above the pre-pandemic peak. Across the five counties that make up this report, total employment is now around 4,000 more than before the pandemic. A significant number of jobs were lost in November, which gives me pause. Data for the region is not adjusted for seasonality, which may have played a part in the contraction, but we will have to wait until the spring to see if this was an anomaly or whether a pattern has emerged. Even with the slowdown, the unemployment rate was 4.4%, which is still a decent number. The lowest jobless rate was in Kittitas County at 3.6%. The highest rate was in Yakima County, where 4.9% of the labor force was unemployed.
central washington Home Sales
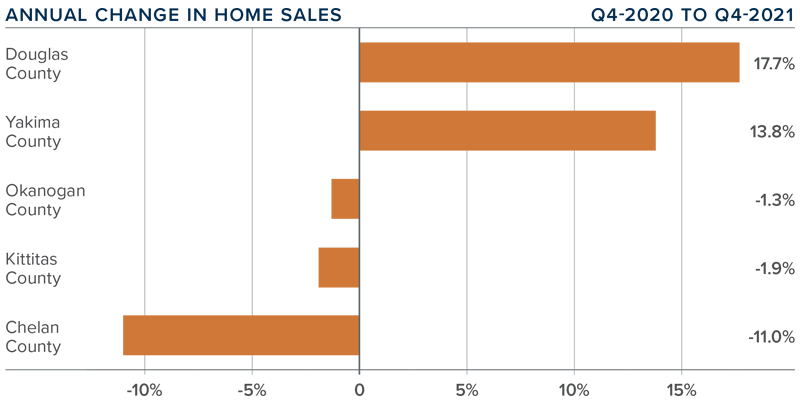
❱ Sales in Central Washington rose 3.9% versus a year ago, with 1,599 homes trading hands. Sales fell 2.1% compared to the third quarter of 2021, but seasonal factors likely impacted the number.
❱ Pending sales fell 19.7% compared to the third quarter, suggesting that closings in the first quarter of the year may not show much improvement.
❱ Compared to a year ago, sales rose in Douglas and Yakima counties but fell in all other markets covered by this report. Compared to the third quarter of last year, sales fell in every county other than Okanogan, which registered an impressive 22% increase.
❱ I was pleased to see inventory levels rise 16.9% year over year, but they were down 20.9% compared to the third quarter of 2021. This likely contributed to the drop in pending sales.
central washington Home Prices
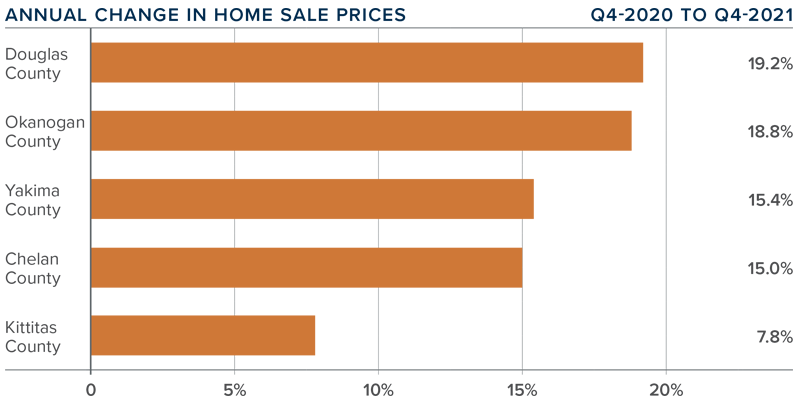
❱ The average home price in Central Washington rose 11.1% year over year to $489,443 and was .4% higher than in the third quarter of the year.
❱ While home prices in the area continue to rise, we are starting to see the pace of growth slow. This is likely because mortgage rates rose .3% during the quarter. I anticipate that rates will continue to climb as we move through 2022. This will act as a headwind to the rampant pace of price growth that we have seen for the past few years.
❱ Every county except Kittitas saw double-digit increases in sale prices. Chelan and Kittitas counties showed higher sale prices than in the third quarter.
❱ All counties other than Yakima are now technically unaffordable for a household making median income, and no market is affordable for a first-time buyer. This is also likely to have a slowing effect on price growth in 2022.
Days on Market
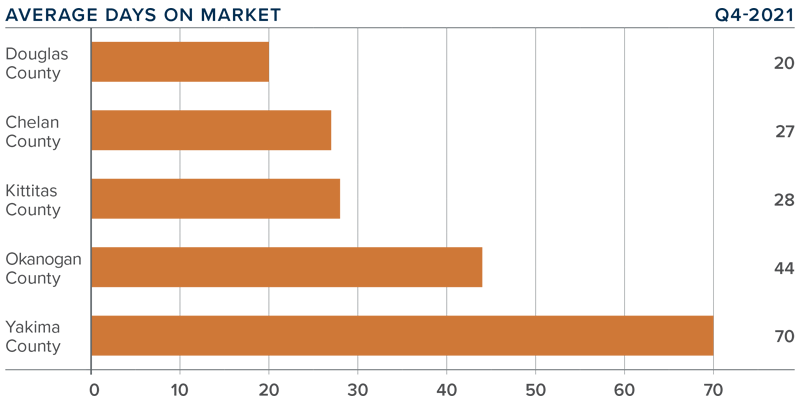
❱ The average time it took to sell a home in Central Washington in the final quarter of 2021 was 38 days.
❱ During the quarter, it took 11 fewer days to sell a home in Central Washington than it did a year ago.
❱ All counties other than Yakima saw the length of time it took to sell a home drop compared to a year ago, with noticeable improvements in Chelan and Okanogan counties. Compared to the third quarter, market time rose in all areas, but seasonal changes were likely the cause.
❱ It took seven more days to sell a home in the fourth quarter than it did in the third.
Conclusions
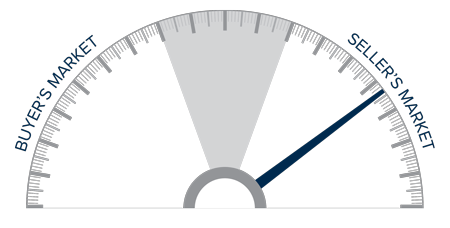
This speedometer reflects the state of the region’s real estate market using housing inventory, price gains, home sales, interest rates, and larger economic factors.
Due to seasonal changes, it is always hard to get a clear picture of the market from the winter sales numbers. However, it does appear as if the market may be coming off the frenetic pace of price growth that we’ve seen over the past two years. Inventory levels were higher, which, in concert with rising mortgage rates, may have slowed price appreciation—albeit modestly—in the quarter.
As mentioned previously, I anticipate that mortgage rates will continue to move higher through 2022. Combined with low levels of affordability in the area, this is likely to further slow home price growth.
As such, I am moving the needle a little more toward buyers. However, owners looking to sell a well-positioned and appropriately priced home are unlikely to have much of a problem finding a buyer.
About Matthew Gardner

As Chief Economist for Windermere Real Estate, Matthew Gardner is responsible for analyzing and interpreting economic data and its impact on the real estate market on both a local and national level. Matthew has over 30 years of professional experience both in the U.S. and U.K.
In addition to his day-to-day responsibilities, Matthew sits on the Washington State Governors Council of Economic Advisors; chairs the Board of Trustees at the Washington Center for Real Estate Research at the University of Washington; and is an Advisory Board Member at the Runstad Center for Real Estate Studies at the University of Washington where he also lectures in real estate economics.
")


