
 Facebook
 X
X
 Pinterest
 Copy Link

The following analysis of select Montana real estate markets is provided by Windermere Real Estate Chief Economist Matthew Gardner. We hope that this information may assist you with making better-informed real estate decisions. For further information about the housing market in your area, please don’t hesitate to contact your Windermere Real Estate agent.
Regional Economic Overview
Jobs continue to return to Montana. The latest data shows the state needs only 3,700 more jobs to reach its pre-pandemic peak. As I have mentioned in past reports, the pace of the job recovery has been slowing—particularly in the Great Falls and Missoula metro areas—but this has been offset by growth in Billings and other parts of the state. The latest unemployment numbers showed only 2.8% of the workforce out of work, which is significantly better than the country as a whole. In the metro areas contained in this report, the lowest jobless rate was in Billings at 1.8%, followed by Great Falls at 1.9%, and Missoula at 2%. I still anticipate a full job recovery but, when placed alongside extremely low unemployment rates, the recent slowdown suggests that a lack of workers is the biggest hurdle for employers. I anticipate a return to pre-pandemic employment levels toward the end of 2022.
montana Home Sales
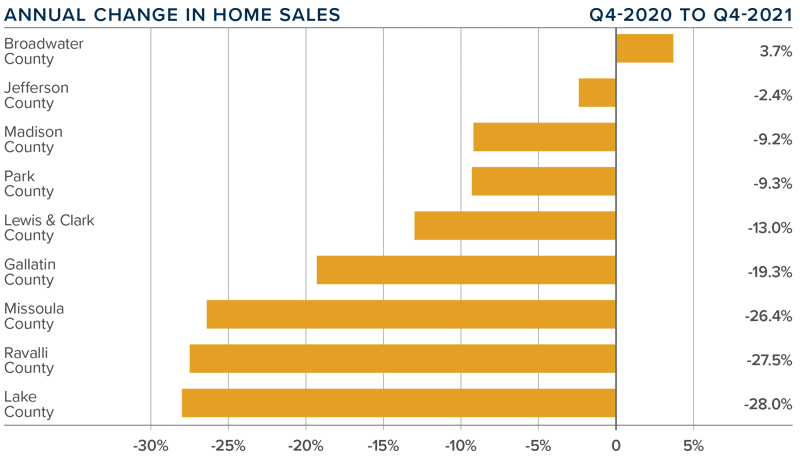
❱ In the final quarter of 2021, 1,479 homes sold in the markets contained in this report, which is 17.6% below the level a year ago and 14.1% lower than the previous quarter.
❱ Sales did manage to rise in Broadwater County, but it was only by one unit. Compared to the third quarter, sales were lower in every county other than Lake.
❱ Lower quarter-over-quarter sales are not surprising given seasonal factors. The drop in sales compared to a year ago is likely due to low inventory levels, which were down 47%.
❱ Year-over-year, listings were down between 30% and 82% in the counties contained in this report. Buyers are still looking, but if there isn’t a significant increase in the number of homes coming to market in the spring, things will remain very competitive for buyers.
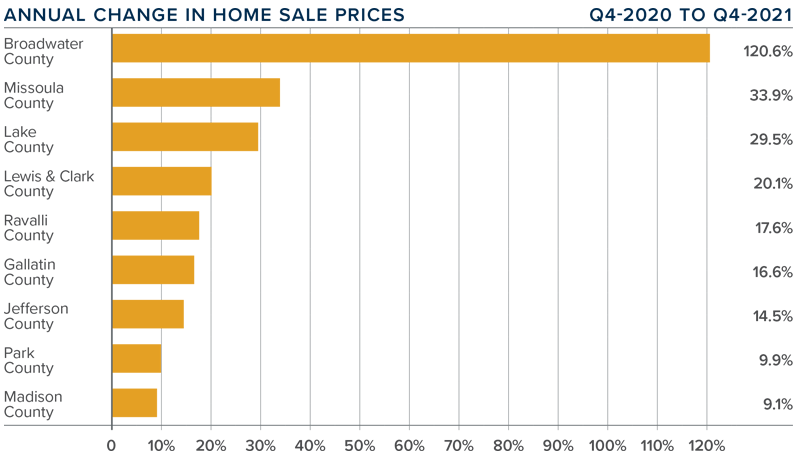
montana Home Prices
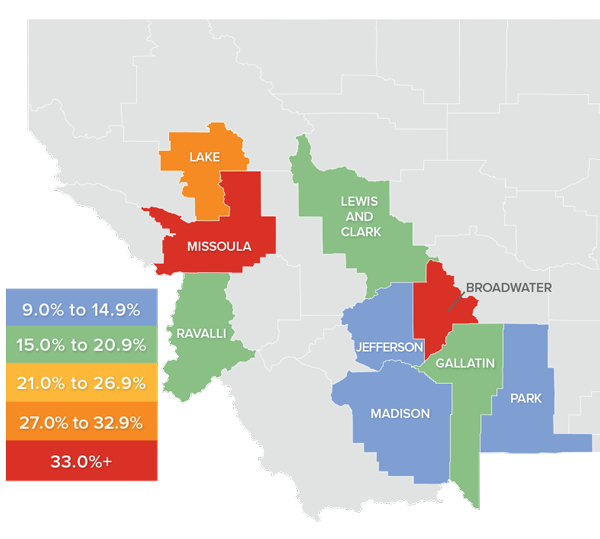
❱ With the supply limitations discussed above, it’s hardly surprising to see prices rise 17% year over year to an average of $721,634. Prices were also 8.3% higher than in the third quarter of 2021.
❱ When compared to the third quarter of 2021, home sale prices were lower in Ravalli, Lewis and Clark, Broadwater, and Jefferson counties, but rose in the remaining markets.
❱ Average home sale prices rose by double digits in all but two of the counties contained in this report. Broadwater County saw prices more than double.
❱ Mortgage rates trended higher in the final quarter of the year, which I expect to continue as we move through 2022. This should act as a headwind to home price growth, but my current forecast suggests that prices will continue to rise by an average of 15% in 2022.
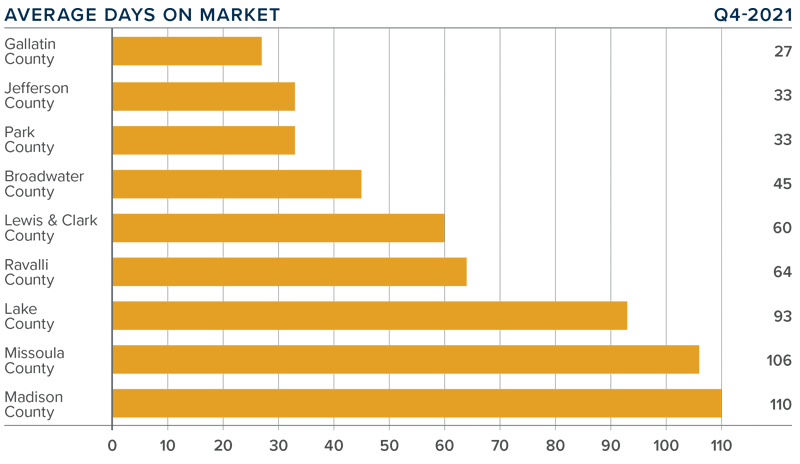
Days on Market
❱ The average time it took to sell a home in fourth quarter dropped by seven days compared to the previous year.
❱ Homes sold fastest in Gallatin County and slowest in Madison County. Days on market dropped in Ravalli, Lake, Lewis and Clark, and Jefferson counties, but rose in the balance of the counties contained in this report.
❱ It took an average of 64 days to sell a home in the region during fourth quarter.
❱ Relative to the third quarter of 2021, market time dropped in Ravalli, Broadwater, and Jefferson counties, but rose in all other markets.
Conclusions

This speedometer reflects the state of the region’s real estate market using housing inventory, price gains, home sales, interest rates, and larger economic factors.
The job recovery in Montana continues and, at this point, is only limited by the number of available workers. In addition, according to the Montana Secretary of State, a record number of new businesses were registered in 2021. With a growing economy, it’s no surprise that there is a strong demand for housing. Even as mortgage rates continue to rise, there are clearly more buyers than sellers, which sets the stage for home prices to rise at well-above average rates.
As mentioned earlier, I would not be surprised if prices rose by an average of 15% this year as supply and demand remain out of balance. Given all these factors, I have decided to move the needle further toward home sellers.
About Matthew Gardner

As Chief Economist for Windermere Real Estate, Matthew Gardner is responsible for analyzing and interpreting economic data and its impact on the real estate market on both a local and national level. Matthew has over 30 years of professional experience both in the U.S. and U.K.
In addition to his day-to-day responsibilities, Matthew sits on the Washington State Governors Council of Economic Advisors; chairs the Board of Trustees at the Washington Center for Real Estate Research at the University of Washington; and is an Advisory Board Member at the Runstad Center for Real Estate Studies at the University of Washington where he also lectures in real estate economics.
")


