
 Facebook
 X
X
 Pinterest
 Copy Link

The following analysis of the Southern California real estate market is provided by Windermere Real Estate Chief Economist Matthew Gardner. We hope that this information may assist you with making better-informed real estate decisions. For further information about the housing market in your area, please don’t hesitate to contact your Windermere Real Estate agent.
Regional Economic Overview
Following significant job gains in the summer months, the fall continued to show an economy in recovery. As of the most recent data (November), the southern California region had added more than 212,000 jobs, which is very notable as it exceeds the growth in the previous quarter (and we still have to add the December numbers). So far, the market has recovered more than 1.66 million of the 2.02 million jobs that were lost during the pandemic, and we need only 347,000 more to get back to where we were before the pandemic hit. The region’s unemployment rate in November was 5.9% and has been trending lower since June 2021. All the markets contained in this report saw unemployment numbers drop. The lowest jobless rates were again in Orange County (4.1%) and San Diego County (4.6%). The highest rate was again in Los Angeles County, where it was 7.1%. The fall was a solid season for the regional job market, and I hope this trend continues. Of course, the latest iteration of COVID-19 arrived in December and any impacts to the economy—and specifically the job market—were not reflected in the most recent data. I hope it won’t significantly slow the job recovery, as the region is now on pace to get back to its pre-COVID employment level by this summer.
southern california Home Sales
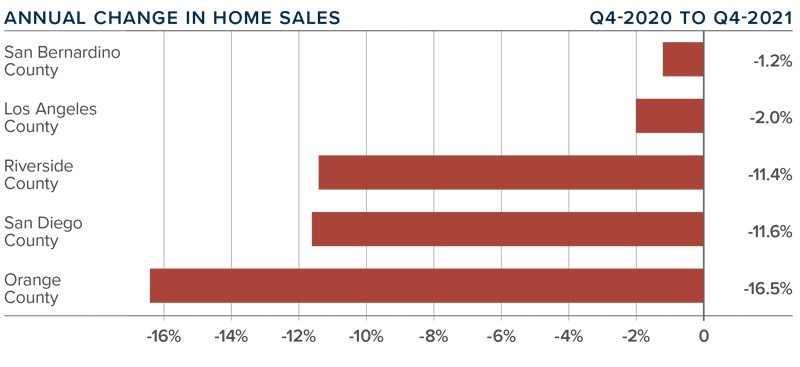
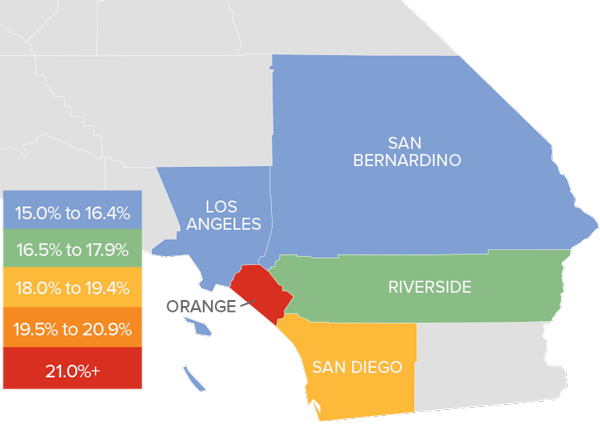
❱ In the final quarter of the year, 46,517 homes sold, which was down 7.6% from a year ago and 7.5% lower than in the third quarter of the year.
❱ Pending home sales, which are an indicator of future closings, were 17.3% lower than the third quarter, suggesting that sales activity in the early spring may also be lackluster.
❱ Year-over-year, sales fell in all markets; this was also the case compared to the third quarter. Although this may seem disconcerting, much of the blame can be placed on the lack of homes for sale. Inventory was down 33.5% compared to a year ago and 26.3% lower than in the third quarter.
❱ Supply constraints continue to limit sales activity. The issue is not demand, rather it’s a lack of homes for sale that’s holding the market back. Although I expect to see the number of home sales pick up, it is unlikely the region will see total transactions in 2022 exceed 2021 numbers.
southern california Home Prices
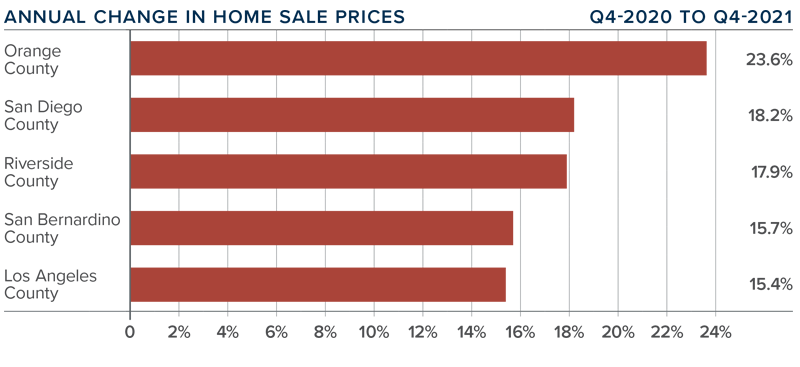
❱ The average home sale price in the region was $982,272, which is 17.8% higher than a year ago and 1.1% higher than in the third quarter.
❱ Average mortgage rates rose by almost a quarter point between the third and fourth quarters, but this has yet to slow down price growth. As we move through 2022, I expect rates to continue to stairstep higher. Although rates will likely end the year at close to 4%, the question is whether this level is high enough to slow price growth.
❱ The region saw double-digit price growth across the board. The fastest growth was in Orange County where prices were up 6.3% compared to the previous quarter.
❱ Rising financing costs—combined with more businesses clarifying their work-from-home policies—may result in more home buyer activity. However, if inventory levels do not rise significantly, the market will remain out of balance, which could lead price growth to continue to trend above the long-term average.
Days on Market
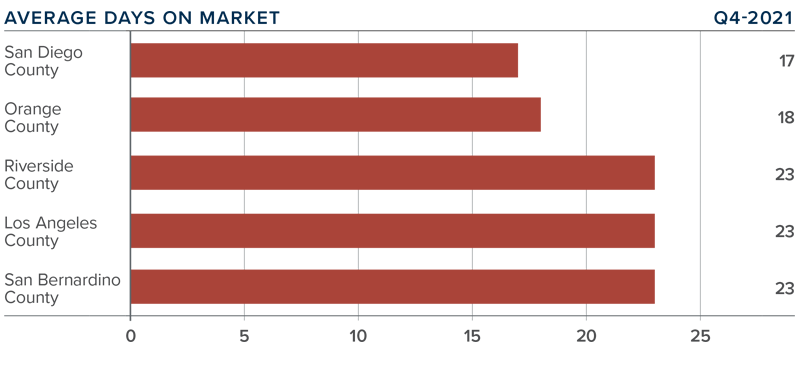
❱ In the final quarter of 2021, the average time it took to sell a home in the region was 21 days, which was 6 fewer days than a year ago but 4 days more than in the third quarter.
❱ The other three counties also saw the time it took to for a seller to find a buyer drop compared to a year ago, but market time rose across the board compared to the third quarter of 2021.
❱ Homes in San Diego County continue to sell at a faster rate than other markets in the region. In the fourth quarter, it took an average of 17 days to sell a home there—2 fewer days than it took a year ago.
❱ Longer days on market may be due to the significant increase in list prices during the quarter in all markets other than Riverside County. Low supply levels have allowed sellers to dictate pricing, but longer market time and fewer transactions could indicate that buyers may be starting to push back.
Conclusions
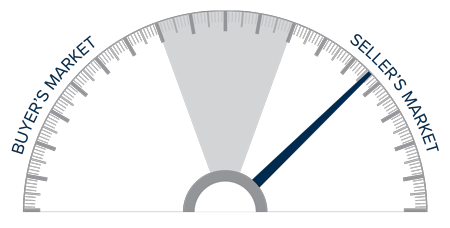
This speedometer reflects the state of the region’s real estate market using housing inventory, price gains, home sales, interest rates, and larger economic factors.
Jobs continue to return in the region and the housing market remains remarkably tight. As mentioned previously, sellers have been raising prices significantly, but lower sales and longer market time suggest to me that buyers are becoming more selective in the homes they decide to make an offer on. I do not see supply levels increasing significantly, at least not to the degree that matches demand. However, affordability levels continue to drop, which, in concert with rising mortgage rates, may start to slow price growth even as the number of listings remains below the norm.
Considering these factors, I have decided to leave the needle in the same position as the previous quarter. Although it appears that the market may be starting to shift slowly back to balance, I want to see how the spring market performs before I consider moving the needle towards buyers.
About Matthew Gardner

As Chief Economist for Windermere Real Estate, Matthew Gardner is responsible for analyzing and interpreting economic data and its impact on the real estate market on both a local and national level. Matthew has over 30 years of professional experience both in the U.S. and U.K.
In addition to his day-to-day responsibilities, Matthew sits on the Washington State Governors Council of Economic Advisors; chairs the Board of Trustees at the Washington Center for Real Estate Research at the University of Washington; and is an Advisory Board Member at the Runstad Center for Real Estate Studies at the University of Washington where he also lectures in real estate economics.
")


