
 Facebook
 X
X
 Pinterest
 Copy Link

ECONOMIC OVERVIEW
Though Washington State’s economy has been expanding at a rapid pace, we are seeing a slowdown as the state gets closer to full employment. Given the strong economy, I expect income growth to move markedly higher in the second half of the year. I also expect the state to add around 70,000 jobs by the end of 2017.
Like much of the rest of the state, Central Washington continues to experience modest employment growth. An additional 1,300 jobs were created between May
2016 and May 2017, which drove the unemployment rate lower (from 6.3% to 5.4%). I believe we will see continued growth in employment, leading to further declines in the unemployment rate through the duration of 2017.
HOME SALES ACTIVITY
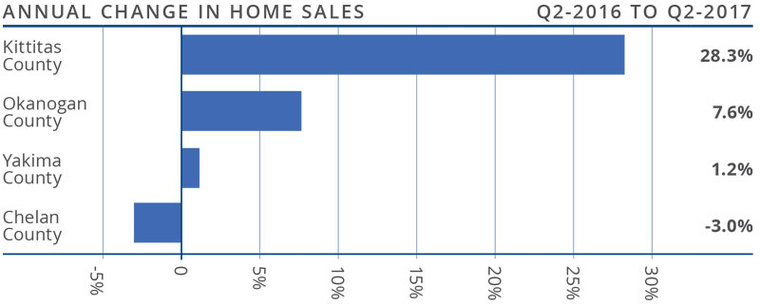
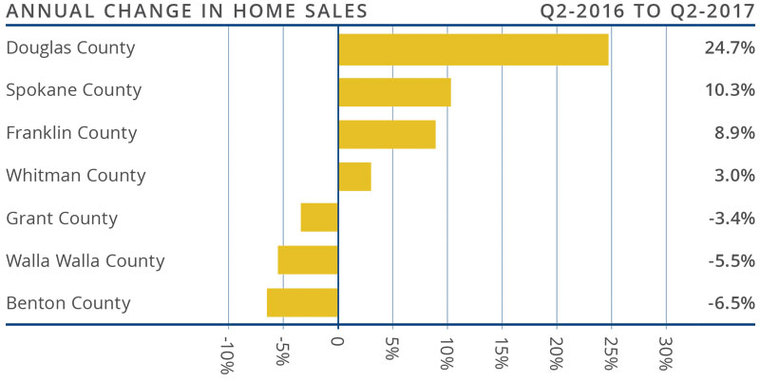
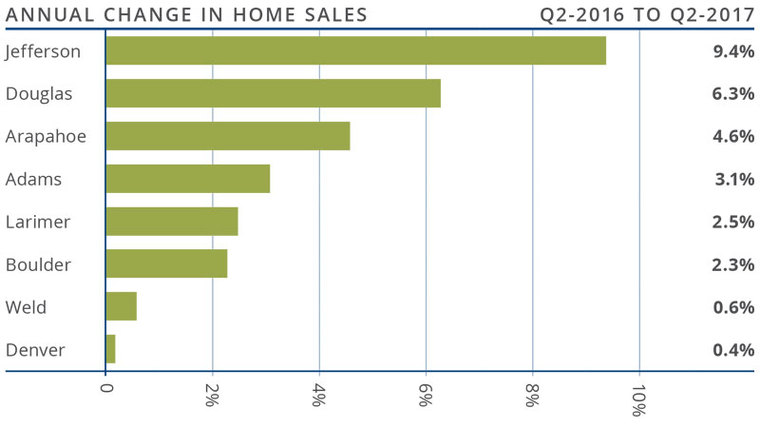
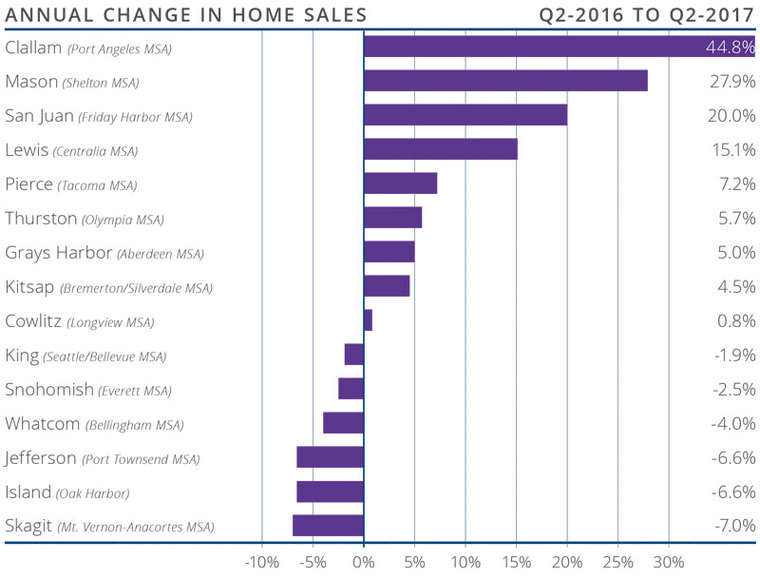
- Home sales throughout Central Washington were mixed in the second quarter. Sales rose in three markets but dropped in one when compared to the second quarter of 2016. In total, there were 1,169 home sales in the quarter— an increase of 6.3% over the same period in 2016.
- Sales rose at the fastest rate in Kittitas County, which had an impressive 28.3% increase over the second quarter of 2016. That said, the market is a small one, so sales activity can fluctuate quite dramatically.
- The number of pending home sales— an indicator of future closings—was up across the board. As such, I expect to see regional home sales continue to rise as we move through the rest of the summer.
- The number of homes for sale in the quarter was down 14.2% compared to the second quarter of last year. The market is clearly starved of inventory, which continues to push home prices higher.
HOME PRICES
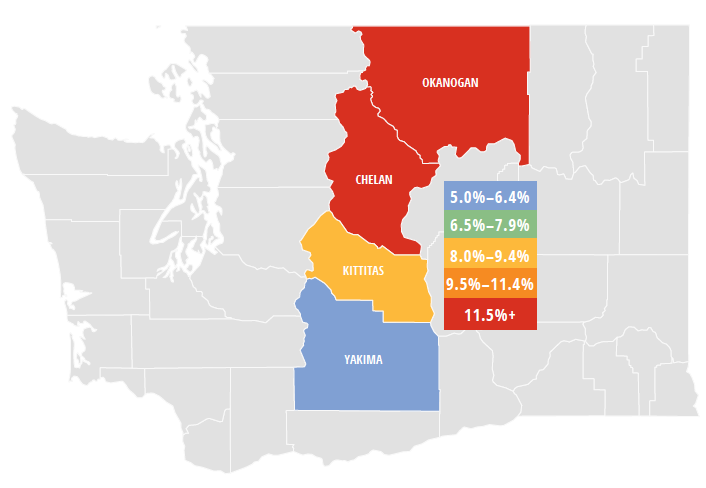
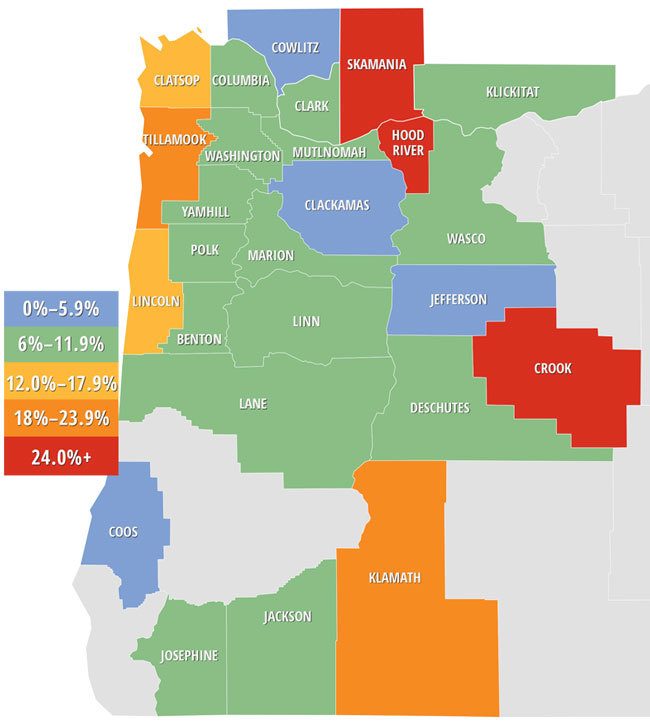
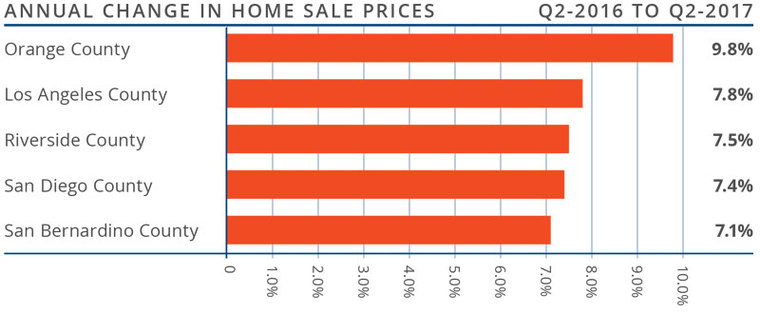
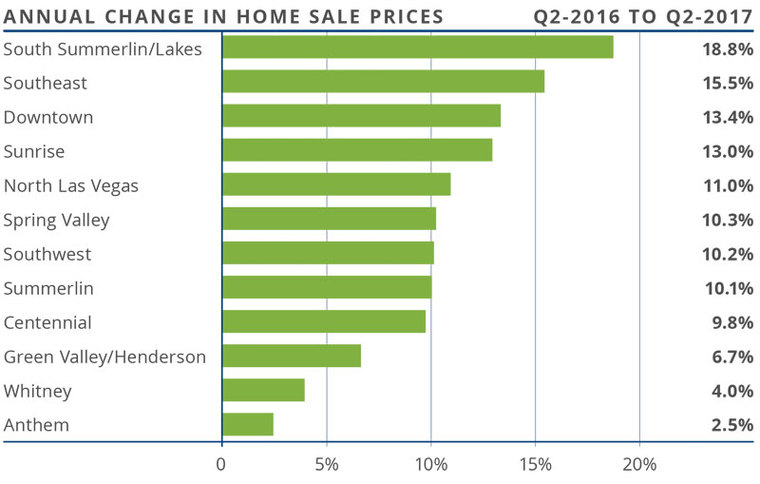
![]() Year-over-year, the average home price in the region rose by 9.1% to $275,979. Price growth remains robust as demand exceeds supply.
Year-over-year, the average home price in the region rose by 9.1% to $275,979. Price growth remains robust as demand exceeds supply.- Yakima and Kittitas Counties saw relatively modest price increases. The other two counties in this market reported double-digit gains.
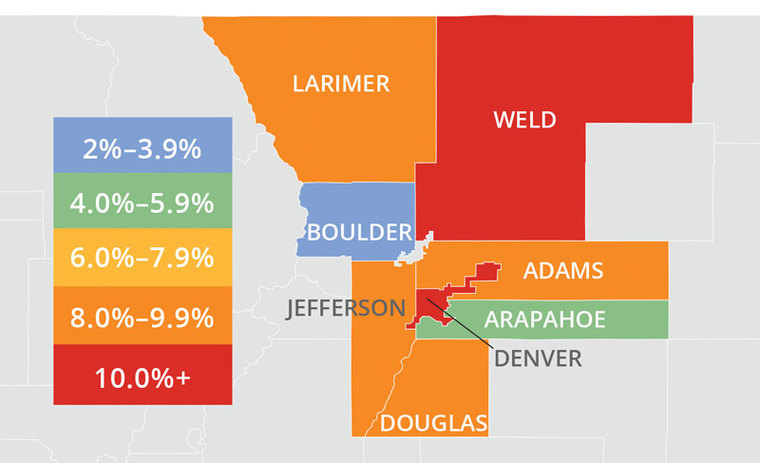
- All counties in this report saw prices rise compared to the second quarter of 2016. Okanogan County led the way with an increase of 12.6%.
- Home prices continue to grow at above average rates due to very limited supply, but I expect the rate of appreciation to start tapering later this year or in early 2018.
 Year-over-year, the average home price in the region rose by 9.1% to $275,979. Price growth remains robust as demand exceeds supply.
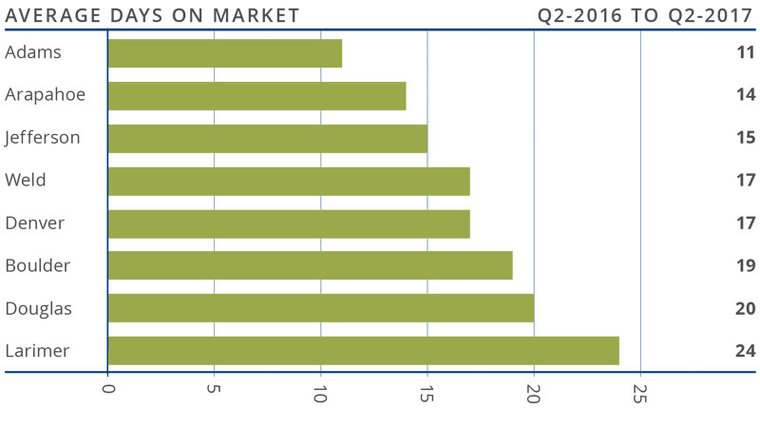
DAYS ON MARKET
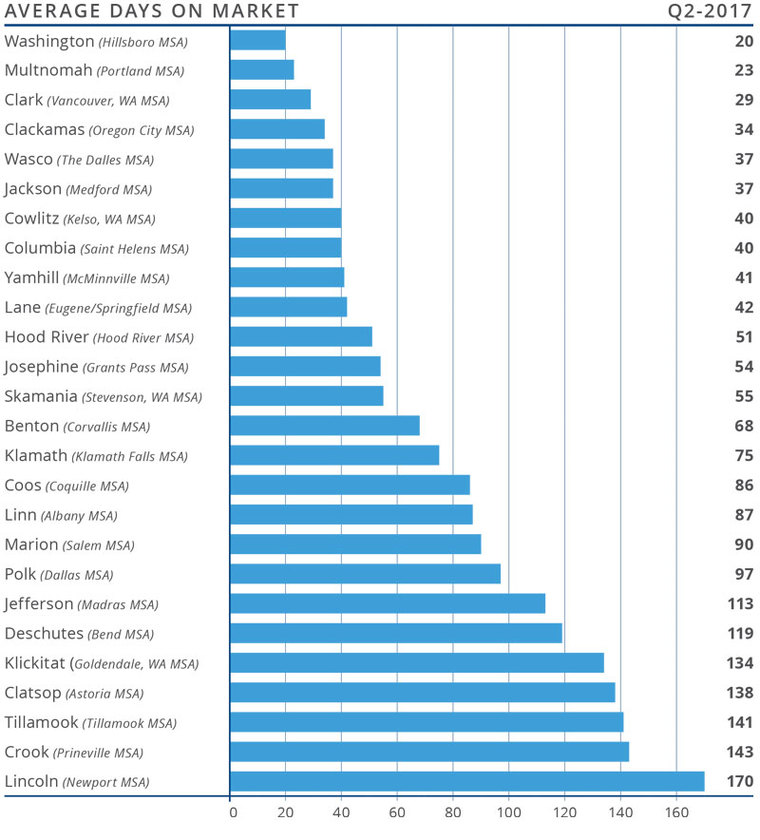
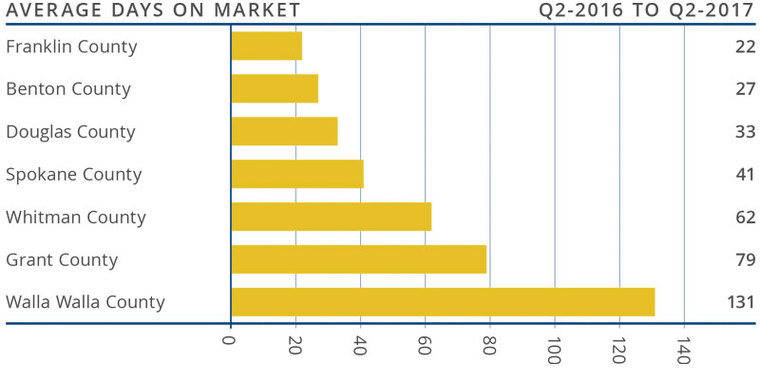
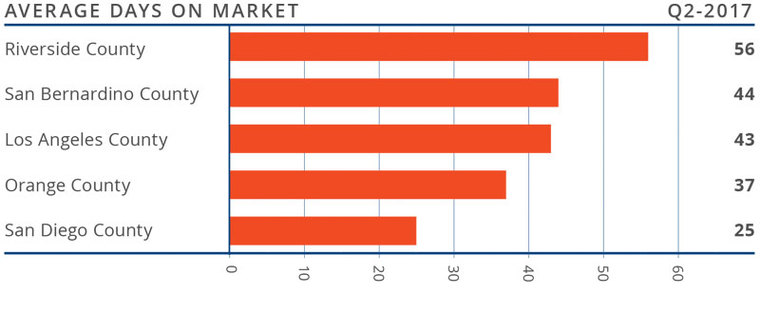
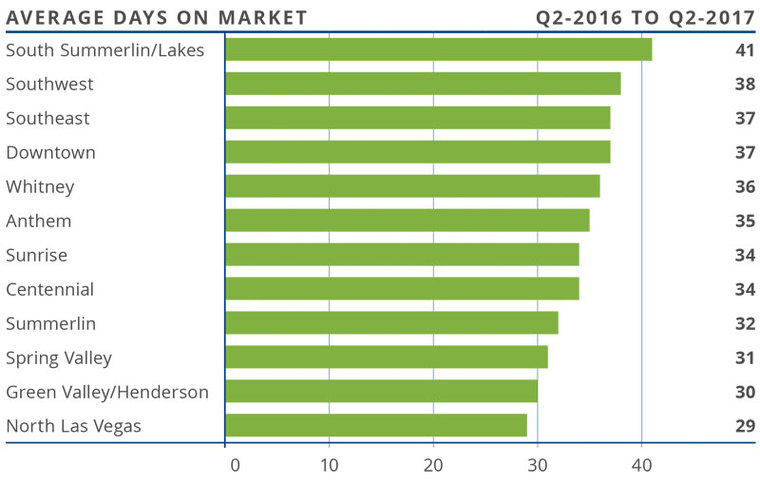
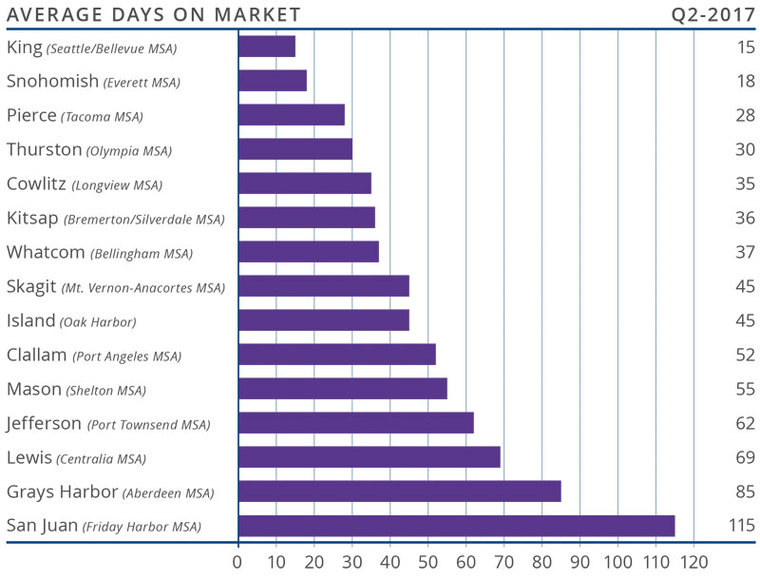
- Across this market, the average number of days it took to sell a home dropped by 25 days when compared to the second quarter of 2016.
- The average time it took to sell a home in the region was 98 days.
- All markets contained in this report saw the time it took to sell a home drop from the same quarter in 2016.
- Homes sold the fastest in Kittitas County, where it took an average of 49 days, which is 32 fewer days than it took to sell a home in the second quarter of last year.

CONCLUSIONS
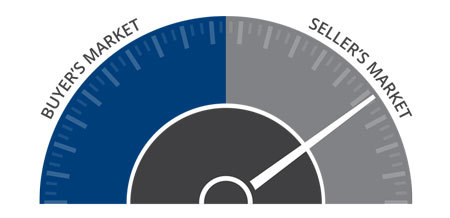
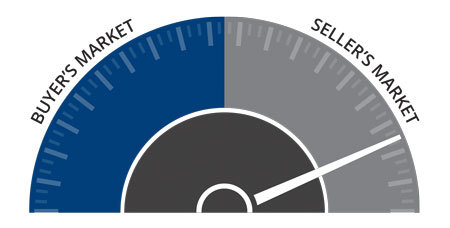
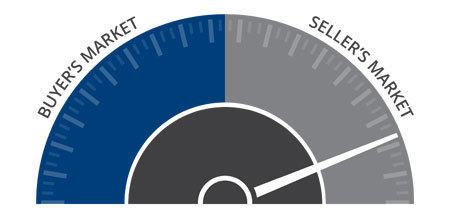
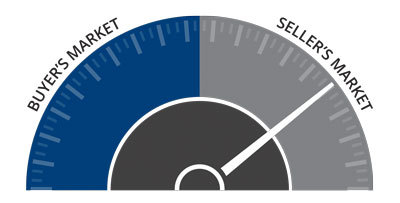
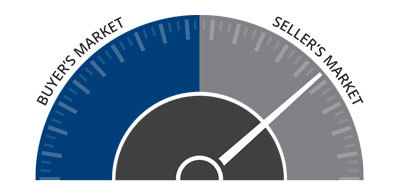
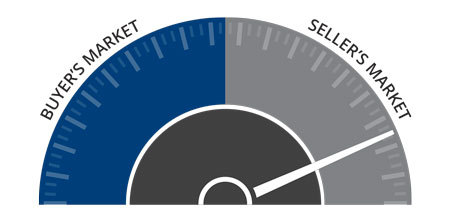
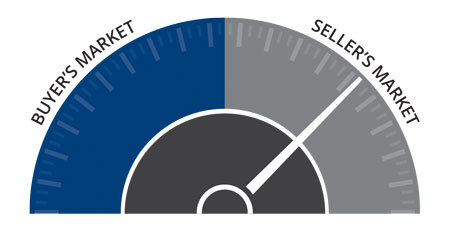 This speedometer reflects the state of the region’s housing market using housing inventory, price gains, home sales, interest rates, and larger economic factors. For the second quarter of 2017, the needle is well into sellers’ territory. Prices in several markets are still trending above average and inventory issues remain.
I anticipate that 2017 will continue favoring sellers and demand will continue to exceed supply.
 Matthew Gardner is the Chief Economist for Windermere Real Estate, specializing in residential market analysis, commercial/industrial market analysis, financial analysis, and land use and regional economics. He is the former Principal of Gardner Economics, and has over 25 years of professional experience both in the U.S. and U.K.
If you are in the market to buy or sell, we can connect you with an experienced agent here.

 The average home price in the region rose 7.8% year-over-year to $362,845. This is down from 9.4% in the first quarter of 2017.
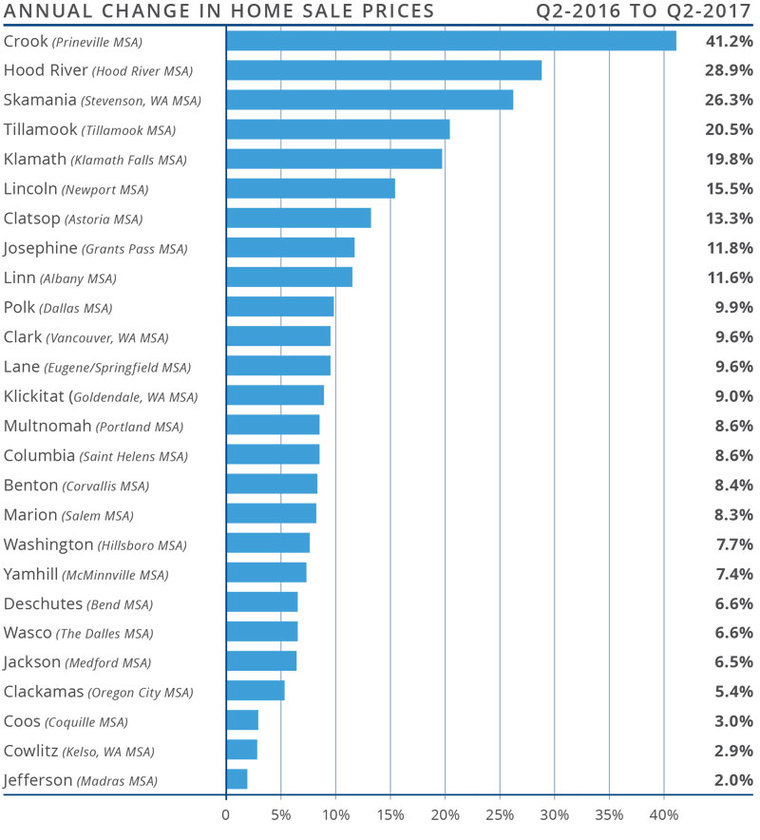
 The speedometer reflects the state of the region’s housing market using housing inventory, price gains, home sales, interest rates, and larger economic factors. Housing markets throughout Oregon continue to benefit greatly from the robust regional economy. Even as home sales have slowed in some counties, the market is remarkably tight and will likely remain that way for the balance of the year. As such, I have moved the needle slightly more toward sellers for the second quarter.
 Year-over-year, the average home price in the region rose by 6.2% to $242,059. Price growth has been tapering across the region, but several counties are still seeing appreciation well above the average rate.
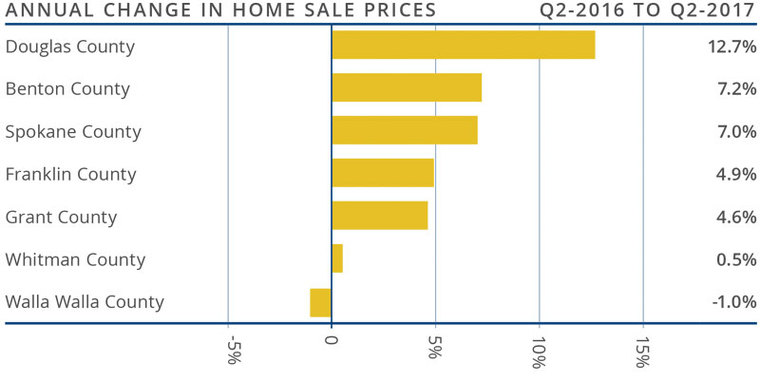
 This speedometer reflects the state of the region’s housing market using housing inventory, price gains, home sales, interest rates, and larger economic factors. For the second quarter of 2017, I left the needle at the same level. Though prices in several markets are still trending above average, the rate of growth has slowed a little. I still believe that 2017 will continue favoring sellers and, even with a slowdown in price appreciation, demand will continue to exceed supply.


 Due to solid demand, home prices continue to rise with average prices up by 8.5% year-over-year to an average across the region of $438,980.
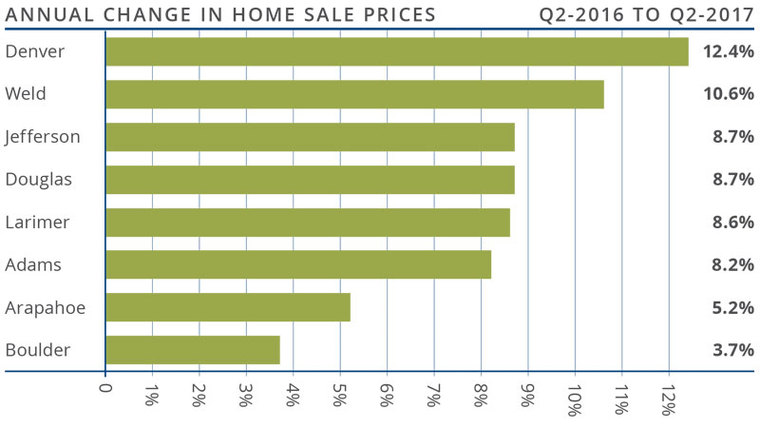
 This speedometer reflects the state of the region’s housing market using housing inventory, price gains, home sales, interest rates, and larger economic factors.
 There were 54,516 home sales in the second quarter of this year. This was only 1.8% higher than the same period in 2016, but 34.4% above the level seen in the first quarter of this year.
 The speedometer reflects the state of the region’s housing market using housing inventory, price gains, home sales, interest rates, and larger economic factors.
 Employment growth in the Las Vegas metropolitan area slowed down—albeit very modestly—as the market entered the summer, with an annual employment growth of 2.9%. That said, the market has added 27,300 new jobs over the past 12 months. With this growth in employment, the unemployment rate remained at 4.8%, which is marginally above the statewide level of 4.7%. Las Vegas continues to approach full employment but the market, like many others across the country, has yet to see robust wage growth. However, I do believe wages will start to rise as the labor market continues to tighten through the rest of the year.
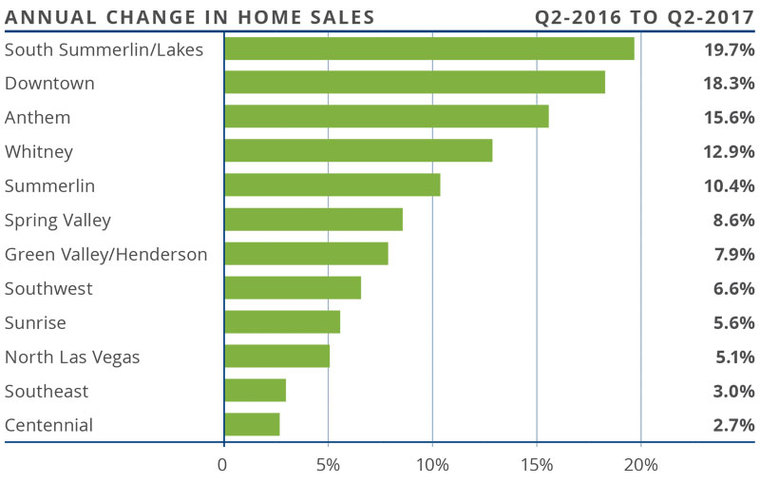
 The speedometer reflects the state of the region’s housing market using housing inventory, price gains, home sales, interest rates, and larger economic factors.
 Along with the expanding economy, home prices continue to rise at very robust rates. Year-over-year, average prices rose 14.9%. The region’s average sales price is now $470,187.
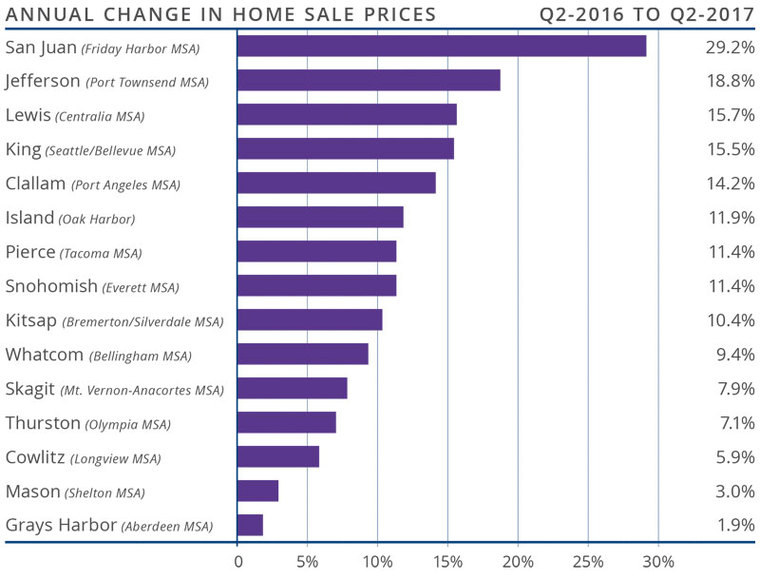
 This speedometer reflects the state of the region’s housing market using housing inventory, price gains, home sales, interest rates, and larger economic factors. For the second quarter of 2017, I moved the needle a little more in favor of sellers. To define the Western Washington market as “tight” is somewhat of an understatement.
")


