
 Facebook
 X
X
 Pinterest
 Copy Link

ECONOMIC OVERVIEW
The Washington State economy added 79,600 new jobs over the past 12 months. This impressive growth rate—2.4%—is well above the national rate of 1.2%. However, as we anticipated in last quarter’s report, we are seeing a modest slowdown in the growth rate as the state moves closer to full employment. Expansion has taken place in all major job sectors other than Aerospace (a function of a slowdown at Boeing). Seeing this current rate of expansion, I am raising my employment forecast and now predict that Washington will add 81,000 new jobs in 2017.
Given the robust job market, it is unsurprising that the state unemployment rate continues to fall. The current unemployment rate in Washington State is 4.6% and we are, essentially, at full employment. Additionally, all counties contained within this report reported a drop in their unemployment rate from a year ago.
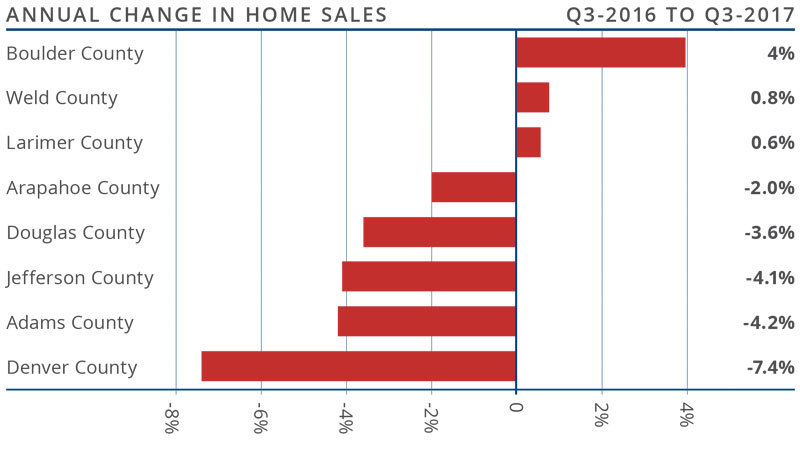
HOME SALES ACTIVITY
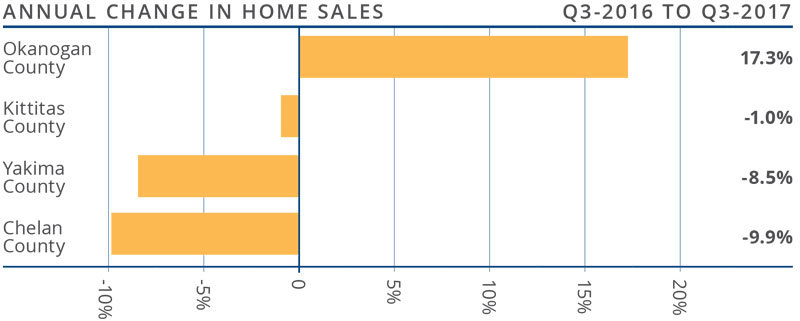
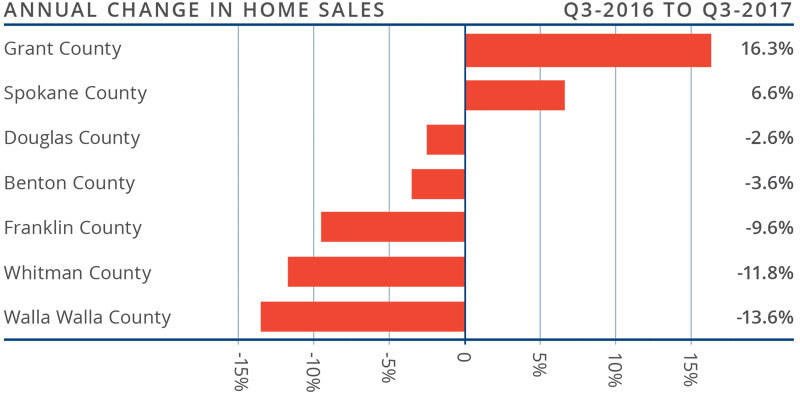
- Home sales throughout Central Washington were a mixed bag in the third quarter. Only one county saw sales rise compared to a year ago and three markets contracted. In total, there were 1,205 home sales in the quarter—a drop of 4.3% from the same period in 2016 but an increase of 3.1% over the second quarter of this year.
- Sales rose in Okanogan County, which had an impressive 17.3% increase over the third quarter of 2016.
- The number of pending home sales—an indicator of future closings—was down in all counties except Okanogan.
- The supply of homes for sale remains an issue as inventory was down 15.6% compared to the third quarter of last year. The market is clearly starved of inventory, which continues to push home prices higher and slow sales velocities.
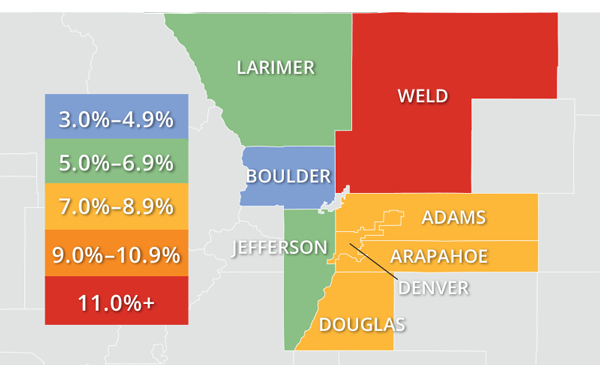
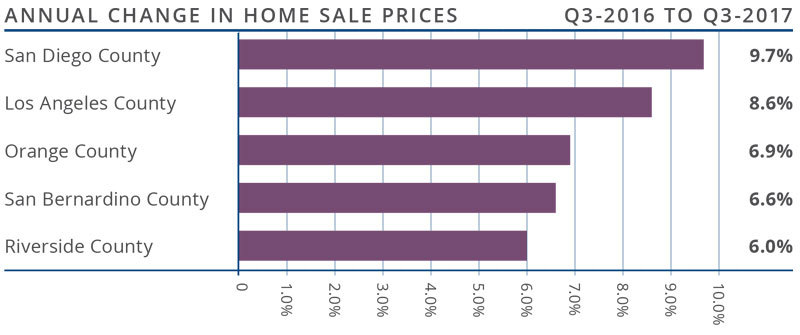
HOME PRICES
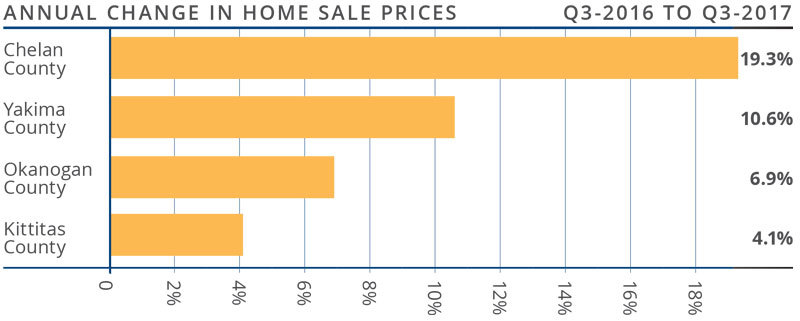
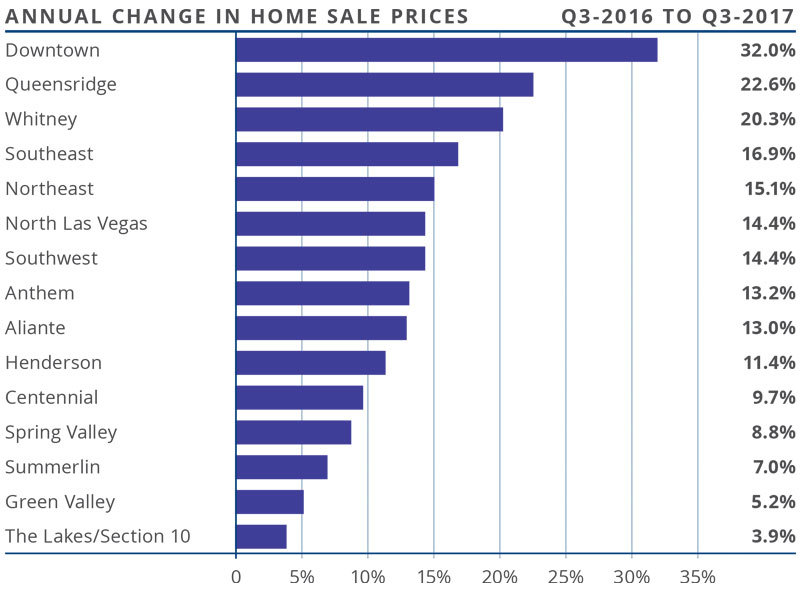
![]() Year-over-year, the average home price in the region rose by 10.5% to $278,563. Price growth remains well above the long-term average as demand exceeds supply.
Year-over-year, the average home price in the region rose by 10.5% to $278,563. Price growth remains well above the long-term average as demand exceeds supply.- Only Kittitas County saw relatively modest price increases while the other three counties had impressive price increases.
- All counties in this report saw prices rise when compared to the third quarter of 2016. Chelan County led the way with an increase of 19.3%.
- The takeaway here is that home-price growth continues at above-average rates due to very limited supply. I anticipate that the rate of appreciation will start to taper, but not until next year.
 Year-over-year, the average home price in the region rose by 10.5% to $278,563. Price growth remains well above the long-term average as demand exceeds supply.
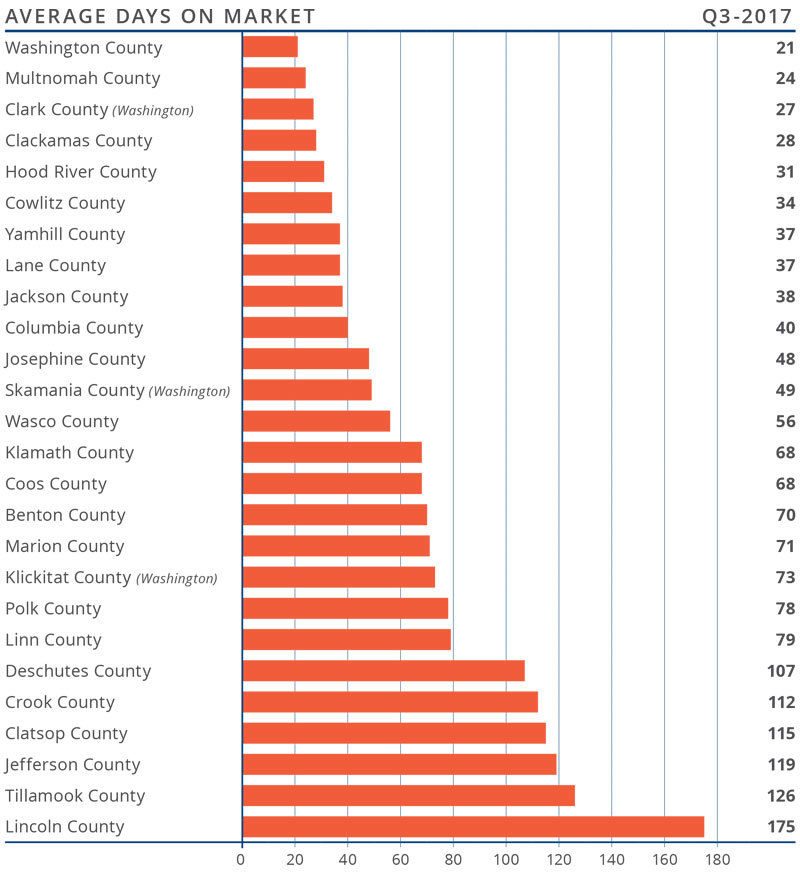
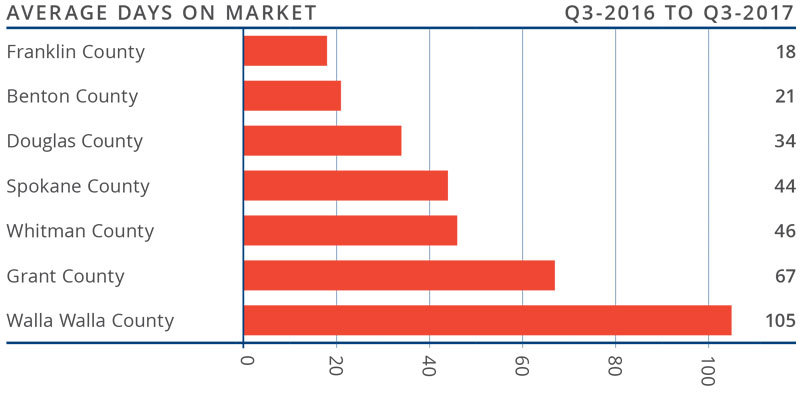
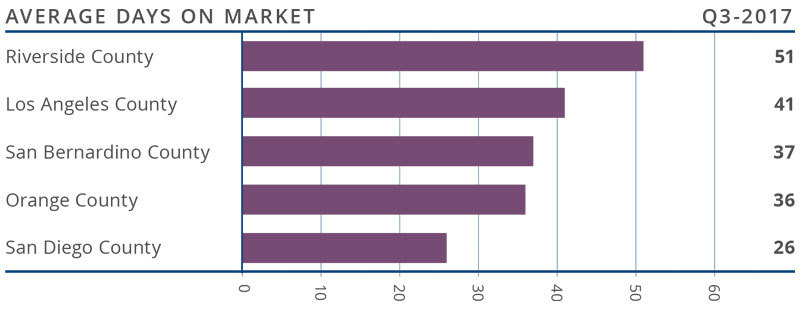
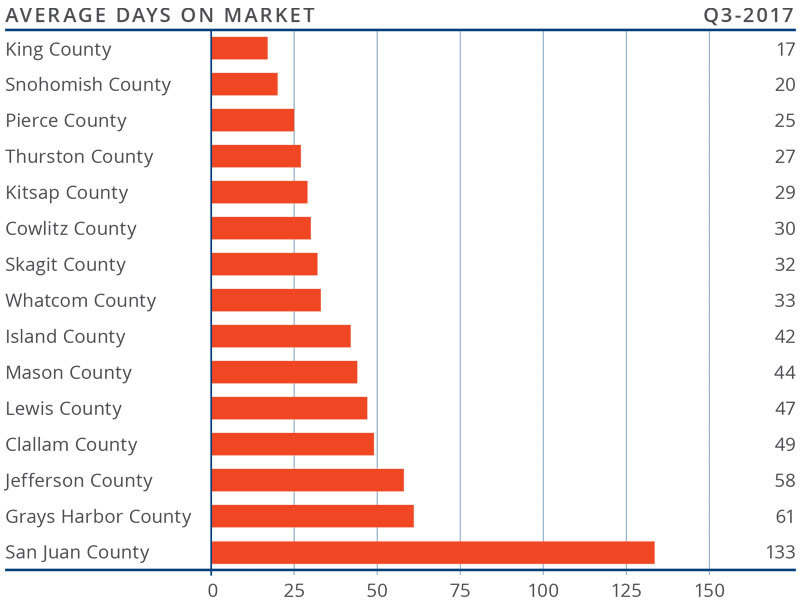
DAYS ON MARKET
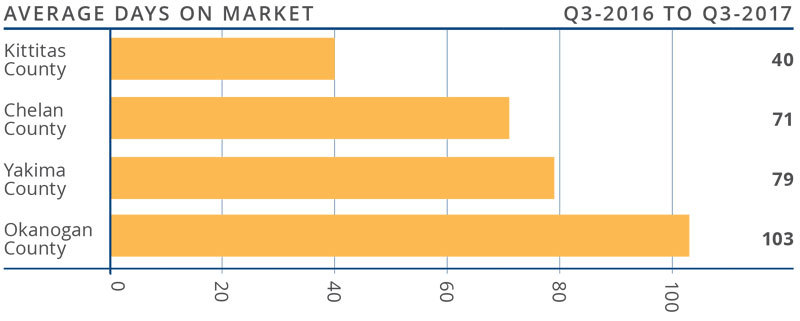
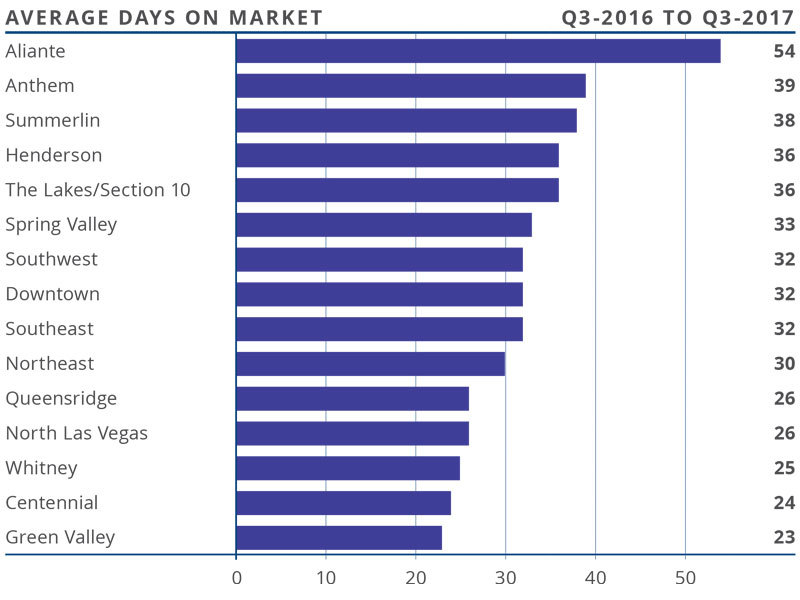
- The average number of days it took to sell a home dropped 22 days when compared to the third quarter of 2016.
- The average time it took to sell a home in the region was 73 days, matching the second quarter of this year.
- All the markets contained in this report saw days on market drop from the same quarter in 2016.
- Homes sold the fastest in Kittitas County, where it took an average of 40 days to sell a home. The greatest drop in the time it took to sell a home was in Chelan County, where it took 35 fewer days than in the third quarter of last year.
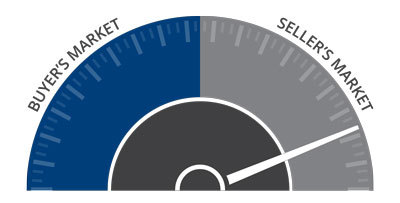
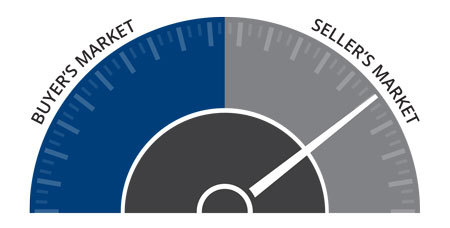
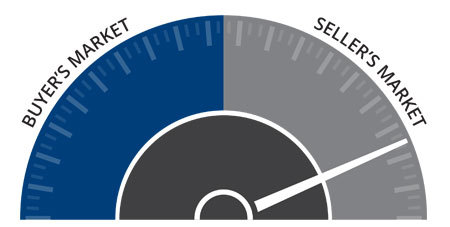
CONCLUSIONS
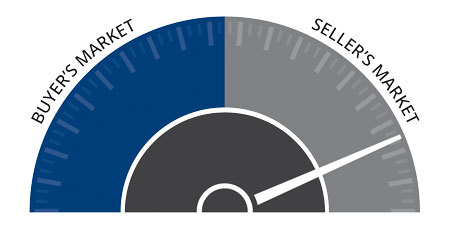
 This speedometer reflects the state of the region’s housing market using housing inventory, price gains, home sales, interest rates, and larger economic factors. For the third quarter of 2017, I moved the needle a little more into sellers’ territory. Prices are still trending higher than average due to inventory issues that remain stubbornly in place. The balance of this year will favor sellers as demand continues to exceed supply.

Matthew Gardner is the Chief Economist for Windermere Real Estate, specializing in residential market analysis, commercial/industrial market analysis, financial analysis, and land use and regional economics. He is the former Principal of Gardner Economics, and has over 25 years of professional experience both in the U.S. and U.K.
If you are in the market to buy or sell, we can connect you with an experienced agent here.

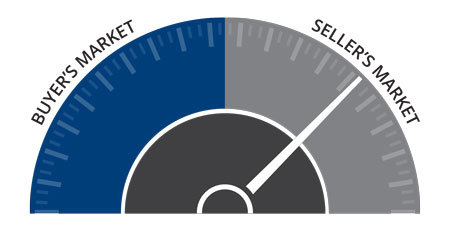
 The speedometer reflects the state of the region’s housing market using housing inventory, price gains, home sales, interest rates, and larger economic factors. Housing markets throughout Oregon continue to benefit greatly from the healthy regional economy.
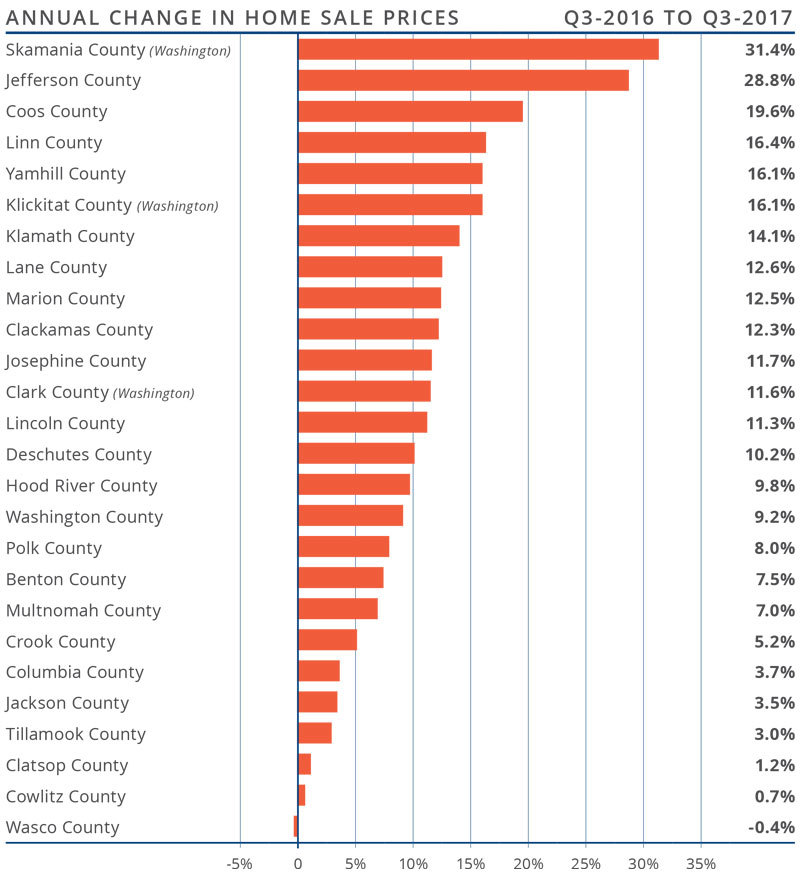
 Year-over-year, the average home price in the region rose by 7.8% to $249,238, and prices were up by 3% compared to last quarter. Price growth has been moderating across the region, but several counties continue to see well-above-average appreciation.
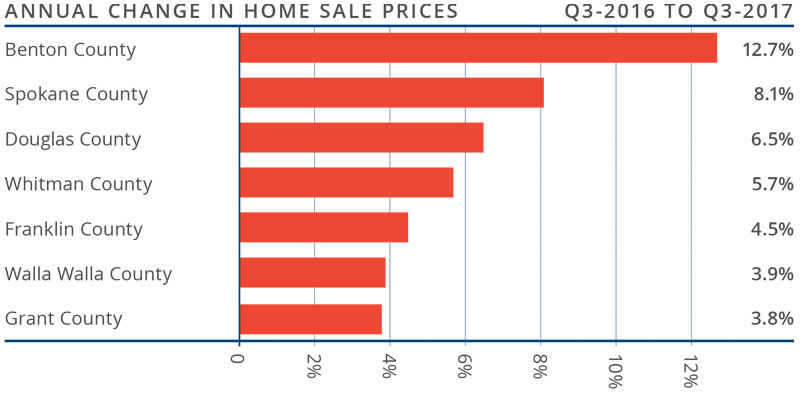
 This speedometer reflects the state of the region’s housing market using housing inventory, price gains, home sales, interest rates, and larger economic factors. Given the drop in listings, increase in pending and closed sales, and rising home prices in third quarter, I moved the needle a little more in favor of sellers. The fall and winter months will continue favoring sellers with demand exceeding supply.
 With substantial competition for the few available homes, prices continue to rise. Average prices were up 7.5% year-over-year to a regional average of $428,602.
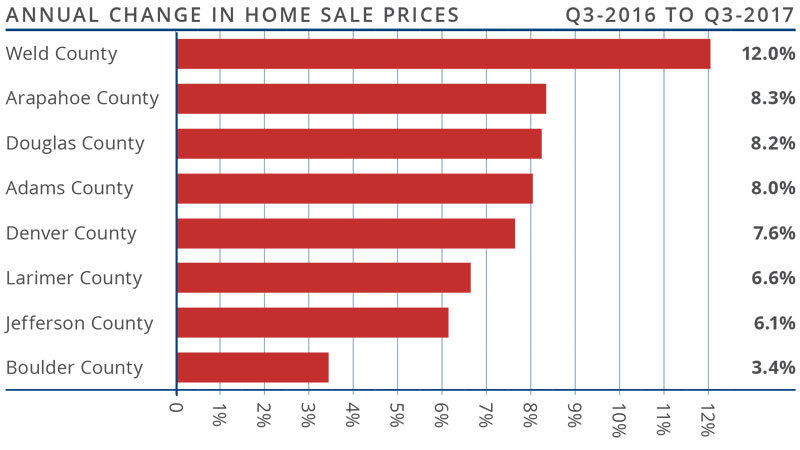

 This speedometer reflects the state of the region’s housing market using housing inventory, price gains, home sales, interest rates, and larger economic factors.


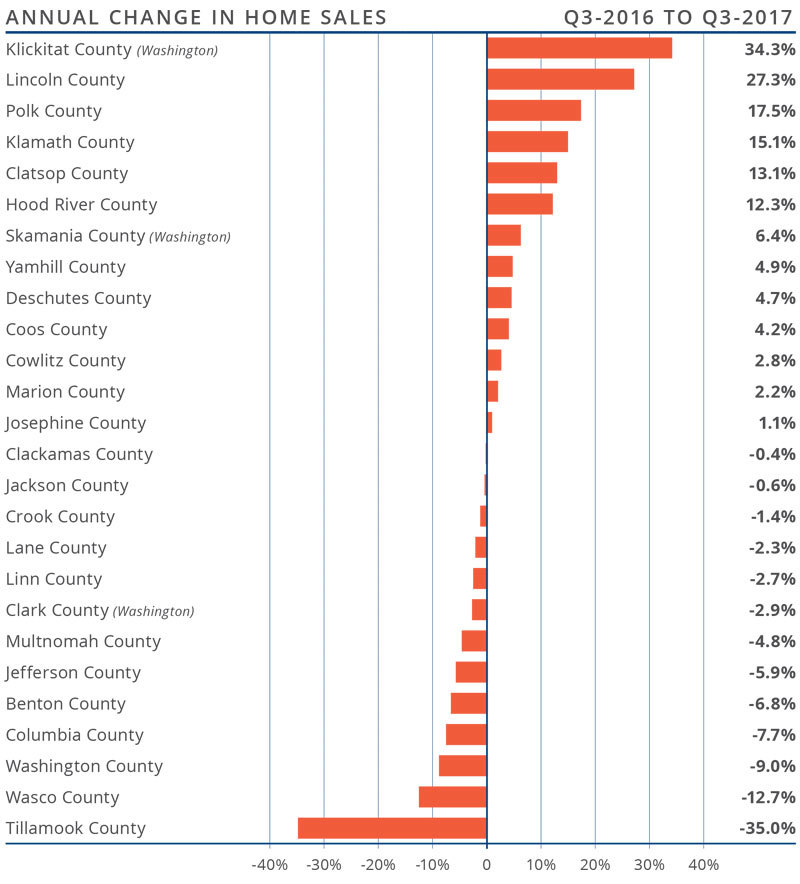
 There were 51,906 home sales in the third quarter of this year. This was 0.5% lower than the same period in 2016, and 4.8% lower than in the second quarter of this year.
 The speedometer reflects the state of the region’s housing market using housing inventory, price gains, home sales, interest rates, and larger economic factors.
 Employment in the Las Vegas metropolitan area continues to moderate from the substantial growth of the past few years, but the region still experienced impressive annual employment growth of 3%. The market has added 28,400 new jobs over the past 12 months. With this growth in employment, the unemployment rate came in at 5.2%.
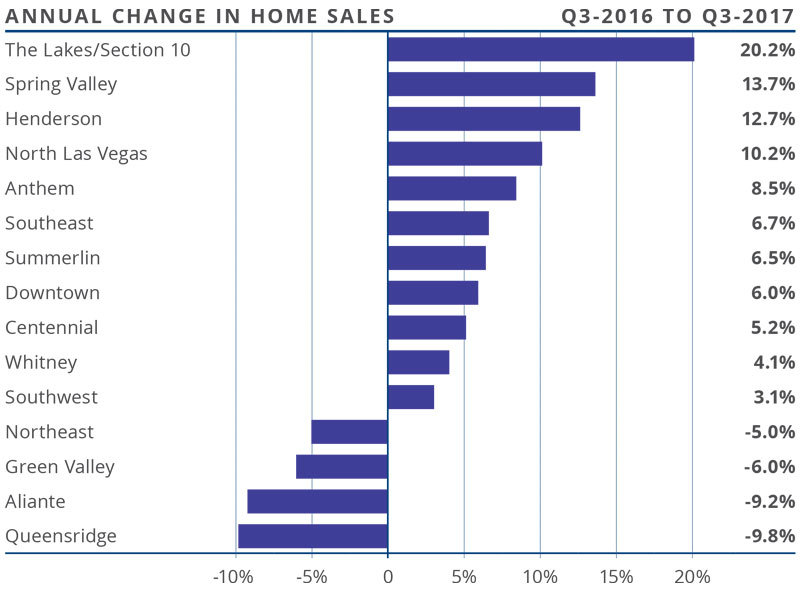
 The speedometer reflects the state of the region’s housing market using housing inventory, price gains, home
 Given tight supply levels, it is unsurprising to see very solid price growth across the Western Washington counties. Year-over-year, average prices rose 12.3% to $474,184. This is 0.9% higher than seen in the second quarter of this year.
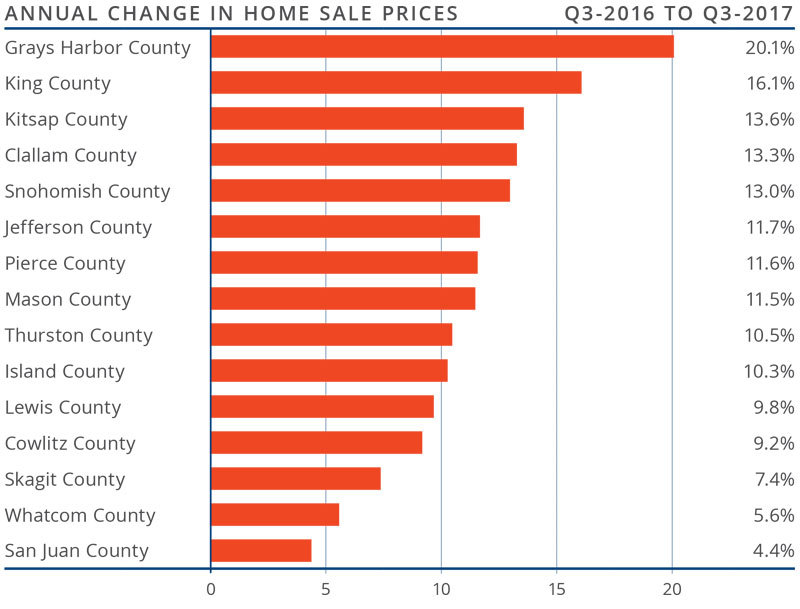
 This speedometer reflects the state of the region’s housing market using housing inventory, price gains, home sales, interest rates, and larger economic factors. For the third quarter of 2017, I have left the needle at the same point as the second quarter. Though price growth remains robust, sales activity has slowed very slightly and listings jumped relative to the second quarter. That said, the market is very strong and buyers will continue to find significant competition for accurately priced and well-located homes.


")


