November brings a transition to shorter days, colder weather and spending more time indoors. It also brings anticipation, planning and preparation for Thanksgiving and the upcoming winter holidays.
Our checklist this month includes small, quick and easy tasks you can do now to get a jump start on your holiday hosting preparation so you can enjoy friends and family when they arrive.
Replace chair floor protectors. Prevent damage to your hardwood floors by adding or replacing floor protection pads to the legs of your chairs. Hardware stores sell felt self-adhesive protectors that are easy to use.
Clean garbage disposal. Run a few pieces of lemon rind with some ice cubes through your garbage disposal to keep it smelling fresh. The ice chunks scour the blades and scrape away debris. Products that clean and deodorize garbage disposals can also be purchased in retail stores.
Repair plumbing issues. Fix a slow drain or a stuck garbage disposal now rather than wait until you have a full house of guests.
Check bathtub caulk. Use diluted bleach to clean caulk that is moldy or mildewed. Avoid water damage to your home’s framing by replacing worn-out caulking as soon as possible.
Stock up for winter. Buy winter supplies like shovels and ice melting products now so you’ll be ready when the first snow falls.
Silence squeaky door hinges. Spray some cooking oil or other lubricant on door hinges. Be sure to first place a drop cloth on the floor to protect it and also blot the hinge with a rag to remove excess oil.
Clean kitchen exhaust fan filter. Remove kitchen exhaust fan screen and scrub with a mild detergent or run through the dishwasher.
Check fire extinguishers. Locate your fire extinguishers and be sure their gauge shows enough pressure.
Set aside a November afternoon to do the items on this home maintenance list, then sit back and enjoy a cup of hot apple cider. Happy Thanksgiving!
This blog was reposted with the permission of Long & Foster.
Last week Windermere hosted 16 members of the China Alliance of Real Estate Agencies (CAREA) during a daylong tour of Seattle and Bellevue, WA. CAREA is a coalition of the largest regional and national real estate companies in China, representing over 60 percent of all Chinese real estate sales. Their stop in Seattle was a part of a four-city tour that also included Chicago, New York, and Dallas. The cities were identified because of their popularity amongst Chinese investors/buyers, and the CAREA member’s desire to better understand the residential real estate markets in those areas.
The group’s interest in Seattle stems from the growing number of Chinese foreign national buyers in the area, especially in neighborhoods like West Bellevue where real estate brokers say buyers are drawn to the newer homes, top-performing schools, and proximity to high-end restaurants and shopping. This year, Seattle surpassed San Francisco as the second place in the world where Chinese millionaires want to purchase property (according to Shanghai-based Hurun Research).
Windermere took the group on a tour of three luxury homes in West Bellevue that are on the market for between $5 and $10 million. The tour started with a new construction home priced at $6.8 million in Clyde Hill, represented by Windermere broker Shawna Ader. The second stop was a more traditional home in Medina for $5.3 million, listed by Windermere broker Wendy Paisley. The last home was the show stopper, an incredible manse priced at just under $10 million on Yarrow Point, represented by Windermere broker Anna Riley.
Along for the ride were also several members of the media who were drawn to the story about Chinese interest in the Seattle-area housing market. KING 5 News, KOMO 4 News, Q13 News, and the Seattle Times all spent time touring the homes and interviewing representatives from CAREA and Windermere about the reasons why Seattle is an increasingly popular location for international buyers.
Following the luxury home tour, the Chinese guests and Windermere executives gathered for lunch and a presentation by Windermere Chief Economist, Matthew Gardner, who provided an overview of the greater Seattle area housing market and economy. The day was then capped off with a seaplane tour of Seattle by Kenmore Air. As CAREA vice president Yi Lui stated after the tour, “A float plane is the way to sell Seattle.”
The State of Utah added 37,300 non-agricultural jobs over the past 12 months, a growth of 2.6%. Although this represents a slowing in employment gains, it is not a cause for concern because the economy is running at full employment and only so many new jobs can be created. That said, my latest forecast model is suggesting that the pace of employment growth is likely to kick back up during the last quarter of the year.
In August, the unemployment rate in the state was 3.5%, up from 3.3% a year ago. The increase in the unemployment rate is a function of a burgeoning labor force, which has risen by almost 56,000 over the past year.
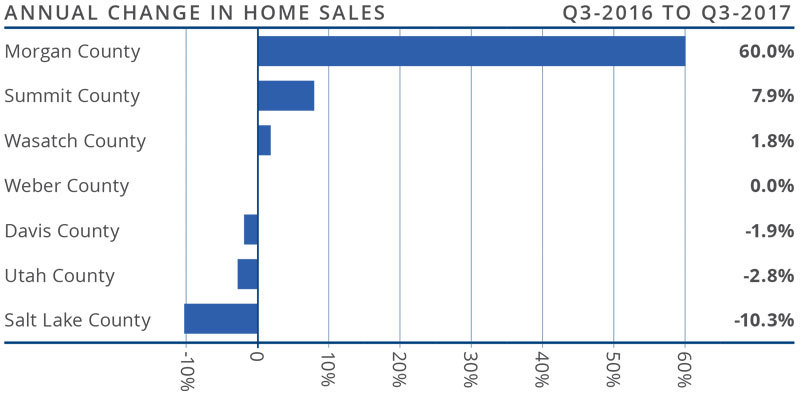
HOME SALES ACTIVITY
There were 9,907 home sales during the third quarter of 2017, which was a drop of 5.3% from the same period in 2016.
Sales rose in just one of the counties analyzed in this report: small Morgan County saw sales grow 60% year-over-year. It’s worth noting though that this equates to an increase of just 18 units. There were more marginal sales increases in Summit and Wasatch Counties. Sales fell marginally in Davis and Utah Counties, with a more severe drop in Salt Lake County.
Home sales slowed due to very low levels of available inventory. Listing activity continues to trend at well below historic averages, with the total number of homes for sale in the third quarter 26.6% below the level seen a year ago.
The takeaway here is that unless we see a drastic increase in listings, sales growth will remain at below-average levels.
HOME PRICES
Because of considerable competition for the few available homes, prices continue to rise. Average prices in the region were up 10.2% year-over-year to an average of $340,031.
There was substantial price growth in Summit and Weber Counties, where prices rose by double digits. That said, all counties saw higher home prices in the third quarter than a year ago.
Appreciation was strongest in Morgan County, where prices rose by 32%.
There is clearly an ongoing imbalance between supply and demand, with home prices continuing to appreciate at above-average rates. This is likely to continue for the foreseeable future.
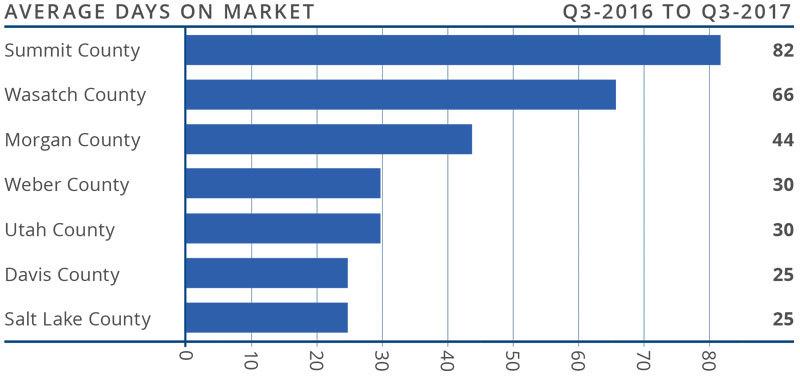
DAYS ON MARKET
The average number of days it took to sell a home rose by five days when compared to the third quarter of 2016.
It took an average of less than a month to sell a home in Salt Lake, Davis, Utah, and Weber Counties.
During the third quarter, it took an average of 43 days to sell a home in the region.
Although demand remains robust, it appears as if buyers are being a little more “choosy,” which may be the reason why the time on market rose in four of the six counties in this report.
CONCLUSIONS
This speedometer reflects the state of the region’s housing market using housing inventory, price gains, home sales, interest rates, and larger economic factors.
In the third quarter of 2017, I have placed the needle well into seller territory. The supply of available homes remains at very low levels, which continues to create competition for well-priced and well-located homes. An increase in the time it takes to sell a home may suggest that the market is either getting weary of all the competition or that would-be buyers are possibly putting off buying until they see more choices in the number of homes for sale. All of that considered, it remains a seller’s market.
Matthew Gardner is the Chief Economist for Windermere Real Estate, specializing in residential market analysis, commercial/industrial market analysis, financial analysis, and land use and regional economics. He is the former Principal of Gardner Economics, and has more than 30 years of professional experience both in the U.S. and U.K.
If you are in the market to buy or sell, we can connect you with an experienced agent here.
Where do you find the colors you love? And just because you love a hue, does that mean it's right for your walls? Let's take a closer look at color inspiration. Here you'll find tips for how to get your creative juices flowing and zero in on the color palettes that speak to you.
1. Be inspired by a landscape you love. Choosing your paint colors based on hues that occur together in nature takes some of the guesswork out of paint picking. The beach is the quintessential example of taking the landscape to a color scheme — the hues of sand, water and sky work beautifully as paint colors, as well as on furniture and accessories.
2. Snap pictures of colors that inspire you on walks and travels. Carry a camera and capture those little details that inspire you as you see them. Taking quick snapshots with your camera phone is fine — the point is more in the noticing than in the quality of your pictures. Sometimes the spirit of a place really shines through in the colors used there, so mine those old vacation photos for inspiration, too.
3. Notice the subtle hues that move you. Not everyone is drawn to bold, clear colors; that is only one small slice of the spectrum. Pay attention to the subtle hues and particular shades that move you, as these can become great color palettes. Perhaps you are drawn to the rich browns of worn leather and old wood. If you love blue, is it midnight, pale aqua or French blue? Get specific.
4. Try doing a color-a-day experiment. This practice is a workout for your creativity and visual sense. Look for shades of one color to photograph each day, until you have covered them all. Keep your eyes peeled for pretty veggies in the produce bins, graffiti on a brick wall, a row of colorful binders in your office — nowhere is off-limits.
5. Look to the branding of good restaurants, shops and other businesses. Shops are often great places for finding color schemes, since great care was taken to design them in an appealing way. The next time you walk into a shop or restaurant and find yourself really enjoying the atmosphere, stop and ask yourself why. Take a closer look at your surroundings — is it the paint color that makes you feel good? Try to begin naming what really works for you.
6. Pay attention to shop displays. When you're inside a shop, pay special attention to beautiful displays of objects and flowers — especially color combinations that catch your eye. Notice which color was used in a larger swath and which color punctuates the arrangement. For instance, you may be drawn to a display of sunshine-yellow mugs, but upon further thought realize it's the deep blue tile wall in the background that really makes it for you.
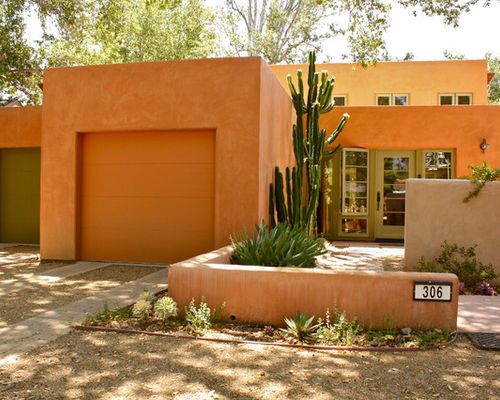
7. Consider the architecture of your home and the region you live in. What colors are typically used to play up the sort of house you have? Noticing doesn't mean you have to follow suit, but it can help guide you in your process. Southwestern homes, for instance, tend to feature rich earth-tone colors, which complement the landscape beautifully.
8. Aim to complement what you already own. Look at what you already have in your home — do you tend to be drawn to bright, statement-y furniture with bold colors and patterns? If so, you may want to stick with neutral walls that won't compete. If your furniture taste runs to white, white and more white, perhaps a subtle (but not white) neutral would add interest to your clean aesthetic. Assess the finishes in your home (floors, counters etc.) as well, since you can use them to find complementary wall colors.
9. Cast a wide net in what you read for inspiration. Decorating books are wonderful, of course, but also consider looking to graphic design, photography and garden books, and all sorts of magazines for inspiration. Save images that call out to you and begin a collection.
10. Experiment with inspiration boards. A board that works for another person may not work for you — so try out different methods until you hit on something that feels fun. Some may love the physical act of cutting and tacking up tear sheets to a board; others may find that fussy. Collect items in a tray or basket, create an ideabook on Houzz, slide your finds into a binder or stuff everything into a big folder.
11. Learn to translate what you see. Picking colors for your walls is a highly personal process. The best way to learn about what works for you is to start paying more attention to color … everywhere. Whether you are choosing colors on your own or working with a pro, this will hone your color sense and make picking paint a better experience all around.
Idaho added 15,000 new jobs over the past 12 months, a growth of 2.1%. We have noticed a drop in the annual growth rate compared to 2016 but this is nothing to be concerned about. The state is at full employment and it is natural to see a slowdown in growth at this point in the economic cycle.
In September, the state unemployment rate was 2.8%—a figure not seen since records started being kept in 1976. The labor force continues to expand thanks to the robust economy. I anticipate that Idaho will continue to outperform the U.S. in growth for the balance of the year as well as into 2018.
HOME SALES ACTIVITY
Third quarter home sales rose by 6.2% compared to the same period last year, with a total of 6,822 homes changing hands.
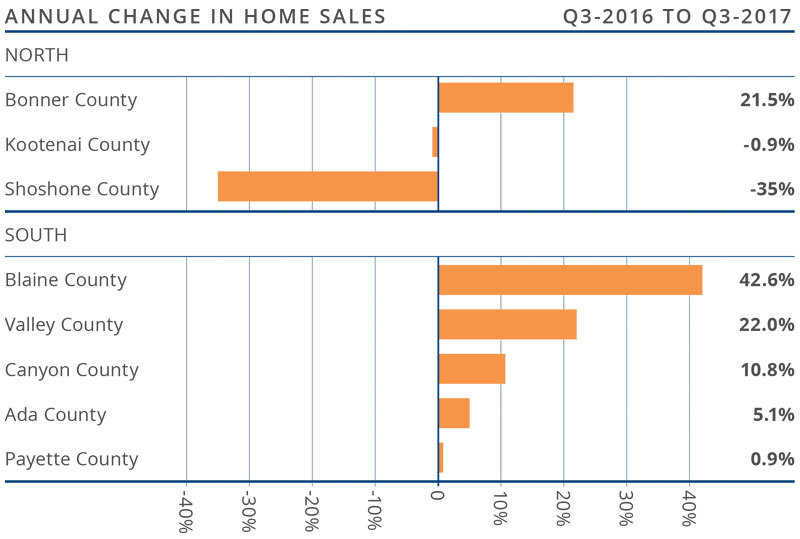
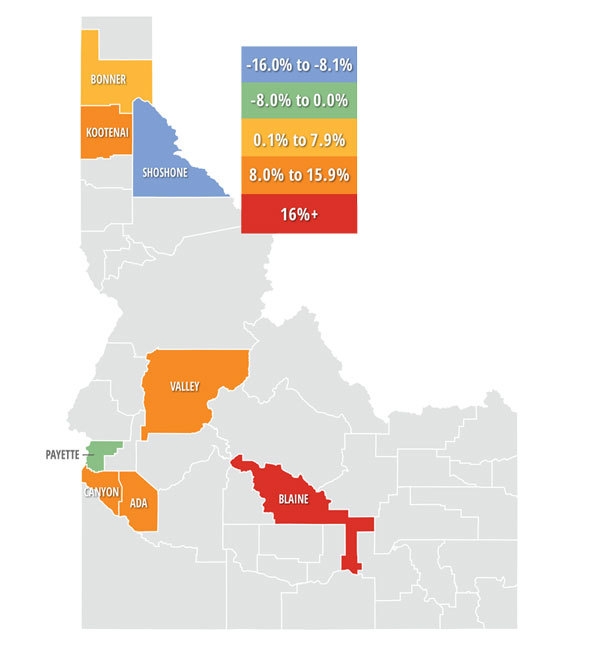
Sales rose the fastest in Blaine County, which had a 42.6% increase over the third quarter of 2016. In the north, sales grew the most in Bonner County, which saw a 21.5% increase.
Year-over-year sales dropped in two of three Northern Idaho counties in this report, but rose in all counties in the Southern Idaho market areas.
Listing inventory rose modestly in Shoshone County but fell in the two other Northern Idaho markets. Southern Idaho saw a mixed bag, with listings higher in Valley County and marginally up in Payette County while the other three counties saw listing activity decline.
HOME PRICES
The average home price in the region rose 11% year-over-year to $300,265.
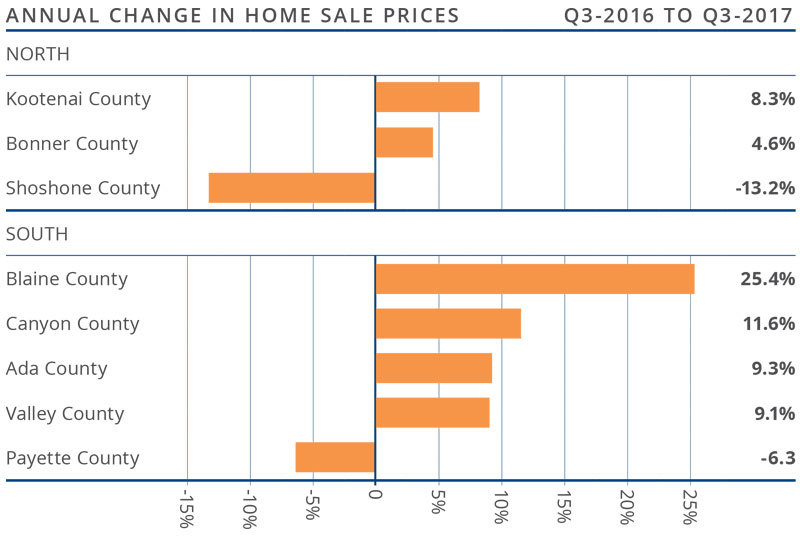
Blaine County led the market with the strongest annual price growth. Homes there sold for 25.4% more than a year ago.
All but two counties in this report saw home prices increase compared to the third quarter of 2016, with two showing double-digit gains.
Home prices in Shoshone and Payette Counties decreased modestly last quarter, but I do not believe this will be an ongoing trend.
DAYS ON MARKET
The average number of days it took to sell a home in the region dropped 16 days when compared to the third quarter of 2016.
It took an average of 105 days to sell a home in Northern Idaho and 75 days in the southern part of the state.
Homes in all three Northern Idaho counties took less time to sell than they did in the same quarter of 2016, and all the southern counties—other than Valley—saw a drop in the time it took a home to sell.
Homes sold the fastest in Ada and Canyon Counties, where it took an average of 32 days for a home to sell.
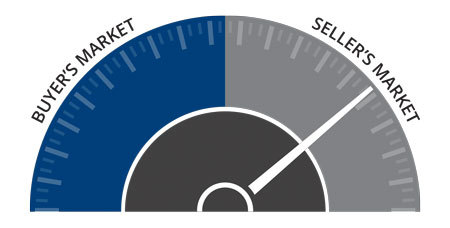
CONCLUSIONS
The speedometer reflects the state of the region’s housing market using housing inventory, price gains, home sales, interest rates, and larger economic factors. Consumer confidence in the housing market seems to have returned, causing the markets in this report to perform well overall and for home prices to continue trending upward.
The market remains out of balance with more buyers than sellers. But because of
the mixed data, I have chosen to leave the needle at the same position as last quarter. The Idaho economy, specifically in Ada and Canyon Counties, remains robust and this will allow the housing market to expand further for the foreseeable future.
Matthew Gardner is the Chief Economist for Windermere Real Estate, specializing in residential market analysis, commercial/industrial market analysis, financial analysis, and land use and regional economics. He is the former Principal of Gardner Economics, and has more than 30 years of professional experience both in the U.S. and U.K.
If you are in the market to buy or sell, we can connect you with an experienced agent here.
The Washington State economy added 79,600 new jobs over the past 12 months. This impressive growth rate—2.4%—is well above the national rate of 1.2%. However, as we anticipated in last quarter’s report, we are seeing a modest slowdown in the growth rate as the state moves closer to full employment. Expansion has taken place in all major job sectors other than Aerospace (a function of a slowdown at Boeing). Seeing this current rate of expansion, I am raising my employment forecast and now predict that Washington will add 81,000 new jobs in 2017.
Given the robust job market, it is unsurprising that the state unemployment rate continues to fall. The current unemployment rate in Washington State is 4.6% and we are, essentially, at full employment. Additionally, all counties contained within this report reported a drop in their unemployment rate from a year ago.
HOME SALES ACTIVITY
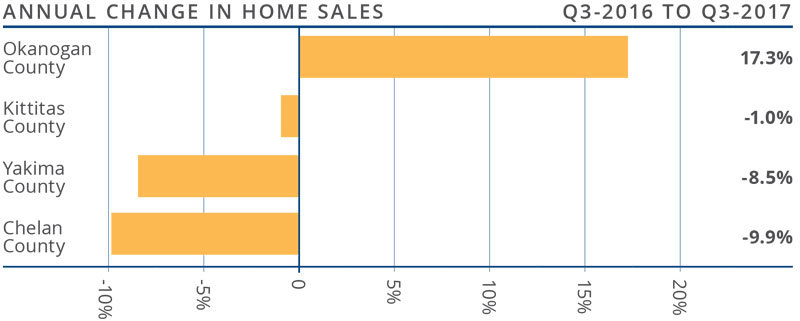
Home sales throughout Central Washington were a mixed bag in the third quarter. Only one county saw sales rise compared to a year ago and three markets contracted. In total, there were 1,205 home sales in the quarter—a drop of 4.3% from the same period in 2016 but an increase of 3.1% over the second quarter of this year.
Sales rose in Okanogan County, which had an impressive 17.3% increase over the third quarter of 2016.
The number of pending home sales—an indicator of future closings—was down in all counties except Okanogan.
The supply of homes for sale remains an issue as inventory was down 15.6% compared to the third quarter of last year. The market is clearly starved of inventory, which continues to push home prices higher and slow sales velocities.
HOME PRICES
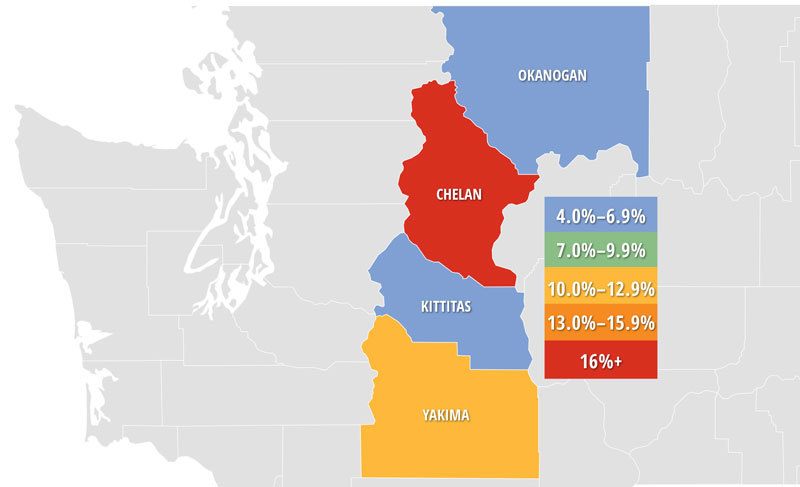
Year-over-year, the average home price in the region rose by 10.5% to $278,563. Price growth remains well above the long-term average as demand exceeds supply.
Only Kittitas County saw relatively modest price increases while the other three counties had impressive price increases.
All counties in this report saw prices rise when compared to the third quarter of 2016. Chelan County led the way with an increase of 19.3%.
The takeaway here is that home-price growth continues at above-average rates due to very limited supply. I anticipate that the rate of appreciation will start to taper, but not until next year.
DAYS ON MARKET
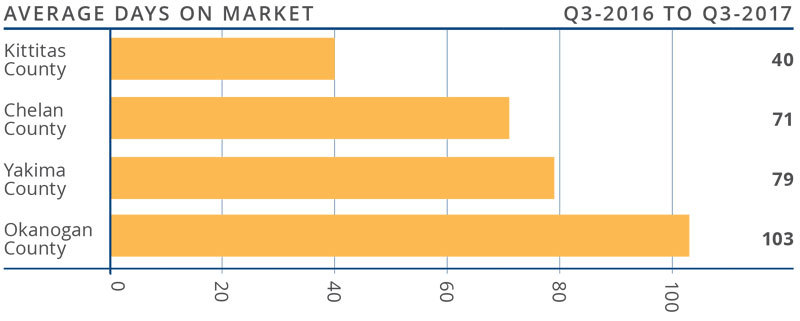
The average number of days it took to sell a home dropped 22 days when compared to the third quarter of 2016.
The average time it took to sell a home in the region was 73 days, matching the second quarter of this year.
All the markets contained in this report saw days on market drop from the same quarter in 2016.
Homes sold the fastest in Kittitas County, where it took an average of 40 days to sell a home. The greatest drop in the time it took to sell a home was in Chelan County, where it took 35 fewer days than in the third quarter of last year.
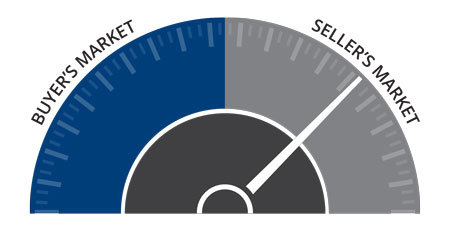
CONCLUSIONS
This speedometer reflects the state of the region’s housing market using housing inventory, price gains, home sales, interest rates, and larger economic factors. For the third quarter of 2017, I moved the needle a little more into sellers’ territory. Prices are still trending higher than average due to inventory issues that remain stubbornly in place. The balance of this year will favor sellers as demand continues to exceed supply.
Matthew Gardner is the Chief Economist for Windermere Real Estate, specializing in residential market analysis, commercial/industrial market analysis, financial analysis, and land use and regional economics. He is the former Principal of Gardner Economics, and has over 25 years of professional experience both in the U.S. and U.K.
If you are in the market to buy or sell, we can connect you with an experienced agent here.
The State of Oregon has added 37,400 new jobs over the past 12 months, with solid gains in Construction (+11,600), Education & Health Services (+9,000), and Trade, Transportation & Utilities (+8,000) sectors. Year-over-year, employment in Oregon has risen 2.0%.
In September, the state unemployment rate was 4.2%—up from 3.7% at the end of the second quarter but down from 4.9% in September 2016. The civilian labor force continues to grow and I fully anticipate that the state’s economy will perform well in 2018, though somewhat slower than 2017.
HOME SALES ACTIVITY
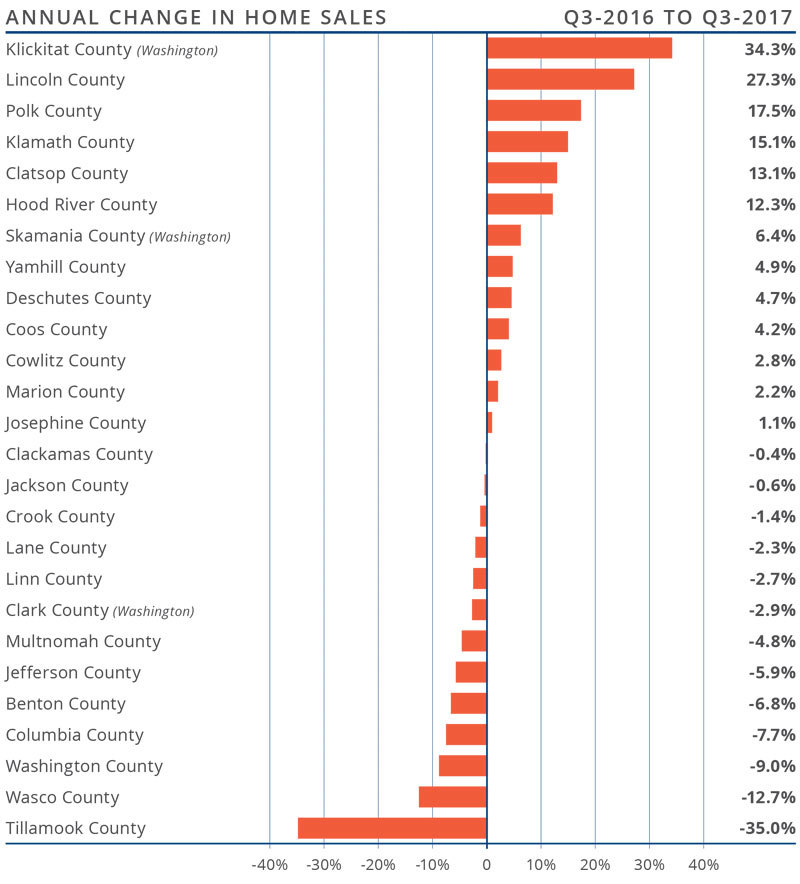
Third quarter home sales dropped by a very modest 1.5% when compared to the same period last year, with a total of 18,724 homes sold.
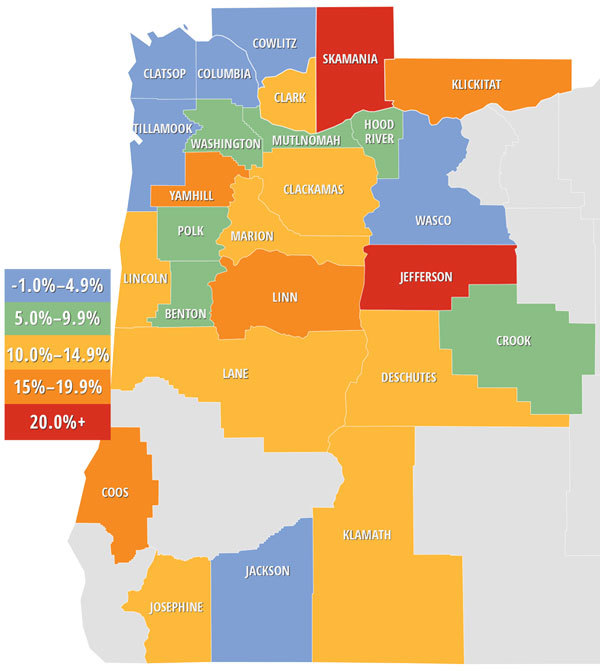
Sales rose the fastest in Klickitat County, which had a 34.3% increase over the third quarter of 2016. There were also noticeable sales increases in Lincoln, Polk, Klamath, Clatsop, and Hood River Counties. Home sales fell the most in Tillamook, Washington, and Wasco Counties.
Year-over-year sales rose in 13 counties, but dropped in the other 13.
The low level of available inventory continues to affect the market, causing sales to slow.
HOME PRICES
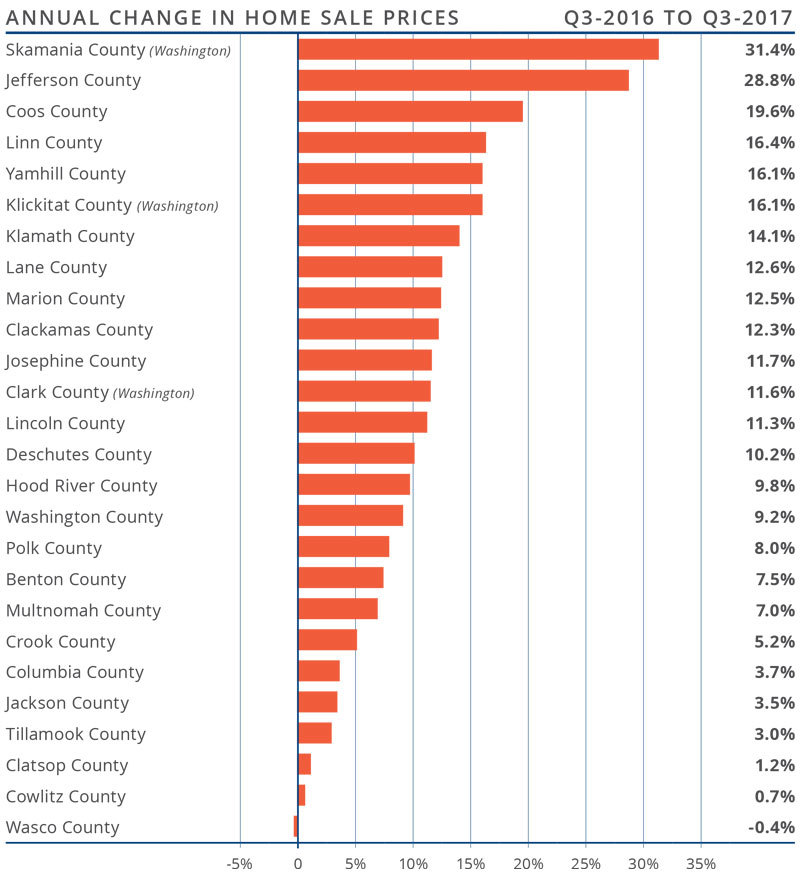
The average home price in the region rose 9.4% year-over-year to $368,292. This is also up 1.5% from the second quarter of 2017.
Skamania County led the market with the strongest annual price growth. Homes there sold for 31.4% more than a year ago.
All counties other than Wasco County experienced rising prices when compared to the third quarter of 2016, and a majority saw significant, double-digit increases.
Interest rates in the third quarter dropped by one tenth of a point from Q2, which likely allowed home price growth to rise at a faster rate than earlier in the year.
DAYS ON MARKET
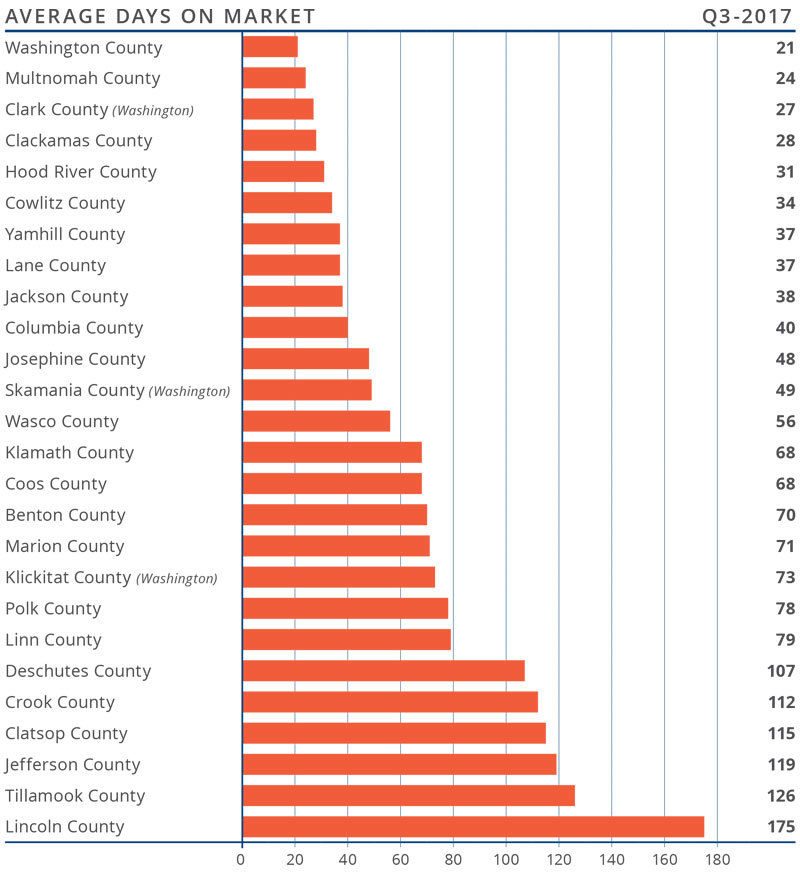
The average number of days it took to sell a home in the region dropped by 14 days compared to the third quarter of 2016, and was down 9 days from the second quarter of this year.
The average time it took to sell a home in the region last quarter was 67 days.
Only four counties saw the length of time it took to sell a home rise compared to a year ago, but I do not see this as a major issue.
Homes sold the fastest in Washington and Multnomah Counties, where it took an average of just 21 and 24 days, respectively, for homes to sell.
CONCLUSIONS
The speedometer reflects the state of the region’s housing market using housing inventory, price gains, home sales, interest rates, and larger economic factors. Housing markets throughout Oregon continue to benefit greatly from the healthy regional economy.
The Oregon/SW Washington housing market remains remarkably strong and, given that inventory levels are unlikely to increase as we head toward the end of the year, sellers remain in the driver’s seat. I have, therefore, moved the needle slightly more toward sellers for the third quarter.
Matthew Gardner is the Chief Economist for Windermere Real Estate, specializing in residential market analysis, commercial/industrial market analysis, financial analysis, and land use and regional economics. He is the former Principal of Gardner Economics, and has more than 30 years of professional experience both in the U.S. and U.K.
If you are in the market to buy or sell, we can connect you with an experienced agent here.
Employment growth in Washington State continues to slow as it moves closer to full employment. The state added 79,600 jobs between August 2016 and August 2017, and I still predict that we will see an additional 70,000 jobs by the end of the year.
Eastern Washington has seen a pickup in employment, with 15,307 jobs added over the past 12 months. The growth rate has slowed to 3.1% and is expected to continue falling through the balance of the year.
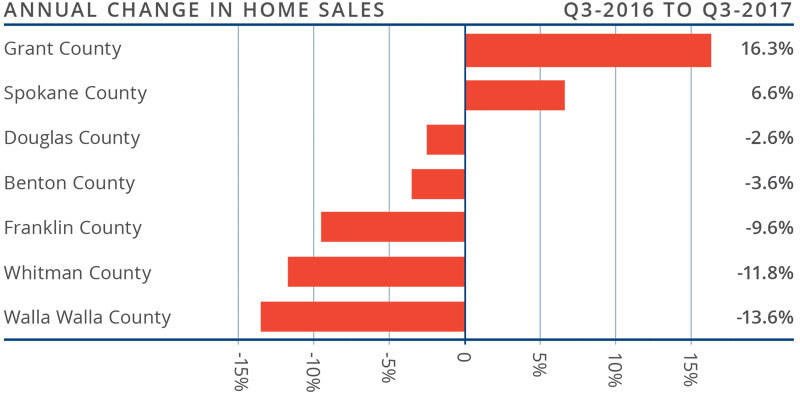
HOME SALES ACTIVITY
Similar to the second quarter, home sales throughout Eastern Washington were a mixed bag. Year-over-year home sales rose in two markets and decreased in five. In total, there were 4,165 home sales in the quarter—an increase of 2.3% over the third quarter of 2016 and 8.7% higher than the second quarter of 2017.
Sales rose at the fastest rate in Grant County, which increased by 16.3% versus a year ago. That said, the market is relatively small so sales can fluctuate quite dramatically.
Sales fell in five counties, mainly due to low inventory levels. With the number of pending sales varying across the Eastern Washington region, I expect to see sales fluctuate across all counties in the fourth quarter.
The number of homes for sale was down by 6.3% year-over-year. Inventory is clearly an issue and will continue to push up home prices (see more, below).
HOME PRICES
Year-over-year, the average home price in the region rose by 7.8% to $249,238, and prices were up by 3% compared to last quarter. Price growth has been moderating across the region, but several counties continue to see well-above-average appreciation.
Limited inventory continues to drive prices higher and this is unlikely to change as we move into the winter months.
All of the counties in this report saw prices rise when compared to the third quarter of 2016. Benton County led the way with an increase of 12.7%.
The takeaway here is that home-price growth continues at above-average rates and, as long as mortgage rates remain favorable to would-be buyers, prices will continue to rise.
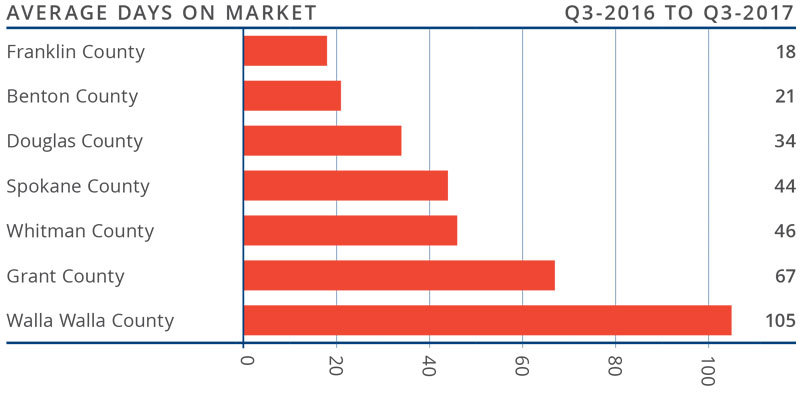
DAYS ON MARKET
The average number of days it took to sell a home dropped by 15 days when compared to the third quarter of 2016.
The average time it took to sell a home in the region was 48 days.
All areas contained in this report saw the time it took to sell a home drop from the same quarter in 2016.
Grant and Whitman Counties had the biggest drop in days on market. Homes sold 26 days faster in Grant County and 24 days faster in Whitman County than at this time last year.
CONCLUSIONS
This speedometer reflects the state of the region’s housing market using housing inventory, price gains, home sales, interest rates, and larger economic factors. Given the drop in listings, increase in pending and closed sales, and rising home prices in third quarter, I moved the needle a little more in favor of sellers. The fall and winter months will continue favoring sellers with demand exceeding supply.
Matthew Gardner is the Chief Economist for Windermere Real Estate, specializing in residential market analysis, commercial/industrial market analysis, financial analysis, and land use and regional economics. He is the former Principal of Gardner Economics, and has more than 30 years of professional experience both in the U.S. and U.K.
If you are in the market to buy or sell, we can connect you with an experienced agent here.
Colorado added 45,800 non-agricultural jobs over the past 12 months, a growth rate of 1.8%. Within the metropolitan market areas included in this report, annual employment growth was seen in all areas other than Grand Junction (where employment was stable) with substantial growth seen in Fort Collins (4.6%) and Greeley (3.5%).
In August, the unemployment rate in the state was 2.2%, down from 3.1% a year ago. The lowest reported unemployment rates were again seen in Fort Collins at just 1.8%. The highest rate was in Grand Junction, at a very respectable 3.0%. It is still reasonable to assume that all the markets contained within this report will see above-average wage growth given the very tight labor market.
HOME SALES ACTIVITY
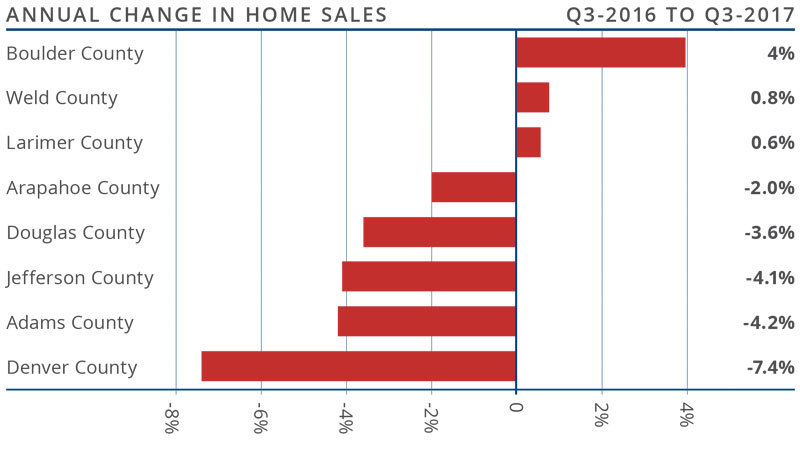
There were 17,140 home sales during the third quarter of 2017, which was a drop of 3.3% from the same period in 2016.
Sales rose the fastest in Boulder County, which saw sales grow 4% more than the third quarter of 2016. There were marginal increases in Weld and Larimer Counties. Sales fell in all the other counties contained within this report.
Home sales slowed due to very low levels of available inventory. Listing activity continues to trend at well below historic averages, with the total number of homes for sale in the third quarter 5.5% below the level seen a year ago.
The takeaway here is that sales growth has stalled due to the lack of homes for sale.
HOME PRICES
With substantial competition for the few available homes, prices continue to rise. Average prices were up 7.5% year-over-year to a regional average of $428,602.
Slower appreciation in home values was again seen in Boulder County, but the trend is still positive.
Appreciation was strongest in Weld County, which saw prices rise 12%.
Due to an ongoing imbalance between supply and demand, home prices will continue to appreciate at above-average rates for the foreseeable future.
DAYS ON MARKET
The average number of days it took to sell a home dropped by one day when compared to the third quarter of 2016.
Homes in all counties contained in this report took less than a month to sell. Adams County continues to stand out as it took an average of just two weeks to sell a home there.
During the third quarter, it took an average of 20 days to sell a home. This is up by 3 days compared to the second quarter of this year.
Demand remains strong, and well-positioned, well-priced homes continue to sell very quickly.
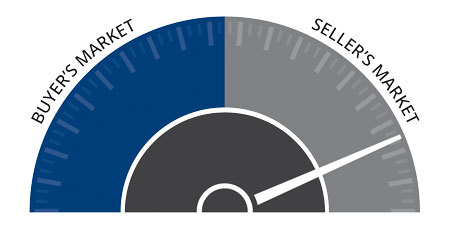
CONCLUSIONS
This speedometer reflects the state of the region’s housing market using housing inventory, price gains, home sales, interest rates, and larger economic factors.
In the third quarter of 2017, I have chosen to leave the needle where it was in the second quarter. Homes are still scarce; however, there is a small slowdown in price growth and a decline in both closed and pending sales. This may suggest the market is either getting weary of all the competition or that would-be buyers are possibly putting off buying until they see more choices in the number of homes for sale.
Matthew Gardner is the Chief Economist for Windermere Real Estate, specializing in residential market analysis, commercial/industrial market analysis, financial analysis, and land use and regional economics. He is the former Principal of Gardner Economics, and has more than 30 years of professional experience both in the U.S. and U.K.
If you are in the market to buy or sell, we can connect you with an experienced agent here.
Thanks to the generosity of Windermere agents and the community, the Windermere Foundation collected over $1,537,000 in donations through the third quarter of 2017. This is an increase of nine percent compared to this time last year! Individual contributions and fundraisers accounted for 62 percent of the donations, while 38 percent came from donations through Windermere agent commissions. So far, we have raised a total of $34,643,324 in donations since 1989.
Each Windermere office has its own Windermere Foundation fund account that they use to make donations to organizations in their communities. Year to date, a total of $1,179,202 has been disbursed to non-profit organizations dedicated to providing services to low-income and homeless families throughout the Western U.S.
One organization that has been the recipient of Windermere Foundation funds is SafeHouse of the Desert. Safehouse of the Desert provides a “safe” residential environment for children between the ages of 11 to17 years of age. These young people are the victims of physical and emotional abuse, homeless runaways, victims of human trafficking, emotionally unstable home environments and various other unsafe situations. The facility shelters the children from perpetrators and offers education, therapy, artistic expression, coupled with training for future jobs, skills and coaching in being responsible and making wise choices.
The 16 Windermere Homes & Estates offices in Southern California (Alpine, Big Bear, Del Mar, Escondido, Fallbrook, La Jolla, Palm Desert, Palm Valley, Plaza at Aviara, Rancho Bernardo, Rancho Bernardo-The Plaza, Santaluz, Scripps Ranch, South Carlsbad-Aviara, Temecula, and Trilogy) pooled their funds together and donated $5,000 for SafeHouse’s emergency shelter. They presented the donation check to SafeHouse on October 11, where they also spent the day cleaning, landscaping, organizing storage rooms, and providing breakfast and lunch at Harrison House, the 15-unit complex located behind the shelter and houses its transitional living program.
When asked why they chose this organization to help, Selina Sullivan, Regional Administrator for Windermere Homes & Estates said, “We recognize that the youth of today represents the future adults of tomorrow. Asking ourselves what we would want that future to look like, we realized that by contributing to this organization, we were impacting that future and contributing to the welfare of ALL children. In a world that is often covered in darkness, we wanted to serve as a beacon for others and to contribute to future generations.”
Generous donations to the Windermere Foundation over the years have enabled Windermere offices to continue to support local non-profits like SafeHouse of the Desert. If you’d like to help support programs for low-income and homeless families in your community, please click on the Donate button.

 Facebook
 X
X
 Pinterest
 Copy Link


 Because of considerable competition for the few available homes, prices continue to rise. Average prices in the region were up 10.2% year-over-year to an average of $340,031.
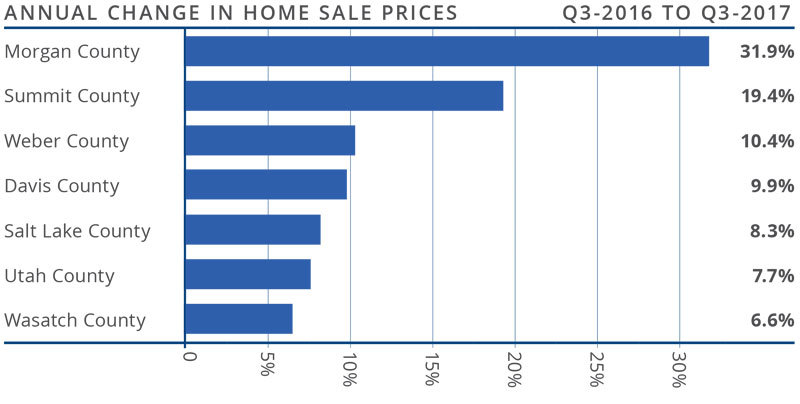
 This speedometer reflects the state of the region’s housing market using housing inventory, price gains, home sales, interest rates, and larger economic factors.


 The speedometer reflects the state of the region’s housing market using housing inventory, price gains, home sales, interest rates, and larger economic factors. Consumer confidence in the housing market seems to have returned, causing the markets in this report to perform well overall and for home prices to continue trending upward.

 Year-over-year, the average home price in the region rose by 10.5% to $278,563. Price growth remains well above the long-term average as demand exceeds supply.
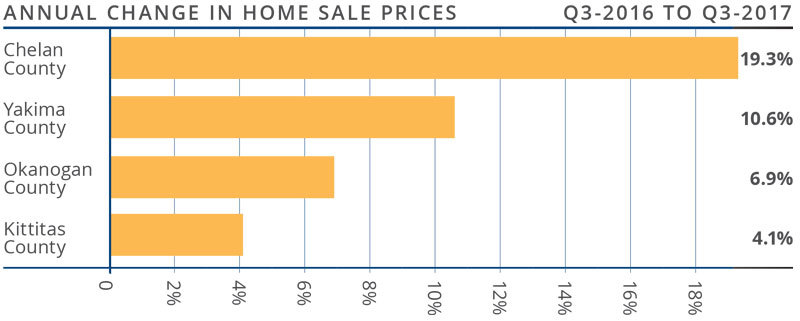
 This speedometer reflects the state of the region’s housing market using housing inventory, price gains, home sales, interest rates, and larger economic factors. For the third quarter of 2017, I moved the needle a little more into sellers’ territory. Prices are still trending higher than average due to inventory issues that remain stubbornly in place. The balance of this year will favor sellers as demand continues to exceed supply.
 The speedometer reflects the state of the region’s housing market using housing inventory, price gains, home sales, interest rates, and larger economic factors. Housing markets throughout Oregon continue to benefit greatly from the healthy regional economy.
 Year-over-year, the average home price in the region rose by 7.8% to $249,238, and prices were up by 3% compared to last quarter. Price growth has been moderating across the region, but several counties continue to see well-above-average appreciation.
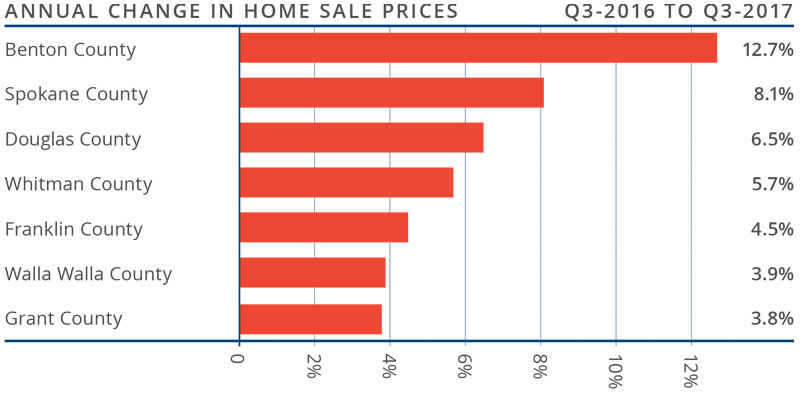
 This speedometer reflects the state of the region’s housing market using housing inventory, price gains, home sales, interest rates, and larger economic factors. Given the drop in listings, increase in pending and closed sales, and rising home prices in third quarter, I moved the needle a little more in favor of sellers. The fall and winter months will continue favoring sellers with demand exceeding supply.
 With substantial competition for the few available homes, prices continue to rise. Average prices were up 7.5% year-over-year to a regional average of $428,602.
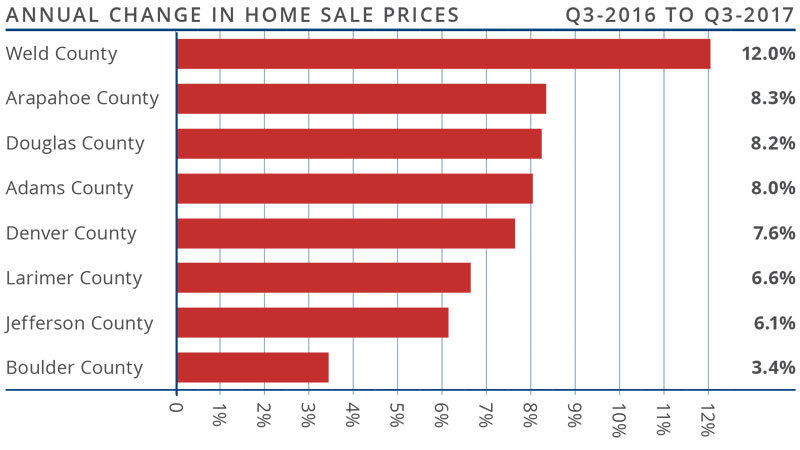

 This speedometer reflects the state of the region’s housing market using housing inventory, price gains, home sales, interest rates, and larger economic factors.


")


