Originating in the U.K. in 1988, Red Nose Day started to help end child poverty. In 2015, the public charity, Comic Relief USA, launched the campaign in the U.S.
Last year, the Red Nose campaign raised $47 million, setting the total raised since 2015 to over $150 million, and have changed the lives of over 16 million children. These funds help buy vaccines and medical services, as well as meals, educational assistance and more. Half of the money raised supports programs in the 50 states and Puerto Rico, and the other half helps fund programs in Latin America, Africa, and Asia.
Companies like Bill and Melinda Gates Foundation, M&M’s, Mars Wrigley Confectionary, and NBC have supported the organization as national and programming partners. NBC will have a celebrity-filled Red Nose Day program planned at 8/7 c tonight.
We’ve supported Red Nose Day for the last two years through our philanthropic arm, Windermere Foundation, this year we were happy to give $1000, not to mention the red noses! We are proud to help organizations in our local and global communities who work to support low-income and homeless families. Please join us again this year in giving to this important campaign to end child poverty.
To participate, you can get your $2 Red Nose at your nearest Walgreens. Of that, $1.30 goes to the fund. The nose purchase is not tax deductible, but a donation made directly to them is. You can donate online athttps://donation.rednoseday.org/.
To learn more about the organization and who they help, and how you can participate, go to their website: https://rednoseday.org/home.
The last time we saw a balanced market was late 1990s, meaning many sellers and buyers have never seen a normal housing market. Windermere Real Estate’s Chief Economist Matthew Gardner looks at more longer-term averages, what does he see for the future of the housing market?
Modern home appliances make our lives so much easier: They tackle dreaded household chores, saving us time and effort. There are lots of ways to use them, however, that you may not have thought of before. Here are 13 little-known tricks for getting more than your money’s worth from your appliances.
Sanitize small toys and more. Use your dishwasher to wash and sanitize teething rings, small plastic toys, mouth guards, and even baseball caps. Place items on the top rack and run the dishwasher as usual with detergent (without any dirty dishes). Put smaller items in a small mesh laundry bag so that they don’t move around.
Clean ceiling fixtures. At least once or twice a year, remove and clean your glass ceiling fixtures and light covers in an empty dishwasher. Run the machine on the normal cycle.
Eliminate wrinklesfrom clothing. To smooth out wrinkled clothes or linens left too long in the dryer, toss a damp, lint-free cloth in with them. Run the load on the lowest setting for 10 to 15 minutes. Newer dryers also feature a steam setting that removes wrinkles and refreshes clothing between wears.
Disinfect sponges and dishcloths. Kitchen sponges and dishcloths contain billions of germs. Clean and disinfect them daily by zapping them on high in the microwave for 2 minutes to kill germs.
Freshen up your curtains. Vacuum heavy drapes with the upholstery attachment. Use the dusting brush attachment for lighter drapes. Wash sheer curtains in the washing machine on the delicate cycle, then hang them up while they’re damp to prevent wrinkles.
Remove wax from fabric or carpet. To get rid of wax on a tablecloth, place it in your freezer until the wax is hard. Then put a flat paper bag over the wax and another under the fabric. Iron the top bag with a medium-hot iron until all the wax transfers to the bag. To remove wax from a carpet or rug, place an ice pack on the spot until the wax hardens. Shatter the wax and vacuum up the chips.
Clean baseboards. Dusting baseboards can be a backbreaking chore. Use your vacuum cleaner and the dusting brush attachment to avoid having to bend down. Do the same to clean chair and table legs.
Organize your fridge. Use the built-in features of your refrigerator to organize food by category. Designate certain shelves or areas for leftovers, preferably front and center, so you don’t forget they’re in there. Use special-purpose bins for their intended use: crispers for vegetables, deli trays for deli meats and cheeses, cold storage trays for meats. Newer models also feature convertible cooling zones to keep food fresh.
Dust blinds. Extend the blinds fully and turn the slats to the closed position. Use the dusting brush attachment on your vacuum cleaner to clean the slats from top to bottom. Then open and reclose the slats in the opposite direction and repeat the process.
Clean your microwave. The best time to clean your microwave is immediately after using it. Thanks to residual steam, all you have to do is wipe it out with a paper towel or damp sponge. To clean old messes, microwave 2 cups of water on high for 5 minutes. The steam will soften cooked-on spills, which you can wipe off with a paper towel or cloth.
Exterminate dust mites. Dust mites live off human and animal dander and other household dust particles. They thrive in sofas, carpets, and bedding. Use the upholstery attachment to vacuum your mattress and upholstered furniture regularly to minimize dust mites. Be sure to empty the canister in an outdoor trashcan.
Groom your pet. After you’ve groomed your dog or cat, use the dusting brush attachment to clean up after. It’s an easy way to collect shedding fur, especially from carpetted areas or upholstery.
Remove grime from shower liners. Wash plastic shower curtain liners in the washing machine with hot water and detergent on the regular cycle. Throw in a small bath towel to help “scrub” mildew and soap scum off the liner. Then rehang the liner and let it air-dry.
Have you found any unusual cleaning hacks for your appliances? Share in the comments below!
The following analysis of select Maui real estate markets is provided by Windermere Real Estate Chief Economist Matthew Gardner. We hope that this information may assist you with making better-informed real estate decisions. For further information about the housing market in your area, please don’t hesitate to contact your Windermere agent.
ECONOMIC OVERVIEW
Hawaii’s economy continues to add jobs, but the rate of growth remains tepid. Over the past 12 months, the state added 3,200 new jobs, representing a growth rate of .5%. This lackluster growth may be due to the fact that the unemployment rate was a very healthy 2.7%.
On Maui, employment growth dropped 2.2% year-over-year, and has been contracting for the past 14 months. Even with this drop in employment, the unemployment rate was a healthy 2.8%, up from 2.2% a year ago. The unemployment rate may remain low, even given job losses, as the labor force continues to grow smaller. It is also worth noting that there are almost 3,600 job openings on Maui.
HOME SALES
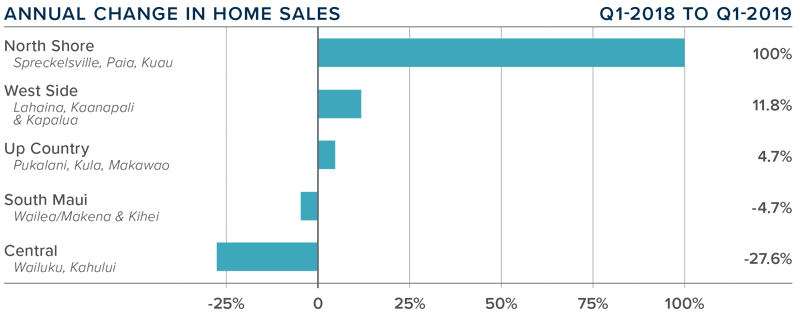
In the first quarter of 2019, 490 homes sold—a drop of 7.4% compared to the first quarter of 2018.
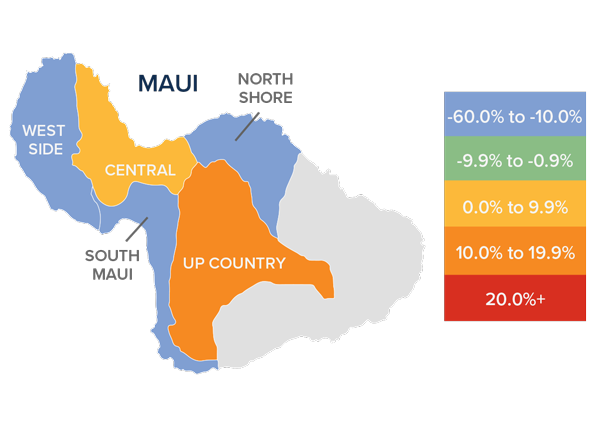
Three markets saw growth in sales over the first quarter of 2018: North Shore, the West Side, and Up Country. There was a significant decline in sales in the Central area.
The contraction in sales came as inventory levels dropped 7.3%. Three market areas saw listing inventories rise: Up Country, the Westside, and the Central area. Lower inventory levels were seen in South Maui and North Shore.
Pending home sales in the quarter were down 5.8% from a year ago but up 16% from the fourth quarter of 2018, suggesting that second quarter closings may be more positive.
HOME PRICES
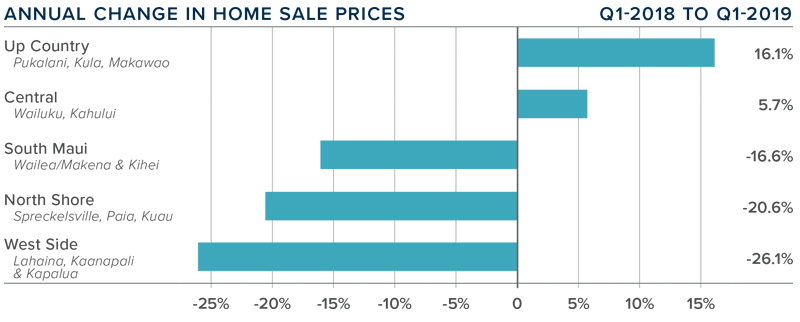
The average home price in the region dropped 9.9% year-over-year to $824,955.
Affordability is a significant issue on Maui, where average home prices in areas like Westside and Up Country are now above $1 million. I’m hopeful the recent drop in interest rates will stimulate more buyers. It’s worth noting that jumbo loan interest rates are also very competitive, which may help the higher-end markets.
Although the region saw an overall drop in average home prices, the Up Country area experienced an increase of 16.1%. One additional area saw prices rise year-over-year, while prices dropped in the remaining three markets.
Even given affordability constraints in many Maui market areas, I anticipate we will see home prices rise in 2019, though at fairly modest rates.
DAYS ON MARKET
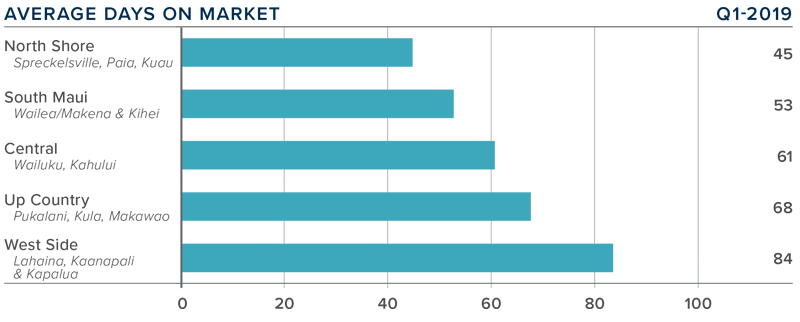
The average number of days it took to sell a home on Maui dropped two days compared to the first quarter of 2018.
The amount of time it took to sell a home dropped in two markets: South Maui and the Westside. Market time rose in the rest of the markets.
In the first quarter, it took an average of 62 days to sell a home. The fastest-moving market was North Shore and the slowest was the Westside.
The drop in days on market suggests a healthy demand for housing, despite the slowing pace of home sales. I anticipate we will see modestly rising activity as we move through 2019.
CONCLUSIONS
This speedometer reflects the state of the region’s real estate market using housing inventory, price gains, home sales, interest rates, and larger economic factors.
For the first quarter of 2018, I have moved the needle a little more in favor of buyers but the market is not yet at equilibrium, even given the drop in sales and lower home prices. Though the market is in need of more inventory, I remain positive about the longer-term outlook for home prices and demand on Maui.
As Chief Economist for Windermere Real Estate, Matthew Gardner is responsible for analyzing and interpreting economic data and its impact on the real estate market on both a local and national level. Matthew has over 30 years of professional experience both in the U.S. and U.K.
In addition to his day-to-day responsibilities, Matthew sits on the Washington State Governors Council of Economic Advisors; chairs the Board of Trustees at the Washington Center for Real Estate Research at the University of Washington; and is an Advisory Board Member at the Runstad Center for Real Estate Studies at the University of Washington where he also lectures in real estate economics.
The following analysis of the Big Island real estate market is provided by Windermere Real Estate Chief Economist Matthew Gardner. We hope that this information may assist you with making better-informed real estate decisions. For further information about the housing market in your area, please don’t hesitate to contact your Windermere agent.
ECONOMIC OVERVIEW
Hawaii’s economy continues to add jobs, but the rate of growth is tepid. Over the past 12 months, Hawaii added just 1,400 new jobs, representing a growth rate of 0.2%. Even with this lack of job formation, the state has a very healthy 2.8% unemployment rate.
On the Big Island, year-over-year employment dropped 4.7% to 84,600 persons and has been negative for the past eight months. The unemployment rate was a respectable 3.7%, up from 2.6% a year ago. As stated in the last Gardner Report, the Island continues to see its civilian workforce contract and this may be a reason for the lack of job growth. Notably, there are over 3,900 job openings on the Big Island. Additionally, the area is still recovering from the 2018 volcanic eruption which hit the Island’s economy very hard.
HOME SALES
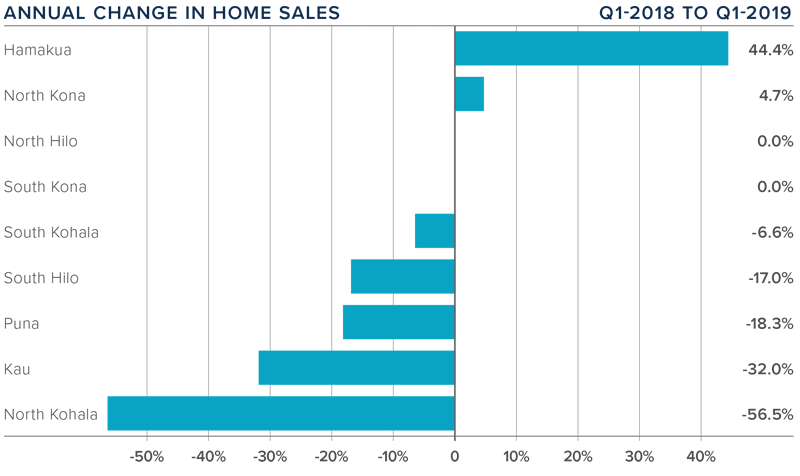
In the first quarter of 2019, 689 homes traded hands, a drop of 10.4% compared to the first quarter of 2018 and 5.9% lower than the fourth quarter of 2018.
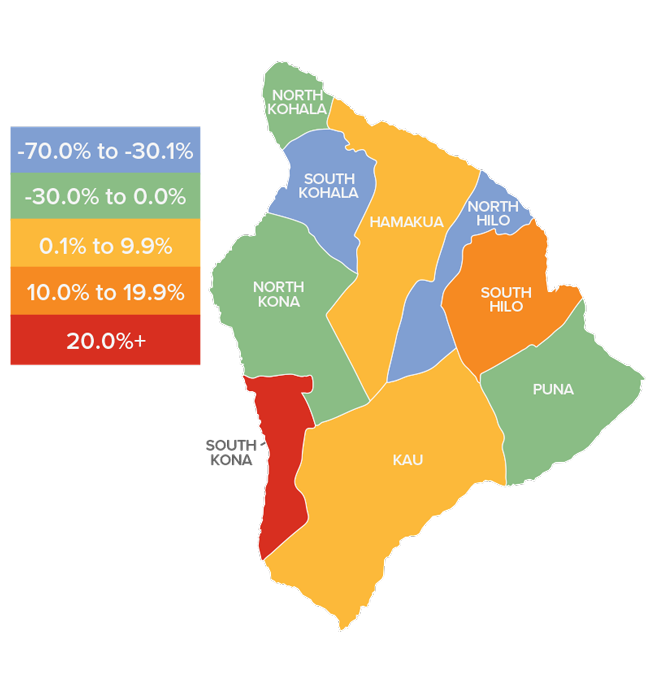
The only markets that saw growth in sales were Hamakua and North Kona, which rose by a very significant 44% and 4.7% respectively. There was a significant decline in sales in North Kohala, but it is a very small market and the 56.5% drop equated to a loss of only 13 sales.
The regional drop in sales came as inventory levels rose 15.4% from a year ago and 11.2% from the fourth quarter of 2018. There may well be some hangover from the 2018 volcanic eruption, but that reason might be growing stale. I will continue to monitor the data as we move through 2019 to see if this is still the case or if there are other reasons for the contraction.
Inventories rose in six of the markets analyzed: North Kohala, South Hilo, North and South Kona, Kau, and Puna. South Kohala, Hamakua, and North Hilo saw modest drops. Buyers have more choice and continue to be far more selective — and patient — in making an offer on a home.
HOME PRICES
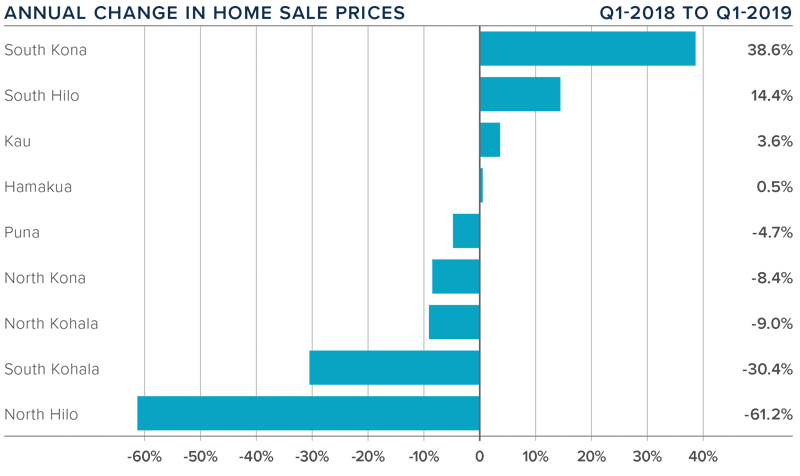
The average home price in the region dropped 7.1% year-over-year to $541,135.
Affordability is still an issue, but the current low interest rate environment may stimulate buyers as we move through the later spring season. I expect to see prices start to pick up, but at fairly modest rates.
Appreciation was strongest in the South Kona market, where prices rose by 38.6%—again, a function of it being a very small area with limited sales. Three additional areas saw prices rise between the first quarter of 2018 and the first quarter of 2019, and five markets saw average sale prices drop.
Despite ongoing affordability issues in many Big Island market areas, I still expect home prices to rise in 2019.
DAYS ON MARKET
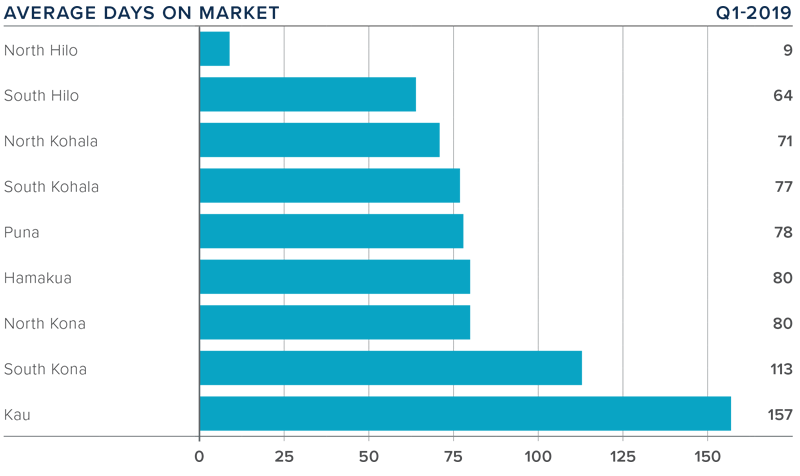
The average time it took to sell a home on the Big Island dropped 22 days compared to the first quarter of 2018.
Notably, the amount of time it took to sell a home dropped across the board.
In the first quarter, it took an average of 81 days to sell a home. Homes sold fastest in North Hilo and slowest in Kau.
The recent drop in mortgage interest rates will likely continue to stimulate demand as we move through 2019.
CONCLUSIONS
This speedometer reflects the state of the region’s real estate market using housing inventory, price gains, home sales, interest rates, and larger economic factors.
For the first quarter of 2019, I have placed the needle close to the middle. Although we saw a decline in sales and prices compared to the first quarter of 2018, I anticipate prices will rise as inventory levels — although trending higher — will not be sufficient to meet demand. Locational attributes will be increasingly important in the coming year as buyers become more selective than we have seen in quite some time. Additionally, the market may take a pause until home buyers get more clarity regarding Bill 108, which could have a substantial effect on investors who are purchasing vacation rental properties.
As Chief Economist for Windermere Real Estate, Matthew Gardner is responsible for analyzing and interpreting economic data and its impact on the real estate market on both a local and national level. Matthew has over 30 years of professional experience both in the U.S. and U.K.
In addition to his day-to-day responsibilities, Matthew sits on the Washington State Governors Council of Economic Advisors; chairs the Board of Trustees at the Washington Center for Real Estate Research at the University of Washington; and is an Advisory Board Member at the Runstad Center for Real Estate Studies at the University of Washington where he also lectures in real estate economics.
Working from home is an aspiration for many of us, but to do so effectively takes effort. A disorganized space at home can be just as troublesome as a hectic office. The most disciplined telecommuters will tell you that you need a structured routine and organization to get into work mode.
Having a designated workspace helps you set the tone for your day. Even if you live in a small space, you need to find a balance between home and office. People who work from home often have a difficult time separating work hours from their non-work hours because it's so easy to continue working late into the night. However, maintaining a balance and shutting down the computer is important for your overall wellbeing. These five tips can help you create the perfect home office:
Natural Light – Study upon study tells us that natural light is needed to boost productivity and mood. Make sure to set your desk up as close to a window as you can. If being near a window isn’t an option, a natural light lamp is the next best thing. It helps balance your body clock and leaves you feeling rested and refreshed.
To-Do List or Planner – Start each day off by making a to-do list outlining what you need to get done before the end of the workday. Make sure to set a realistic time frame in which all of that should be completed, so you can check each one off the list and feel immense accomplishment once you've completed them all.
Storage – If you have a big enough space, put in a large bookshelf where you can organize everything (think storage boxes). It reduces clutter and looks stylish. Using your walls and cabinetry is the most efficient use of space.
Calendar – Many people tend to rely on digital calendars these days because of their convenience. When all of your devices sync together and pop up with reminders, you never have to worry about missing an appointment. However, many people find that it helps to keep a paper calendar handy too so you can easily view your whole month at a glance.
Space for Inspiration – It doesn't matter what field you work in, having a source of inspiration in your workspace is essential. Whether it's a photo of your family, your dream car, or that vacation you've been dying to take, having that inspiration right in front of you provides a constant reminder of why you do what you do.
The following analysis of select Montana real estate markets is provided by Windermere Real Estate Chief Economist Matthew Gardner. We hope that this information may assist you with making better-informed real estate decisions. For further information about the housing market in your area, please don’t hesitate to contact your Windermere agent.
ECONOMIC OVERVIEW
Over the past 12 months, Montana has added 4,800 new non-agricultural jobs. This represents an annual growth rate of a modest 0.9%, which is lower than the national growth rate of 1.7%. In the first quarter of the year, the state lost 1,300 non-agricultural jobs, which was a disappointment, but I remain hopeful we will see some improvement as we move through the balance of the year. My 2019 forecast still suggests the state will see non-farm employment rise 1.2%, or an additional 5,800 new jobs. In March, the state unemployment rate was a healthy 3.7%, matching the level seen a year ago.
HOME SALES
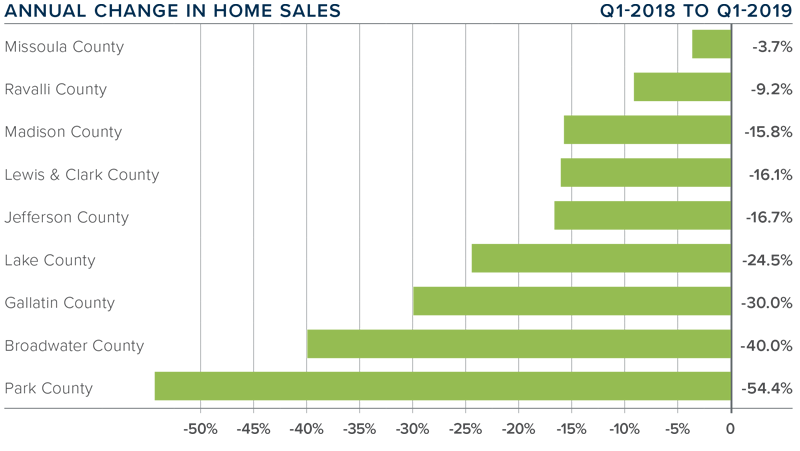
In the first quarter of 2019, 825 homes sold, a drop of 25% over the same period in 2018.
Sales activity fell across the board, with the largest annual drop in small Park County, where sales were down 54.4%.
The number of homes for sale is still well below the levels I would like to see, with an average of 1,092 listings in the first quarter within the counties contained in this report.
Clearly, inventory levels continue to hold sales back. I am still hopeful that the late spring market will bring an increase in listings, but the growth is likely to be modest.
HOME PRICES
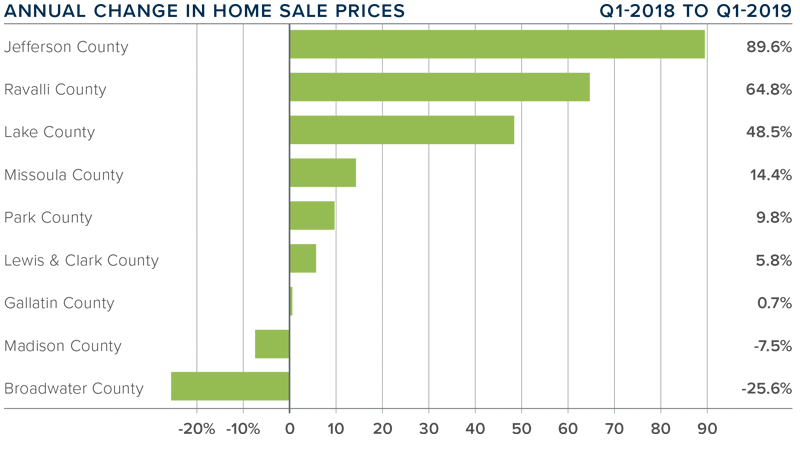
The average home price in the region continued to rise in first quarter, with a year-over-year increase of 1.5% to $406,540.
Jefferson and three other counties experienced double-digit price increases compared to a year ago. Average sale prices dropped in two counties. Small Broadwater County saw the biggest price drop, but this is a function of the size of the market and the relatively few transactions that occur there.
Price appreciation was strongest in Jefferson County, where home prices rose by almost 90%. This is a very small area, though, and wild swings in prices are not that uncommon.
The takeaway from this data is that prices continue to rise modestly but housing affordability is likely acting as a headwind to more robust price growth.
DAYS ON MARKET
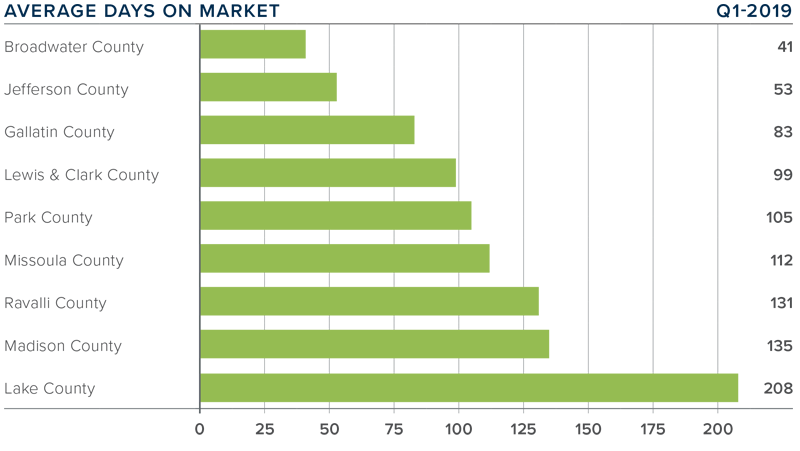
The average number of days it took to sell a home rose eight days compared to the first quarter of 2018.
Homes sold fastest in Broadwater County and slowest in Lake County. Five counties — Missoula, Lewis & Clark, Broadwater, Jefferson, and Madison — saw days on market drop compared to the first quarter of 2018.
During the first quarter of 2019, it took an average of 107 days to sell a home in the region.
The takeaway here is that market time is rising, which is likely due to limited choice as well as lower affordability levels.
CONCLUSIONS
This speedometer reflects the state of the region’s real estate market using housing inventory, price gains, home sales, interest rates, and larger economic factors.
For the first quarter of 2019, I have moved the needle a little further toward buyers. Mortgage rates dropped significantly in the first quarter and this, to a degree, helps home buyers offset affordability issues. Additionally, current list prices are likely holding back many prospective buyers, so I wouldn’t be surprised to see prices moderate in the coming months. As always, pricing homes accurately will be key to attracting buyers.
As Chief Economist for Windermere Real Estate, Matthew Gardner is responsible for analyzing and interpreting economic data and its impact on the real estate market on both a local and national level. Matthew has over 30 years of professional experience both in the U.S. and U.K.
In addition to his day-to-day responsibilities, Matthew sits on the Washington State Governors Council of Economic Advisors; chairs the Board of Trustees at the Washington Center for Real Estate Research at the University of Washington; and is an Advisory Board Member at the Runstad Center for Real Estate Studies at the University of Washington where he also lectures in real estate economics.
The following analysis of the Oregon and Southwest Washington real estate market is provided by Windermere Real Estate Chief Economist Matthew Gardner. We hope that this information may assist you with making better-informed real estate decisions. For further information about the housing market in your area, please don’t hesitate to contact your Windermere agent.
ECONOMIC OVERVIEW
Oregon added 29,500 new jobs over the past 12 months, representing an annual growth rate of 1.5%. The current pace of job growth continues the slowdown that started in mid-2018. I am not overly concerned by this slowdown in growth, as it is typical for this stage in the economic cycle.
The Southwest Washington market (Clark, Cowlitz, Skamania, and Klickitat counties) added 4,490 new jobs over the past 12 months, which represents an annual growth rate of 2.1%.
Oregon’s unemployment rate was 4.4% in February, up from 4.2% a year ago. In Southwest Washington, the unemployment rate was 5.5%, down from 5.9% in February of 2018.
HOME SALES
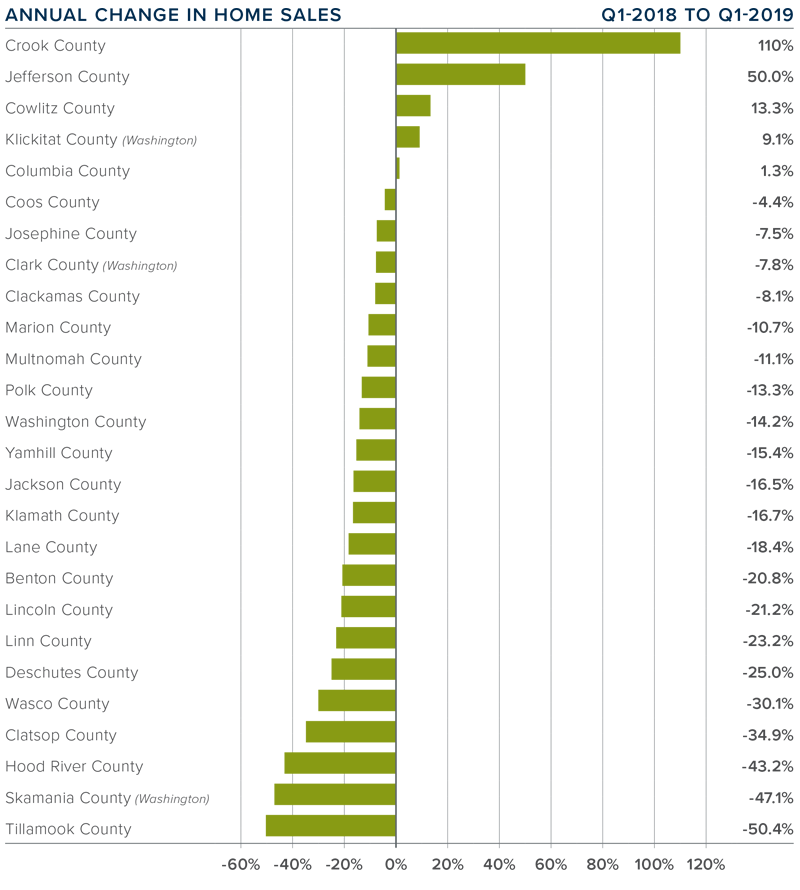
First quarter home sales dropped 13.1% compared to the same period last year, with a total of 10,516 transactions.
Year-over-year sales rose in five counties, remained static in one, but dropped in the other 21 counties contained in this report.
Sales rose the most in Crook County, which saw a massive 110% increase compared to the first quarter of 2018, though this was an increase of only 11 sales. There were also solid increases in Jefferson and Cowlitz counties. Home sales fell the most in the small Tillamook, Skamania, and Hood River counties.
Sales in the first quarter were clearly a disappointment, but I don’t believe this is a systemic drop in demand. I am confident the spring will bring more buyers and sales will pick back up in many markets.
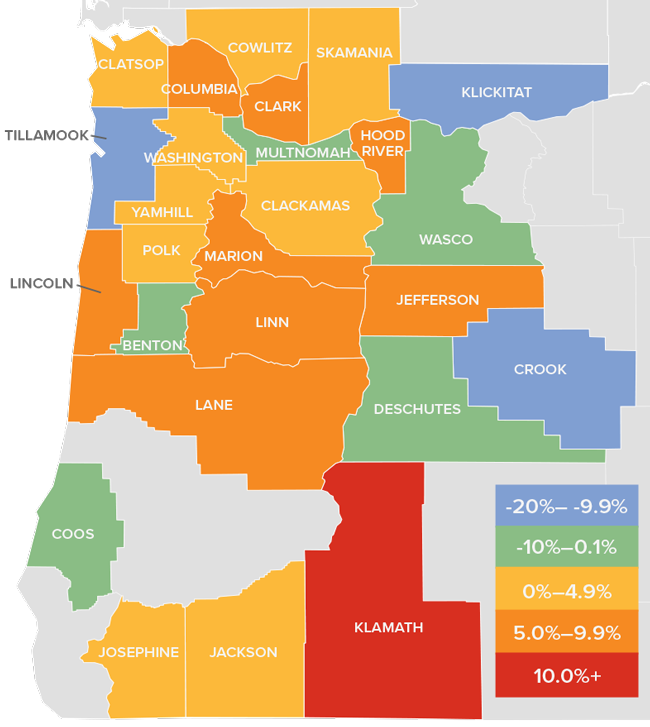
HOME PRICES
The average home price in the region rose 2.2% year-over-year to $369,721, but the market saw a drop of 1.4% compared to the fourth quarter of 2018.
Eighteen of the counties contained in this report experienced price growth compared to the first quarter of 2018. Eight counties saw price contractions.
Klamath County led the market with the strongest annual price growth. Homes there sold for 11.1% more than a year ago. Crook, Tillamook, and Klickitat counties experienced the largest drop in home prices, but these are small counties, making them more prone to significant swings.
The takeaway is that price growth continues to moderate, but I expect it to pick up in the second quarter given the drop in interest rates earlier this year.
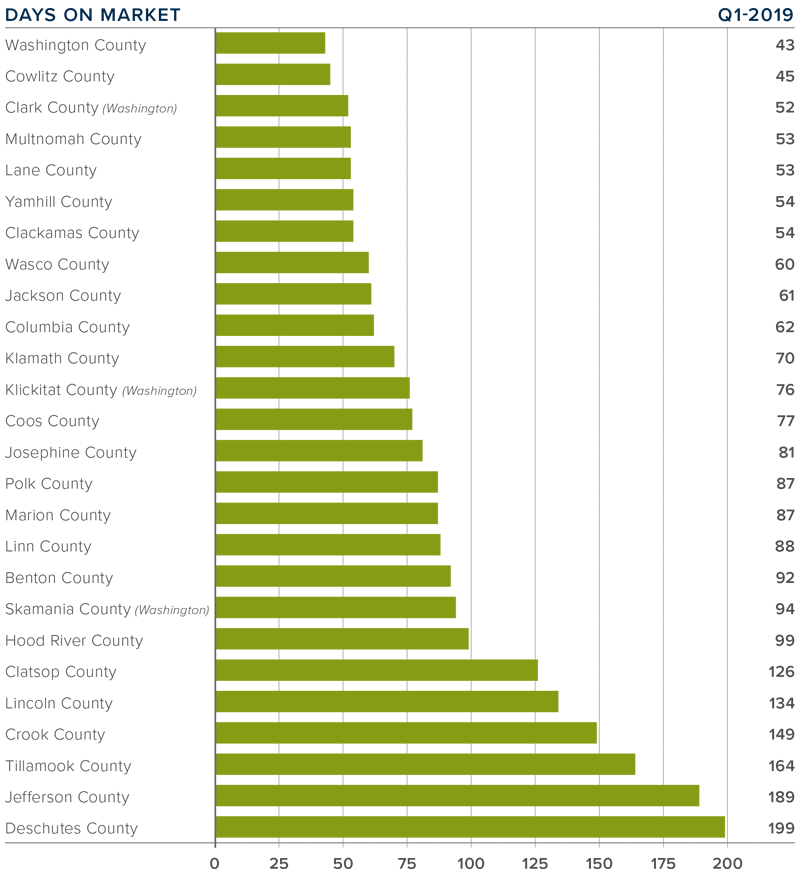
DAYS ON MARKET
The average number of days it took to sell a home in the region dropped 3 days compared to a year ago, but was up by 16 days compared to the final quarter of 2018.
Twelve counties saw the length of time it took to sell a home drop compared to a year ago. Fourteen counties saw market time rise.
The average time it took to sell a home last quarter was 90 days.
Homes again sold the fastest in Washington (43 days) and Cowlitz (45 days) counties.
CONCLUSIONS
The speedometer reflects the state of the region’s real estate market using housing inventory, price gains, home sales, interest rates, and larger economic factors.
I believe listing inventories will continue to rise as we move through the spring months. We will also see more buyers start their search for a new home to take advantage of the drop in interest rates. With all of this in mind, I have moved the needle further toward buyers because they have more choice and price growth has slowed. That said, in aggregate, the market still favors home sellers.
As Chief Economist for Windermere Real Estate, Matthew Gardner is responsible for analyzing and interpreting economic data and its impact on the real estate market on both a local and national level. Matthew has over 30 years of professional experience both in the U.S. and U.K.
In addition to his day-to-day responsibilties, Matthew sits on the Washington State Governors Council of Economic Advisors; chairs and the Board of Trustees at the Washington Center for Real Estate Research at the University of Washington; and is an Advisory Board Member at the Runstad Center for Real Estate Studies at the University of Washington where he also lectures in real estate economics.
The following analysis of select counties of the Idaho real estate market is provided by Windermere Real Estate Chief Economist Matthew Gardner. We hope that this information may assist you with making better-informed real estate decisions. For further information about the housing market in your area, please don’t hesitate to contact your Windermere agent.
ECONOMIC OVERVIEW
Job growth in Idaho continues to moderate. The state added 19,400 new jobs over the past 12 months, representing an annual growth rate of 2.7%. That said, the growth rate remains well above the national average of 1.7%. In March, Idaho’s unemployment rate was 2.9%, matching the level seen a year ago. The state remains at full employment, and it’s worth noting that the employment rate remained below 3% even as the labor force rose by 2%. This suggests the economy remains very strong as there are still job openings to accommodate new workers. Idaho continues to outperform the nation in terms of economic vitality and will continue to do so for the balance of the year.
HOME SALES
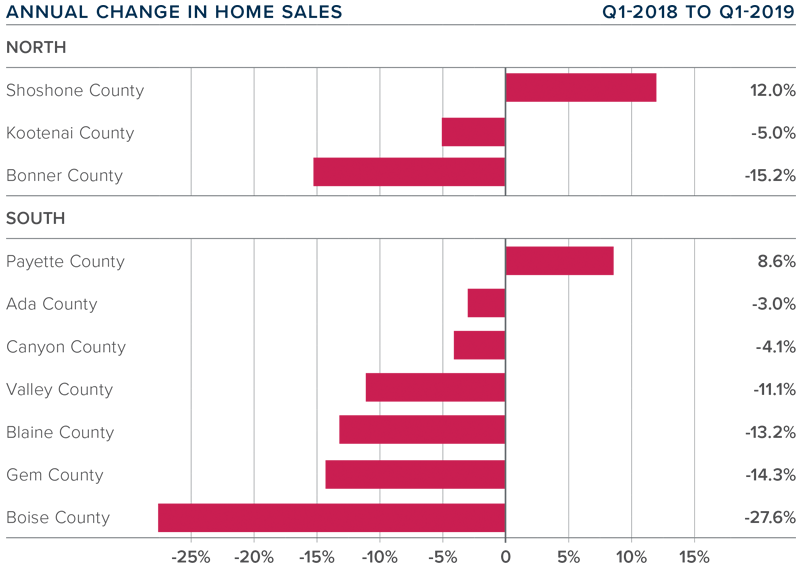
4,440 homes were sold during the first quarter of 2019, representing a drop of 4.3% compared to the first quarter of 2018.
In Northern Idaho, Shoshone County was alone in experiencing sales growth, with an increase of 12% over the first quarter of 2018. There was a substantial drop of more than 15% in Bonner County, but this is a small area, making it prone to significant swings. In Southern Idaho, we saw modest sales growth in Payette County, modest declines in Canyon and Ada counties, and significantly lower sales in the small area of Boise County.
Year-over-year sales growth was positive in just one Northern Idaho market, and only one of the Southern Idaho markets saw sales rise relative to the same period a year ago.
When compared to the first quarter of 2018, the number of homes for sale was lower across the board in Northern Idaho and in most Southern Idaho market areas. It’s likely that this contributed to the decline in sales.
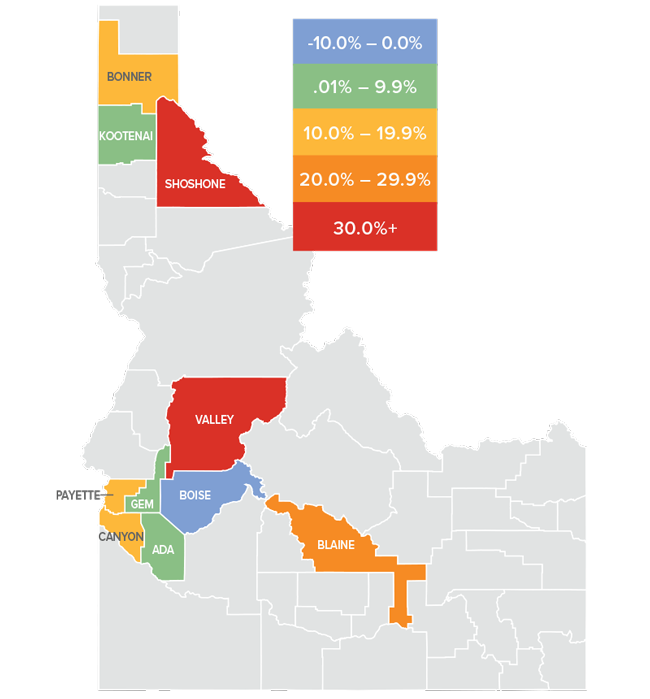
HOME PRICES
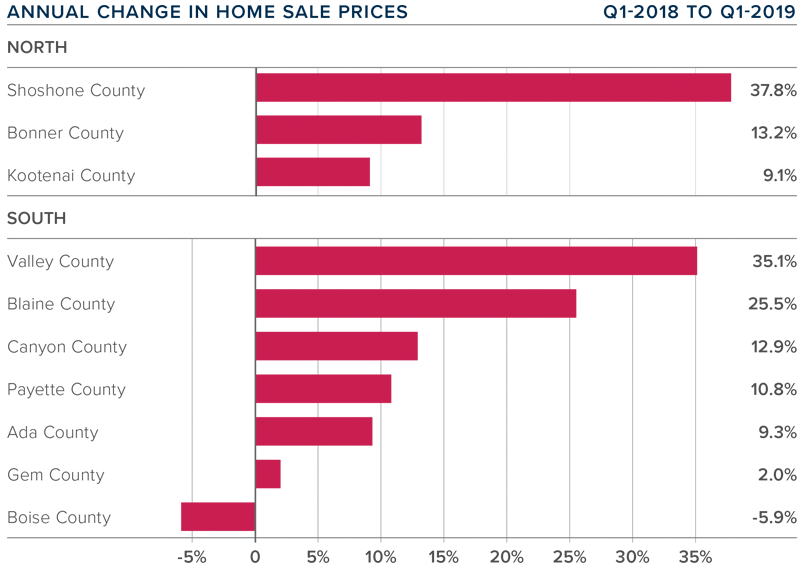
The average home price in the region rose 10.7% year-over-year to $347,153.
In Northern Idaho, Shoshone County again led the market with the strongest annual price growth. Both Bonner and Kootenai counties also saw solid, double-digit appreciation. In Southern Idaho, small Valley County saw prices rise a very significant 35.1%, but this is an anomaly.
There were price increases in all but one county compared to the first quarter of 2018. The outlier was Boise County, where sales prices dropped by 5.9%. Boise County is a very small market that can experience significant swings, so I’m not concerned about this decline.
Limited levels of inventory continue to drive up home prices at above-average rates. I believe we’ll see more homes come on the market in the late spring, hopefully starting a trend toward a more balanced housing market.
DAYS ON MARKET
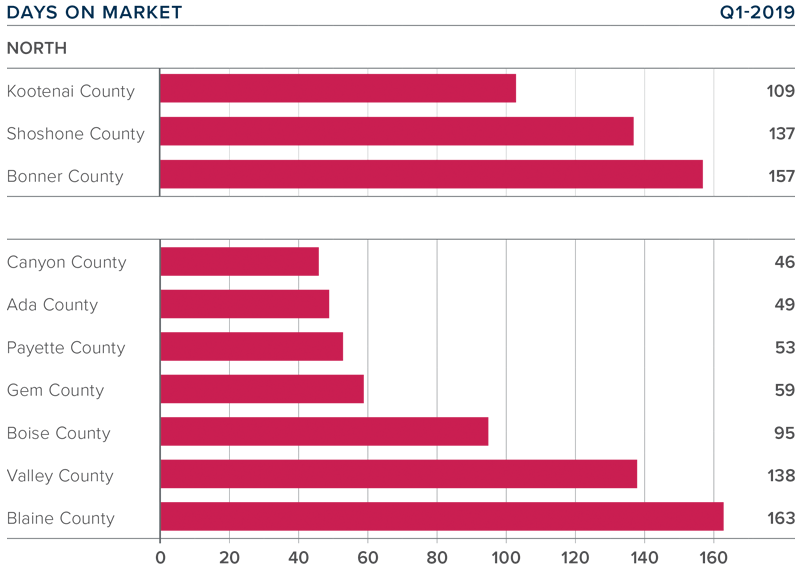
It took an average of 134 days to sell a home in Northern Idaho, and 86 days in the southern part of the state.
The average number of days it took to sell a home in the region dropped 5 days compared to the first quarter of 2018 but was up 20 days compared to the final quarter of 2018.
In Northern Idaho, days on market dropped in Kootenai County, but market time rose in the other two counties covered by this report. In Southern Idaho, market time dropped in all but Ada and Blaine counties, but the rise was very modest.
Homes again sold the fastest in Canyon and Ada counties, where it took an average of 46 and 49 days, respectively.
CONCLUSIONS
The speedometer reflects the state of the region’s housing market using housing inventory, price gains, home sales, interest rates, and larger economic factors.
Job growth has slowed from the frenetic pace of 2018, but continued economic growth will lead businesses to hire new workers. This economic vitality is certain to result in ongoing demand for homeownership. Home sales are lower than I would like, but I remain confident that inventory levels will rise in the spring months, providing more choice for buyers.
I expect the number of homes for to sale rise but, until we see that in the data, it remains a sellers’ market, so I have moved the needle just a little more in their direction.
As Chief Economist for Windermere Real Estate, Matthew Gardner is responsible for analyzing and interpreting economic data and its impact on the real estate market on both a local and national level. Matthew has over 30 years of professional experience both in the U.S. and U.K.
In addition to his day-to-day responsibilities, Matthew sits on the Washington State Governors Council of Economic Advisors; chairs the Board of Trustees at the Washington Center for Real Estate Research at the University of Washington; and is an Advisory Board Member at the Runstad Center for Real Estate Studies at the University of Washington where he also lectures in real estate economics.
The following analysis of the Central Washington real estate market is provided by Windermere Real Estate Chief Economist Matthew Gardner. We hope that this information may assist you with making better-informed real estate decisions. For further information about the housing market in your area, please don’t hesitate to contact your Windermere agent.
ECONOMIC OVERVIEW
Washington State employment slowed to an annual growth rate of 1.7% — a level not seen since 2012 — and continues a trend of slowing that started in the summer of 2018. Over the past 12 months, the state added 56,100 new jobs. Month-over-month, all metropolitan areas in the state either saw the number of jobs contract or remain at their existing levels. This is a little unusual and may be due to the state re-benchmarking their data. As such, I am not overly concerned about the numbers but will be watching to see if this trend continues as we move through the spring months.
The state unemployment rate was 4.5%, marginally below the 4.6% level a year ago. On a seasonally adjusted basis, the counties within Central Washington added 6,439 new jobs over the past 12 months, representing a solid growth rate of 2.8%. The local unemployment rate rose when compared to a year ago, from 6% to 6.7%, but this is a result of increases in the labor force.
HOME SALES
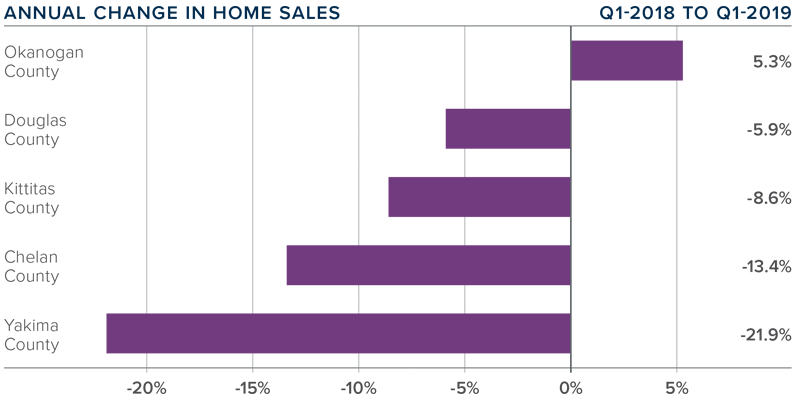
In the first quarter of 2019, home sales throughout Central Washington fell by 13.7%, with a total of 755 homes sold, and were 44.6% lower than the fourth quarter of 2018.
Sales rose in Okanogan County, which saw an increase of 5.3% over the first quarter of 2018. Yakima and Chelan counties saw sales activity slow the most.
The number of pending home sales — an indicator of future closings — was down 22% compared to the fourth quarter, indicating that closings will likely drop further in the second quarter of 2019.
Listing activity was a mixed bag when compared to a year ago, with significant increases in Kittitas and Chelan counties but declines in the balance of the region. That said, I expect stronger sales as we move through the spring because the drop in interest rates will get buyers off the fence.
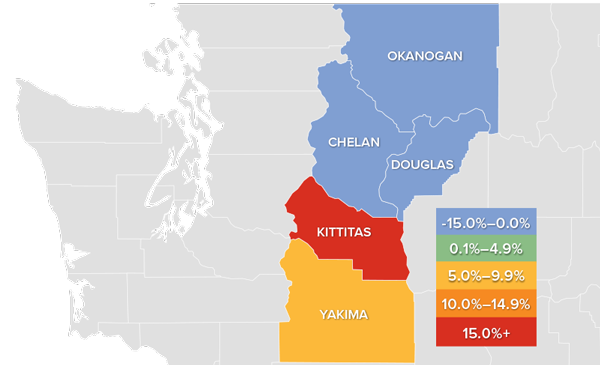
HOME PRICES
Year-over-year, the average home price in the region rose 6.4% to $310,386. Price growth has been trending well above the long-term average, but the data suggests we are starting to see some softening in the market. It is likely that price growth will continue to cool — but not turn negative — as we move through 2019.
Although prices declined in Okanogan, Chelan, and Douglas counties, I am not particularly worried as these are all relatively small markets where prices can see major swings.
Prices rose in Kittitas and Yakima counties but fell in the rest of the region compared to the first quarter of 2018. Regionwide, home prices were down 6.5% compared to the final quarter of 2018.
In aggregate, home-price growth has slowed, but the winter months can be inconsistent. I would not be surprised to see a jump in prices in the second quarter as the weather improves and interest rates remain low.
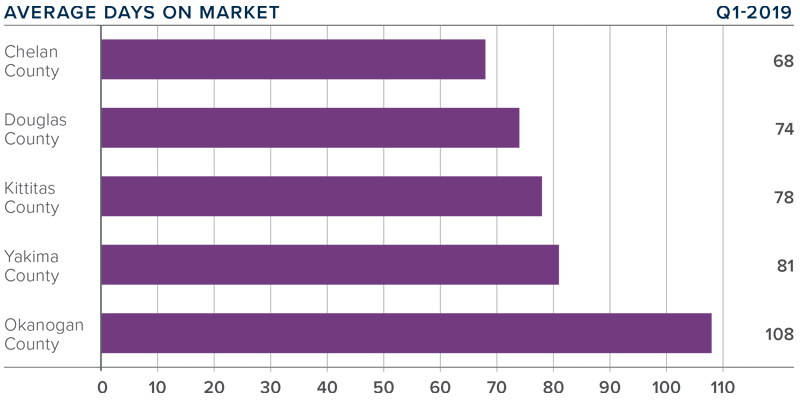
DAYS ON MARKET
The average number of days it took to sell a home in Central Washington rose three days compared to the first quarter of 2018.
The average time it took to sell a home in the region was 82 days, up 11 days when compared to the fourth quarter of 2018.
Two markets contained in this report — Okanogan and Yakima — saw days-on-market drop from the same quarter in 2018. The balance of the region took slightly longer to sell a home.
Homes sold fastest in Chelan County, where it took an average of 68 days to sell a home. The greatest drop in the time it took to sell a home was in Yakima County, where it took 13 fewer days than in the first quarter of 2018.
CONCLUSIONS
This speedometer reflects the state of the region’s real estate market using housing inventory, price gains, home sales, interest rates, and larger economic factors.
For the first quarter of 2018, I have moved the needle a little more in favor of buyers. Inventory levels remain low, but I anticipate this will change. This, in concert with moderating price growth and very favorable interest rates, will continue to favor home buyers in the coming months.
As Chief Economist for Windermere Real Estate, Matthew Gardner is responsible for analyzing and interpreting economic data and its impact on the real estate market on both a local and national level. Matthew has over 30 years of professional experience both in the U.S. and U.K.
In addition to his day-to-day responsibilities, Matthew sits on the Washington State Governors Council of Economic Advisors; chairs the Board of Trustees at the Washington Center for Real Estate Research at the University of Washington; and is an Advisory Board Member at the Runstad Center for Real Estate Studies at the University of Washington where he also lectures in real estate economics.

 Facebook
 X
X
 Pinterest
 Copy Link


 This speedometer reflects the state of the region’s real estate market using housing inventory, price gains, home sales, interest rates, and larger economic factors.
 As Chief Economist for Windermere Real Estate, Matthew Gardner is responsible for analyzing and interpreting economic data and its impact on the real estate market on both a local and national level. Matthew has over 30 years of professional experience both in the U.S. and U.K.
 This speedometer reflects the state of the region’s real estate market using housing inventory, price gains, home sales, interest rates, and larger economic factors.


 This speedometer reflects the state of the region’s real estate market using housing inventory, price gains, home sales, interest rates, and larger economic factors.


 As Chief Economist for Windermere Real Estate, Matthew Gardner is responsible for analyzing and interpreting economic data and its impact on the real estate market on both a local and national level. Matthew has over 30 years of professional experience both in the U.S. and U.K.
 The speedometer reflects the state of the region’s housing market using housing inventory, price gains, home sales, interest rates, and larger economic factors.
 Year-over-year, the average home price in the region rose 6.4% to $310,386. Price growth has been trending well above the long-term average, but the data suggests we are starting to see some softening in the market. It is likely that price growth will continue to cool — but not turn negative — as we move through 2019.
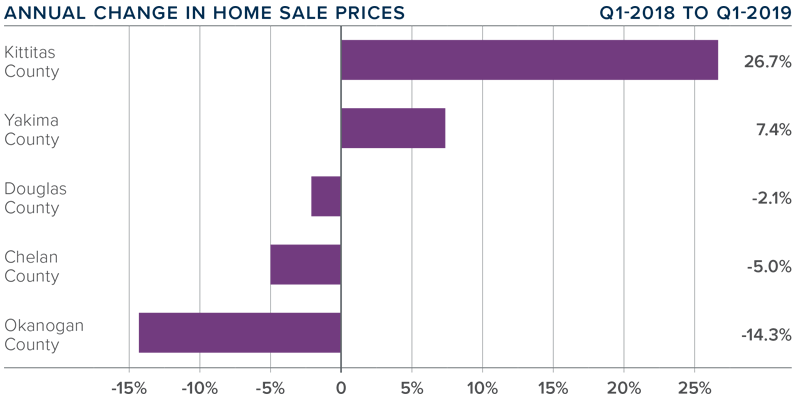
 This speedometer reflects the state of the region’s real estate market using housing inventory, price gains, home sales, interest rates, and larger economic factors.
")


