
 Facebook
 X
X
 Pinterest
 Copy Link

The following analysis of the Northern California real estate market is provided by Windermere Real Estate Chief Economist Matthew Gardner. We hope that this information may assist you with making better-informed real estate decisions. For further information about the housing market in your area, please don’t hesitate to contact your Windermere Real Estate agent.
Regional Economic Overview
New COVID-19 cases remain elevated across most of California, which continues to temper job recovery. The region has recovered 258,000 of the jobs that were lost, but there is still a ways to go. Although the number of jobs returning has slowed, the region’s unemployment rate continues to tick lower and now stands at 6.1%, down from the pandemically induced peak of 14%. By county, the lowest jobless rate was in Santa Clara County (5.1%), and highest in Solano County, where 7.8% of the workforce remains unemployed. The bottom line is that an economic recovery is in place, but persistently high COVID-19 infection rates continue to act as a headwind.
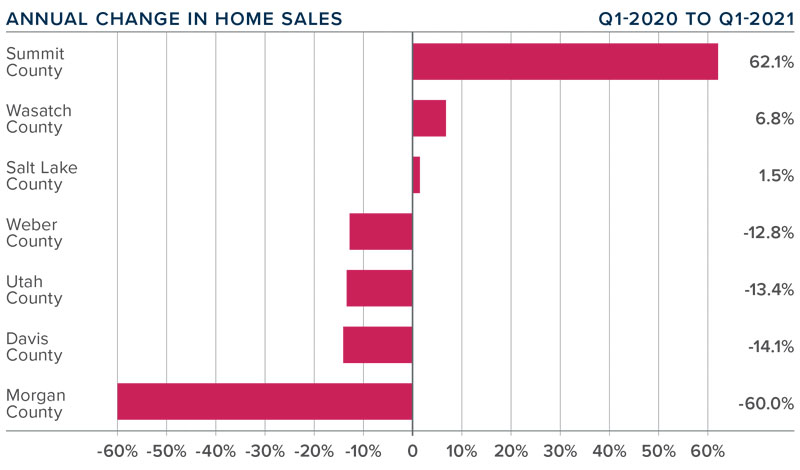
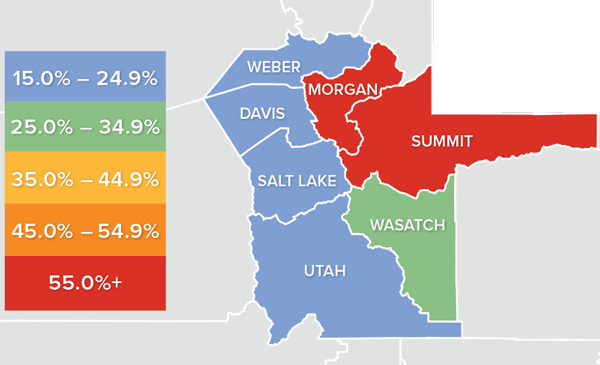
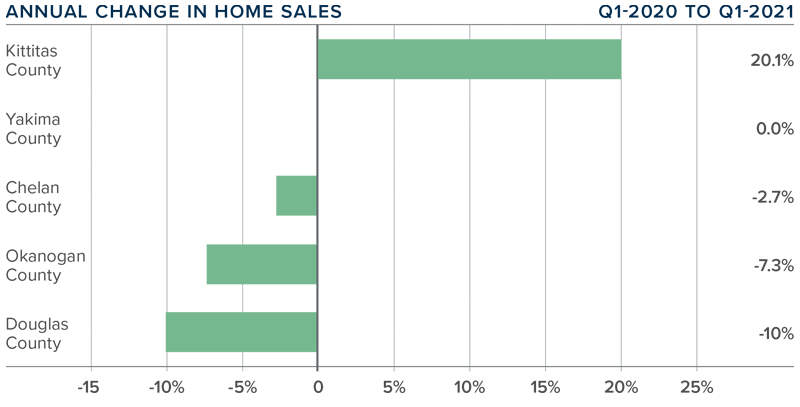
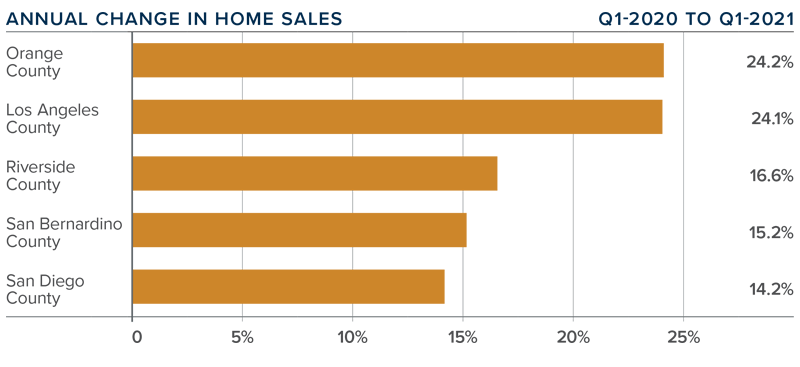
northern california Home Sales
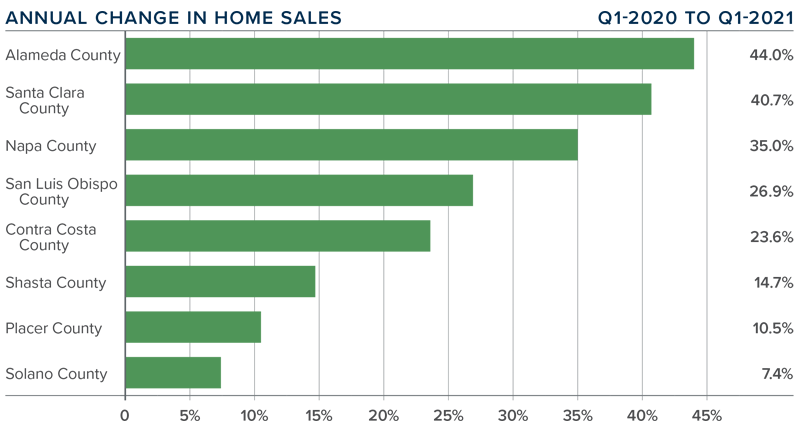
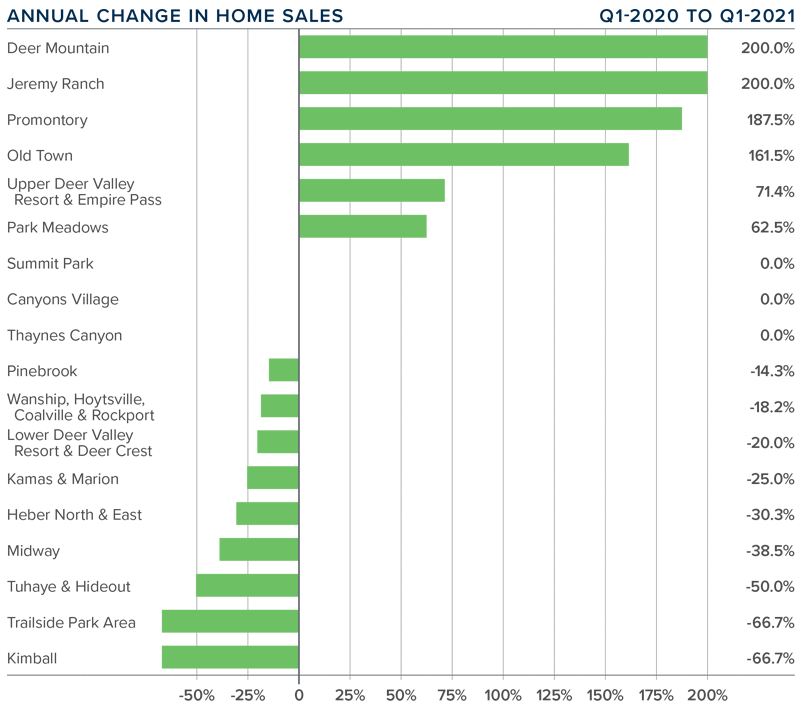
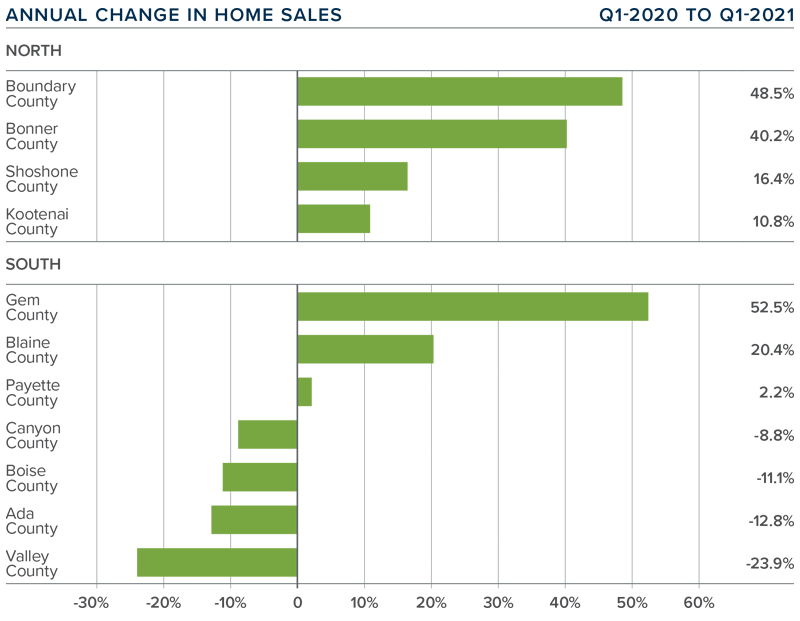
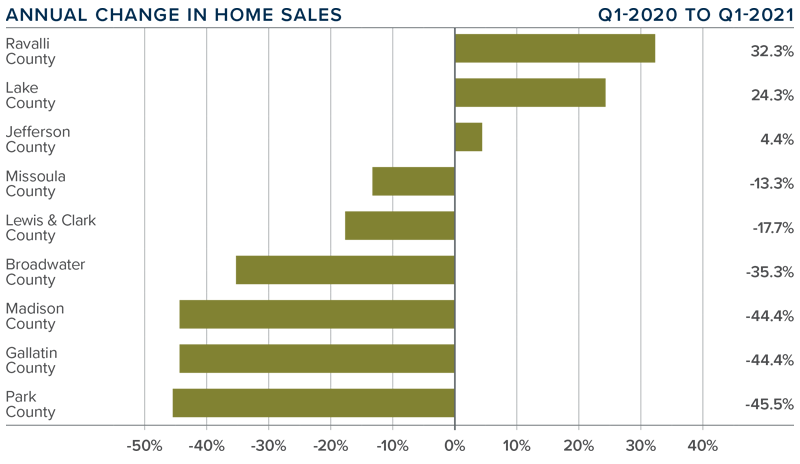
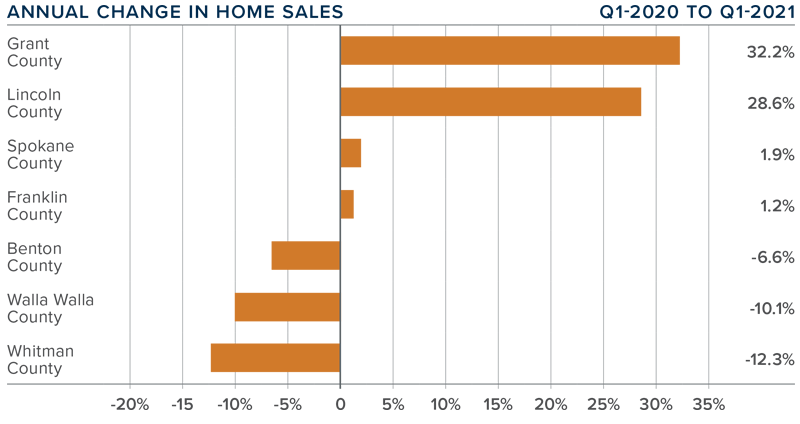
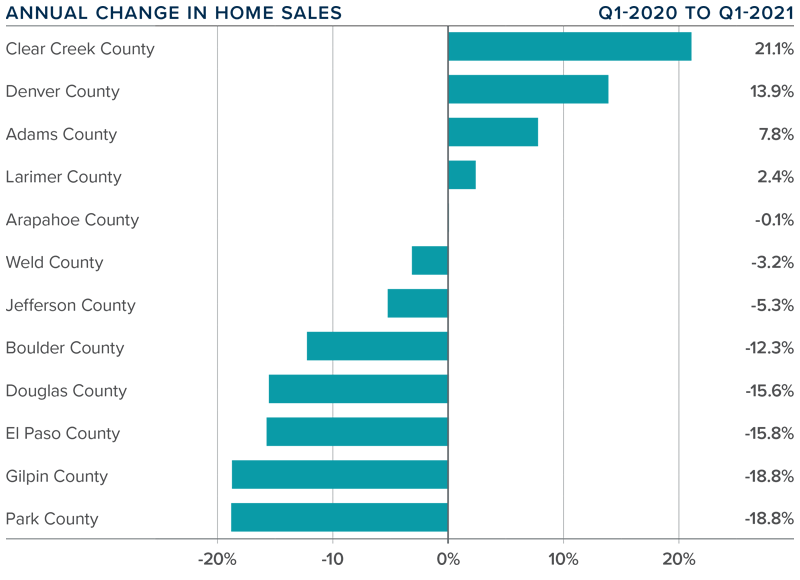
❱ In the first quarter of 2021, 10,876 homes sold, an increase of 30.4% over to the same period a year ago. Sales were 24.2% lower than in the fourth quarter of 2020.
❱ The quarterly decline in sales can mostly be attributed to very low levels of inventory. Listing activity was down 21.5% compared to the fourth quarter of 2020. This lack of homes for sale will continue to slow sales.
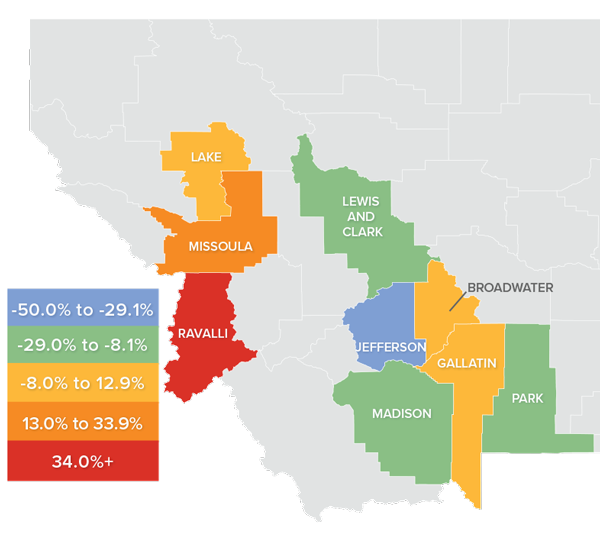
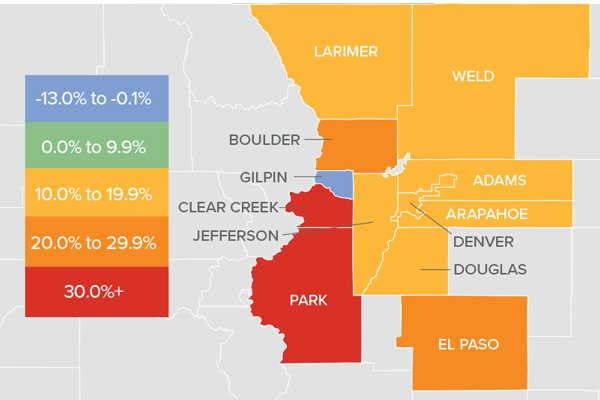
❱ Year-over-year, sales rose in all counties contained in this report, with double-digit growth in all areas other than Solano County.
❱ Pending home sales eked out a .2% increase compared to the previous quarter, which tells me that closings in the second quarter of 2021 may only show a little improvement.
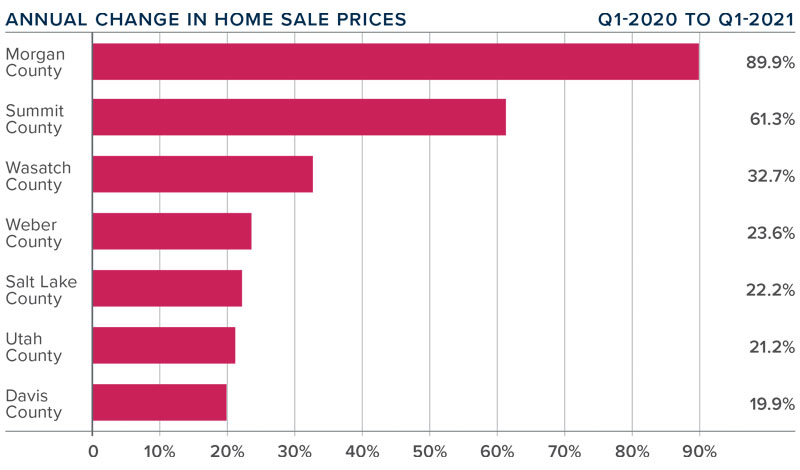
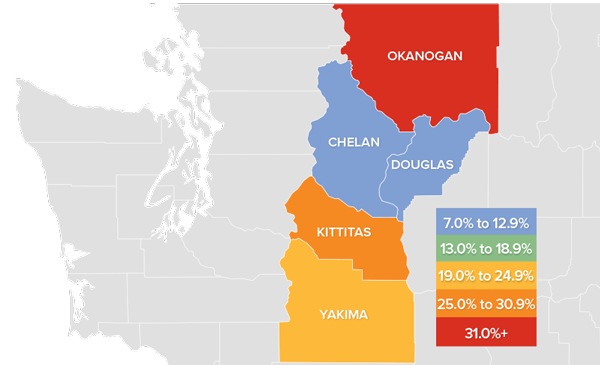
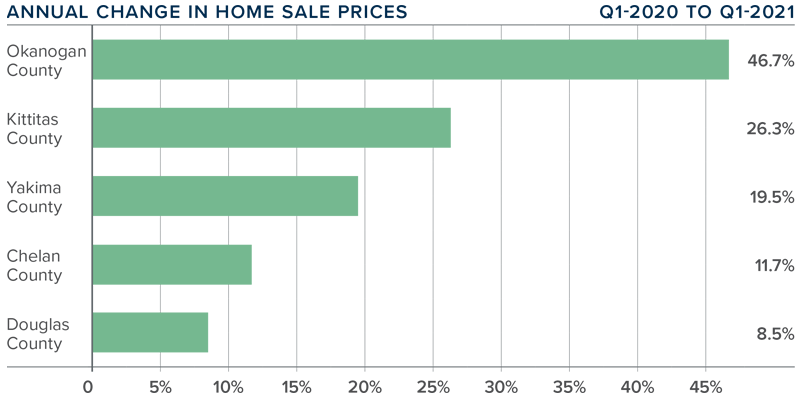
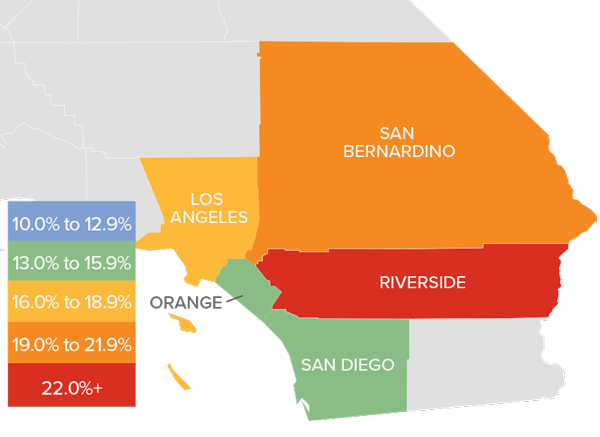
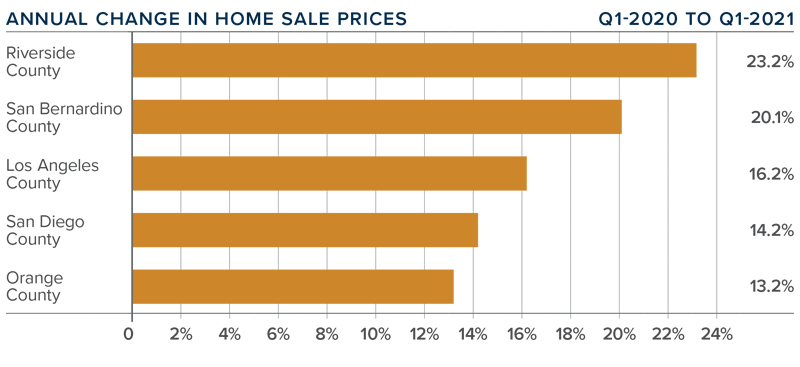
northern california Home Prices

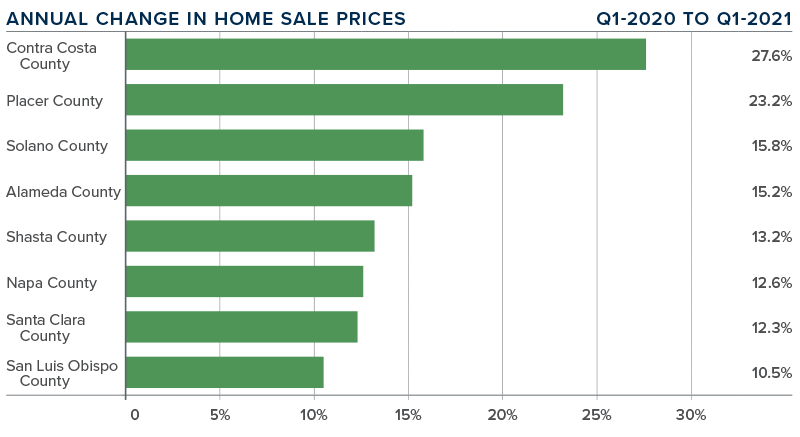
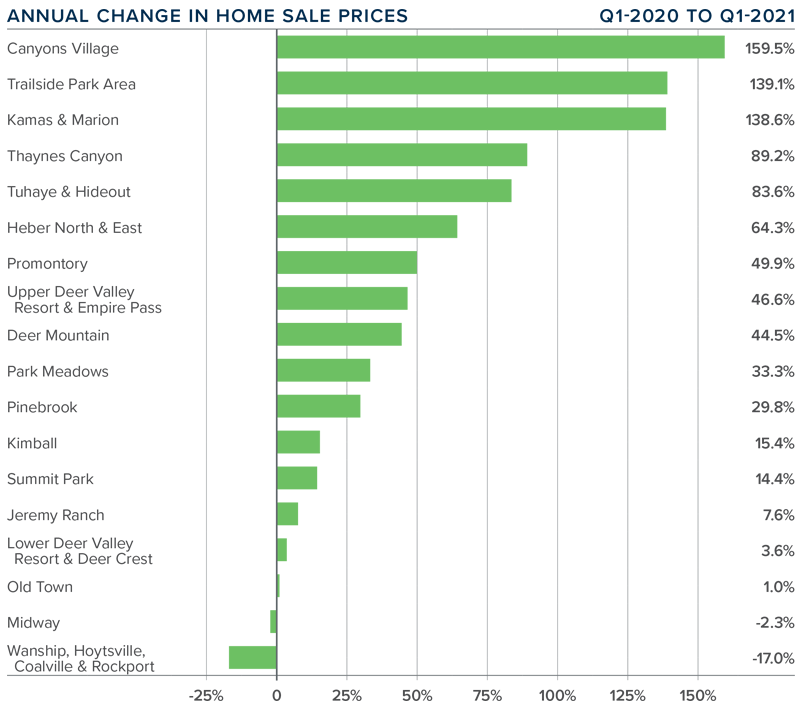
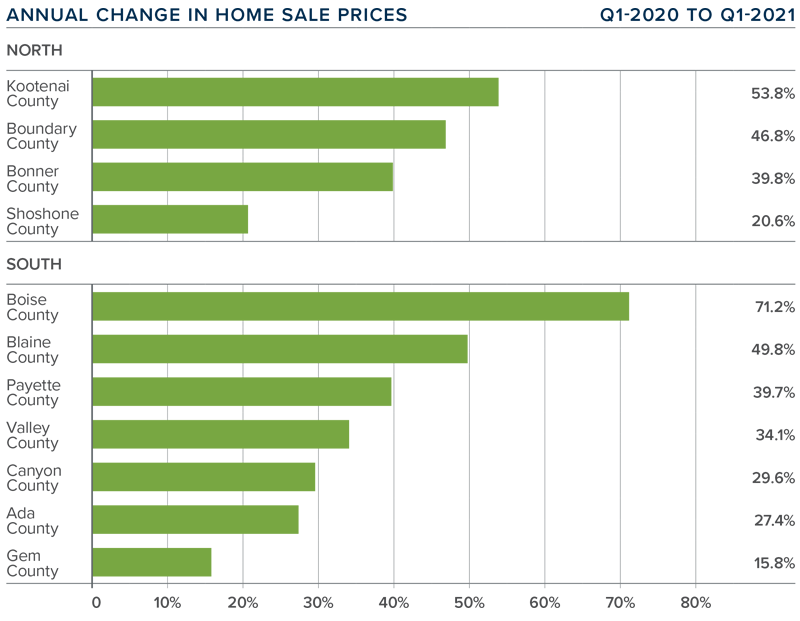
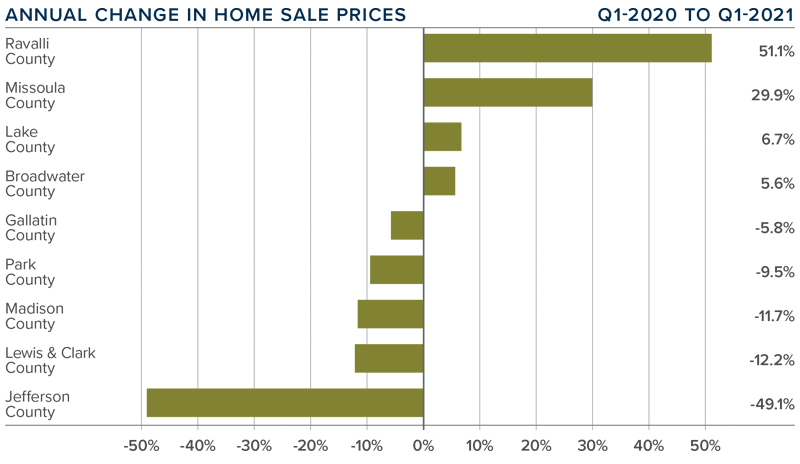
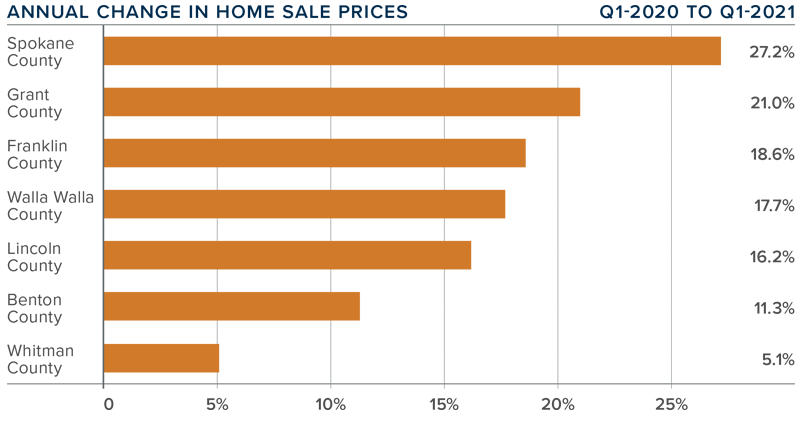
❱ The average home price in Northern California rose 19.9% year over year to $1.070 million.
❱ The most affordable counties relative to average sale prices were Shasta and Solano. The most expensive was Santa Clara. It was interesting that, irrespective of how expensive Santa Clara is, prices there still rose by more than 12%.
❱ Average prices rose in all the counties contained in this report. Even more impressive is that all markets saw prices rise more than 10%.
❱ Home-price growth is a function of supply and demand. Without enough supply, prices will keep appreciating at above-average rates. As mortgage rates continue to rise—albeit modestly—we may start to see a bit of a slowdown in price growth, which would be good news for home buyers.
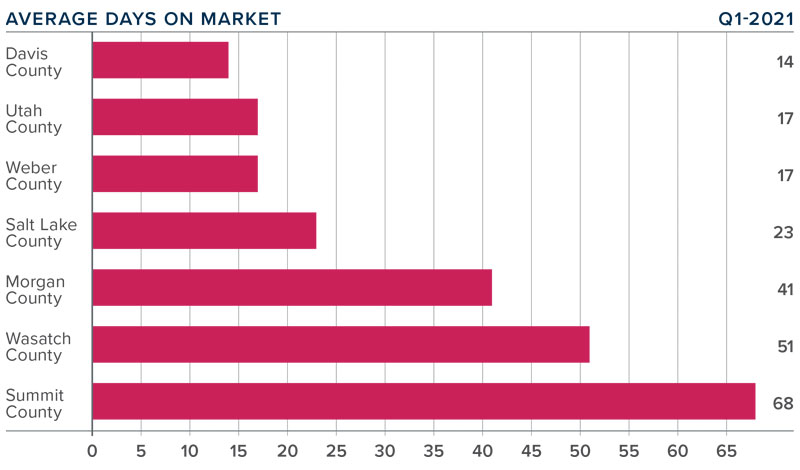
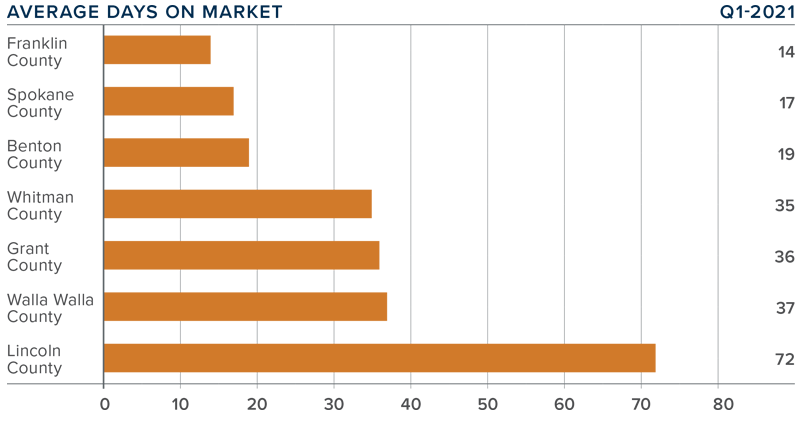
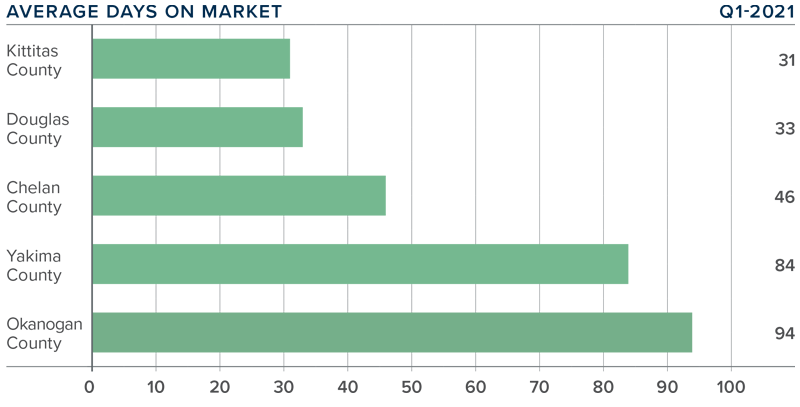
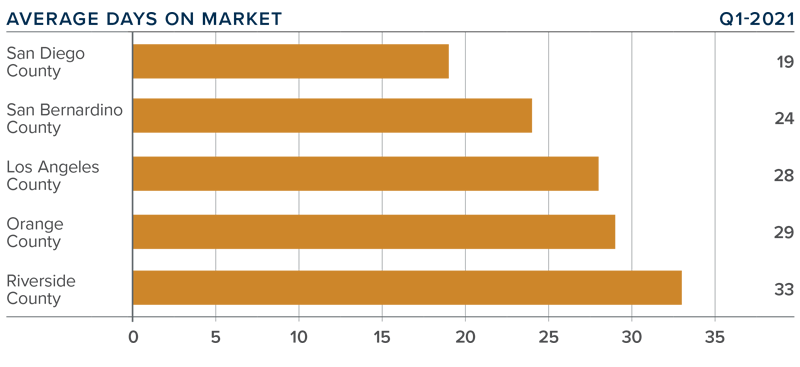
Days on Market
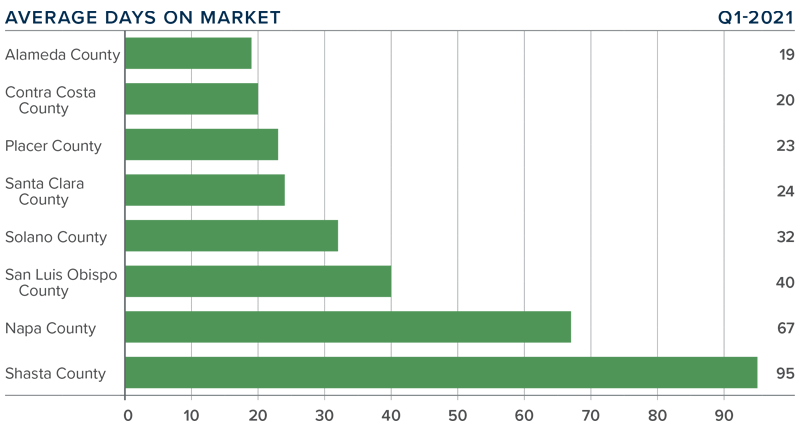
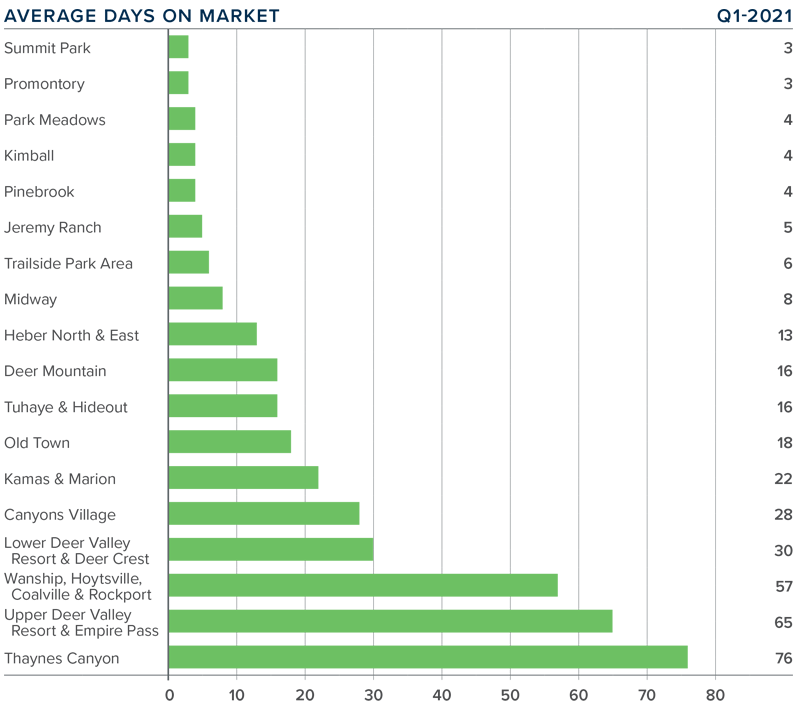
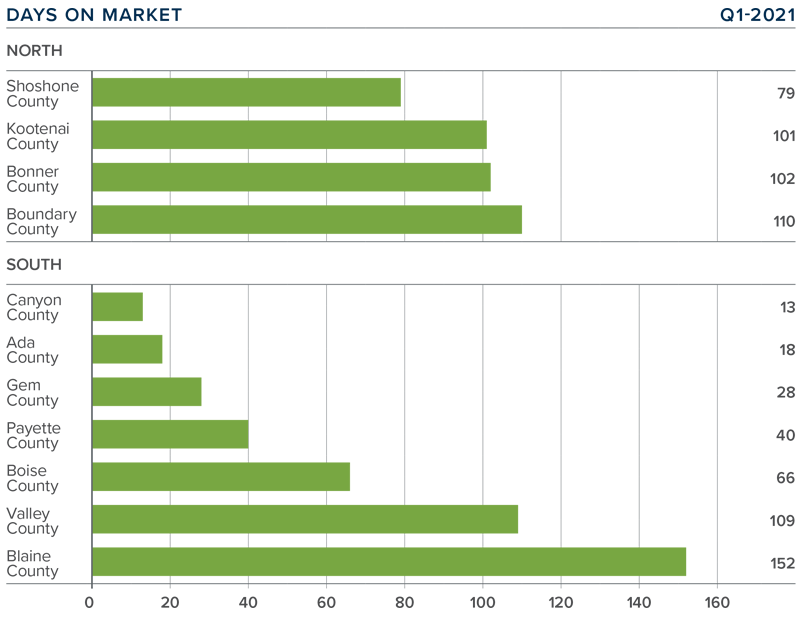
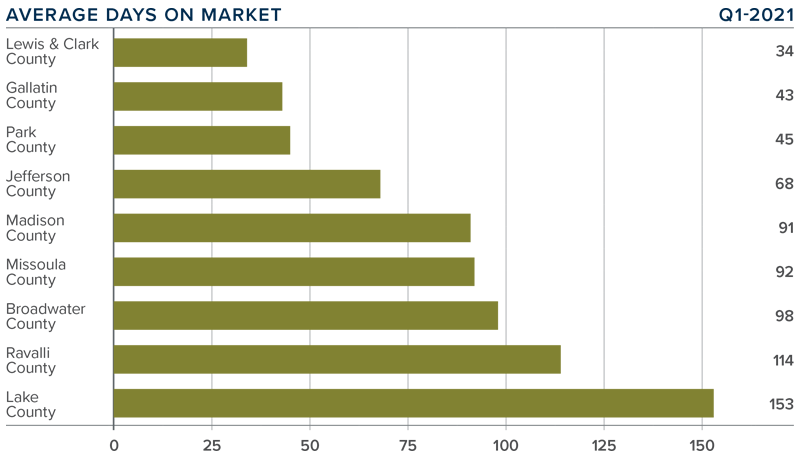
❱ The average time it took to sell a home in the Northern Californian counties covered by this report dropped 13 days compared to the first quarter of 2020.
❱ The amount of time it took to sell a home dropped in every county other than Shasta, where it took eight more days to sell a home than it did a year ago.
❱ In the first quarter, it took an average of 40 days to sell a home, with homes selling fastest in Alameda County, and slowest in Shasta County.
❱ The greatest drop in market time was in San Luis Obispo County, where it took 31 fewer days to sell a home that in the first quarter of 2020.
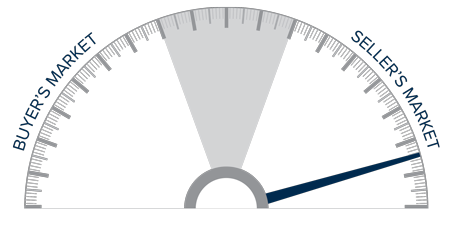
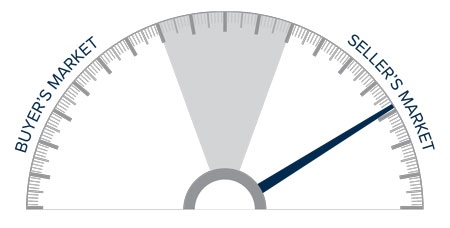
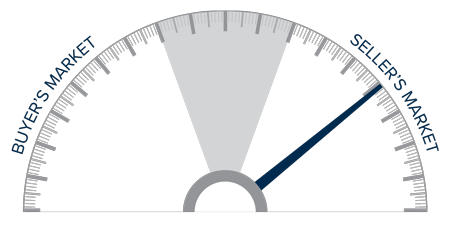
Conclusions
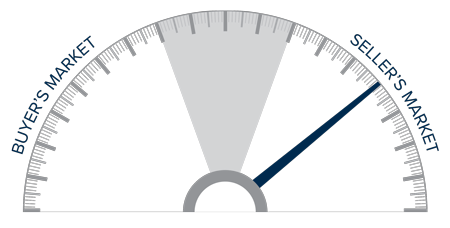
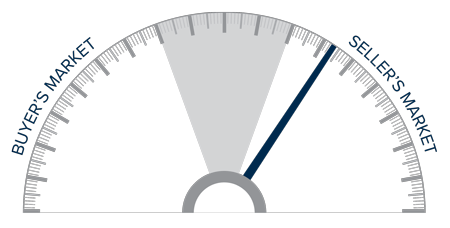
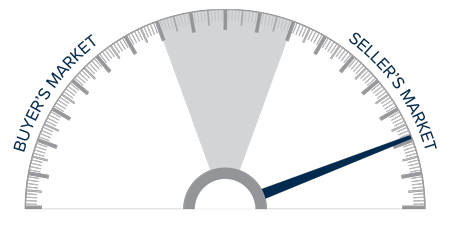
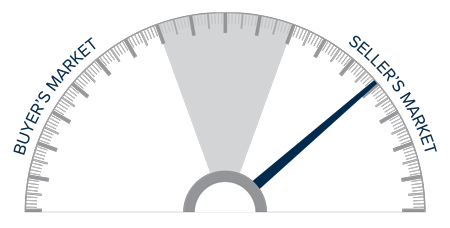
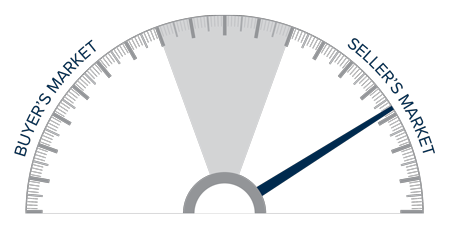
This speedometer reflects the state of the region’s real estate market using housing inventory, price gains, home sales, interest rates, and larger economic factors.
Even with a slowdown in the job recovery, there is clearly demand for housing, as demonstrated by reduced market time and rising home prices. The number of homes for sale remains well below where I would like to see it, but I still have hope that there will be some improvement heading into the summer— especially if COVID-19 infection rates start to drop as more people get vaccinated.
The current market continues to significantly favor sellers and, given the factors shown above, I have moved the needle a little more in their favor.
About Matthew Gardner

As Chief Economist for Windermere Real Estate, Matthew Gardner is responsible for analyzing and interpreting economic data and its impact on the real estate market on both a local and national level. Matthew has over 30 years of professional experience both in the U.S. and U.K.
In addition to his day-to-day responsibilities, Matthew sits on the Washington State Governors Council of Economic Advisors; chairs the Board of Trustees at the Washington Center for Real Estate Research at the University of Washington; and is an Advisory Board Member at the Runstad Center for Real Estate Studies at the University of Washington where he also lectures in real estate economics.


")


