
 Facebook
 X
X
 Pinterest
 Copy Link

The following analysis of select Montana real estate markets is provided by Windermere Real Estate Chief Economist Matthew Gardner. We hope that this information may assist you with making better-informed real estate decisions. For further information about the housing market in your area, please don’t hesitate to contact your Windermere Real Estate agent.
Regional Economic Overview
Montana’s job recovery following COVID-19 continues to impress, having returned more than 56,000 of the 63,300 jobs that were lost in the state. The recovery in employment was seen across all metro areas and I feel fairly confident that all of the jobs lost in Montana will have returned by the end of the year.
The February unemployment rate in Montana was 3.9%—well below the national rate of 6%. The Labor Department recently revised its unemployment estimates across the metro areas, and all of them saw rates increase from levels shown at the end of 2020. Even so, jobless rates in Montana were still well below the nation. Billings and Missoula were at 4.2% and Great Falls came in at 4.3%.
montana Home Sales
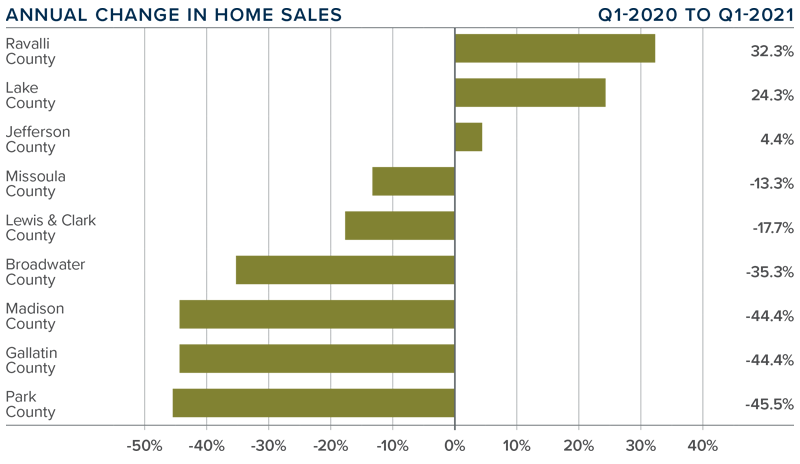
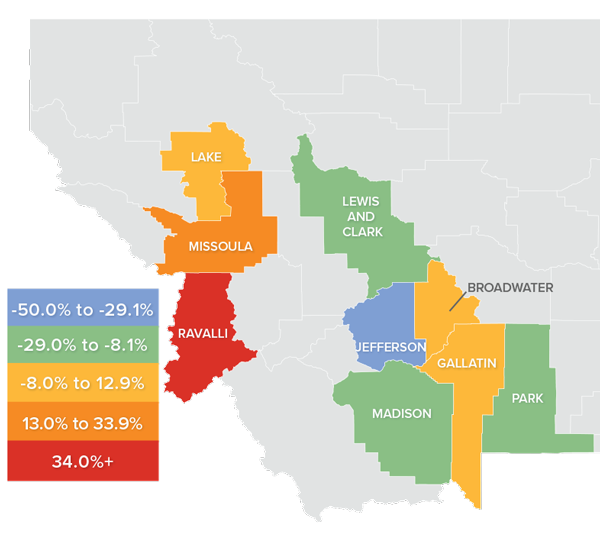
❱ In the first quarter, a total of 1,121 homes sold in the markets contained in this report, representing a drop of 31.8% compared to the same period in 2020. Sales were down 37.2% compared to the final quarter of 2020.
❱ With few choices for buyers, I was surprised to see sales higher in three counties. That said, they are all very small markets and the total growth in sales was only 22 units. In total, sales were down 522 units compared to a year ago.
❱ The decline in sales does not come as a surprise and can be almost totally attributed to the remarkably low level of homes for sale. The average number of listings in the first quarter was 36.5% lower than a year ago and 6.5% lower than in the fourth quarter of 2020.
❱ At some point, I expect to see sales start to rise again, which will likely occur when potential home sellers feel less concerned about COVID-19.
montana Home Prices
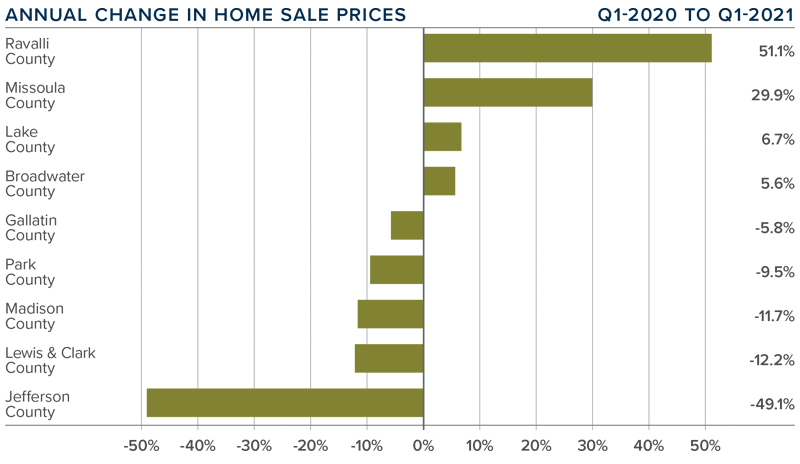
❱ Year-over-year, home prices fell 14% to an average of $531,193 and were 12% lower than in the fourth quarter of 2020.
❱ I am not concerned about the regional decline in prices, as it was directly due to a significant price drop in Jefferson County, which is a very small market that is subject to severe swings. Additionally, the expensive Madison County market also saw prices drop, which impacted regional growth.
❱ Average sale prices rose in Ravelli, Missoula, Lake, and Broadwater counties, but this was offset by a drop in prices across the balance of the region.
❱ I cannot guarantee that the decline in home prices will turn around in the second quarter. I think the market is trying to find balance after having experienced a significant period where price growth has far exceeded the long-term trend.
Days on Market
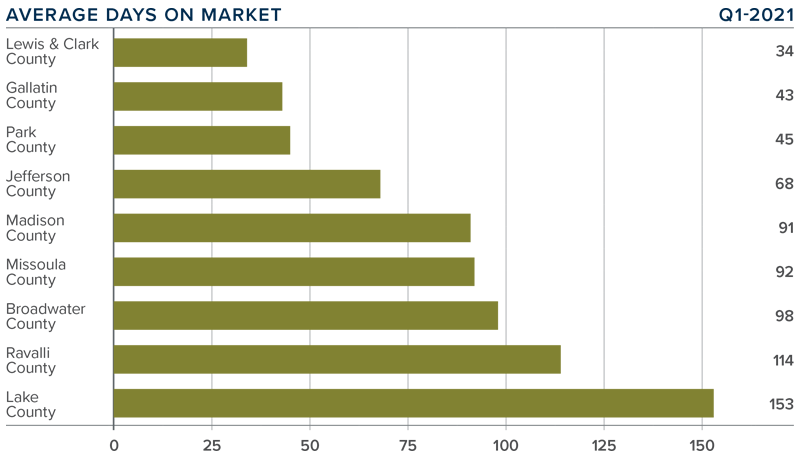
❱ The average number of days it took to sell a home dropped 28 days compared to the first quarter of 2020.
❱ Homes sold fastest in Lewis & Clark County, and slowest in Lake and Ravalli counties. All markets other than Lake (+37 days) saw market time drop compared to the first quarter of 2020.
❱ During the quarter, it took an average of 82 days to sell a home in the region.
❱ Market time rose one day compared to the fourth quarter of 2020.
Conclusions

This speedometer reflects the state of the region’s real estate market using housing inventory, price gains, home sales, interest rates, and larger economic factors.
Montana’s economy is performing better than most of the nation, and I believe that the housing market is still on solid ground—despite some of the numbers in this report. I expect both price growth and home sales to pick back up, but this can only happen if there are more homes to choose from.
It is still a seller’s market in which well-positioned, well-priced homes continue to attract buyers. As such, I have moved the needle a little further in favor of sellers, irrespective of lower sale prices that much of the market saw in the first quarter.
About Matthew Gardner

As Chief Economist for Windermere Real Estate, Matthew Gardner is responsible for analyzing and interpreting economic data and its impact on the real estate market on both a local and national level. Matthew has over 30 years of professional experience both in the U.S. and U.K.
In addition to his day-to-day responsibilities, Matthew sits on the Washington State Governors Council of Economic Advisors; chairs the Board of Trustees at the Washington Center for Real Estate Research at the University of Washington; and is an Advisory Board Member at the Runstad Center for Real Estate Studies at the University of Washington where he also lectures in real estate economics.
")


