
 Facebook
 X
X
 Pinterest
 Copy Link

Making an offer on a house feels like a reason to celebrate. You’ve applied for financing, worked with your agent to search for available listings, put in time attending open houses, and have found the place you’re ready to call home. However, celebrating at this stage in the buying process could leave you heartbroken if your offer isn’t accepted.
So, what happens after you make an offer on a house? Revealing what goes on behind the curtain in this critical stage of the buying process will help you understand what to expect next. First, let’s take a look at the three ways a seller can respond to your offer.
What Happens After Making an Offer on a House?
The seller rejects your offer:
If a seller rejects your offer, your agent may be able to relay information from the listing agent as to why it was insufficient. This can serve as a learning opportunity for the next time you prepare an offer.
The seller makes a counteroffer:
Counteroffers can make buying a home feel like a chess match. This is an indication that your offer has piqued the seller’s interest. Once you receive a counteroffer, it’s a matter of ironing out the finer details to reach a deal. Sellers will typically request alterations like a higher price, a modification to your contingencies, or an adjustment of closing dates.
You can accept or reject the counteroffer or come back with a counteroffer of your own, which may continue for multiple rounds until the two parties reach an agreement. Prepare for counteroffers ahead of time with your agent by discussing your price limit, how much you’re willing to budge on your contingencies, your flexibility around closing dates, etc.
The seller accepts your offer:
The smoothest result after submitting your offer is the seller accepting it, but that doesn’t mean you’ve crossed the finish line yet. Once the seller formally accepts your offer, you’ll be “under contract,” meaning both parties have agreed to move forward with the deal. Before closing, any contingencies attached to the offer must be met.
This explains why you’ll occasionally see properties listed as “under contract.” It means the seller has accepted an offer and there’s a good chance the deal will go through, but because the sale is not yet final, the property is technically not off the table. Other interested buyers will make backup offers in case the first offer falls through.

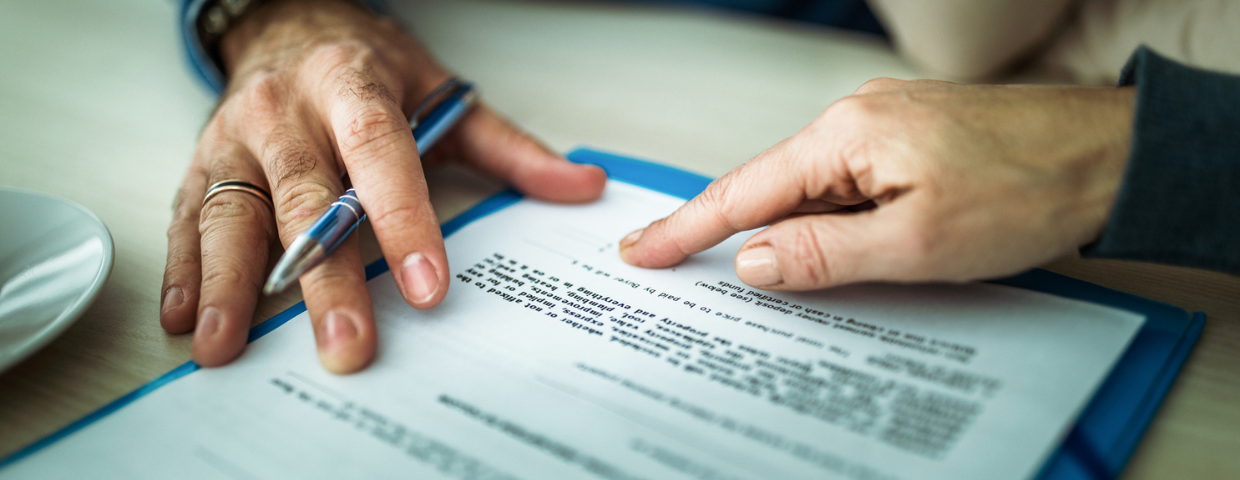
Image Source: Getty Images – Image Credit: Ridofranz
After your offer has been accepted, you’re officially in the homestretch of the buying process. Once the purchase agreement is signed, it becomes legally binding. Backing out of a real estate transaction has varying consequences, depending on the timing of the withdrawal and its level of compliance with the attached contingencies. Learn more here:
If you intend to move forward with your purchase, finalizing the deal is a matter of completing the following steps before you can claim your new home:
The Home Buying Process: Closing
- Next, you’ll deposit your earnest money in an escrow account. This deposit of funds lets the seller know you’re serious about closing on the home. In return, the seller agrees to take the home off the market. When the sale closes, the money goes toward the down payment or closing costs.
- The timeline for inspections during the closing process vary state to state. Getting the home inspected allows you to ask the seller that certain repairs be made, request seller concessions, and renegotiate your offer. If you included an inspection contingency in your contract, you could walk away from the deal with your earnest money if you decide the property’s issues are too much to handle.
- Contact your mortgage lender to relay the final details of the purchase so you can go about securing financing. Getting pre-approved early on helps to streamline this part of the closing process.
- A title search will generate a report for you and your lender detailing the history of the home you’re buying to ensure there are no legal barriers against purchasing it.
- Now you’re ready to close! Several legal documents are prepared, leading to the transfer of ownership from seller to buyer. You’ll also pay closing costs at this time. Once closing is finalized and the funds in escrow have been distributed, the home is yours!
For helpful information on the buying process from start to finish, tips on working with an agent, moving checklists, and more, visit our home buying guide:


")


