
 Facebook
 X
X
 Pinterest
 Copy Link

The following analysis of select counties of the Central and Southern Oregon real estate market is provided by Windermere Real Estate Chief Economist Matthew Gardner. We hope that this information may assist you with making better-informed real estate decisions. For further information about the housing market in your area, please don’t hesitate to contact your Windermere Real Estate agent.
Regional Economic Overview
The Central and Southern Oregon counties covered by this report continue to add jobs at a decent pace. Employment levels are now 3,860 higher than before the pandemic. The Medford metro area continues to lag, but the area is short by just 760 jobs. The only other county that has not recovered all the jobs lost due to COVID is Jefferson County, though it is only short by 20 jobs. The unemployment rate across the region was 5.3%. This is up from 4.5% in the first quarter of 2022, as the number of unemployed people has been rising. By county, the lowest jobless rate was in Bend (4.4%) and the highest was in Klamath County, where 6.6% of the labor force is still without a job.
Central and Southern Oregon Home Sales
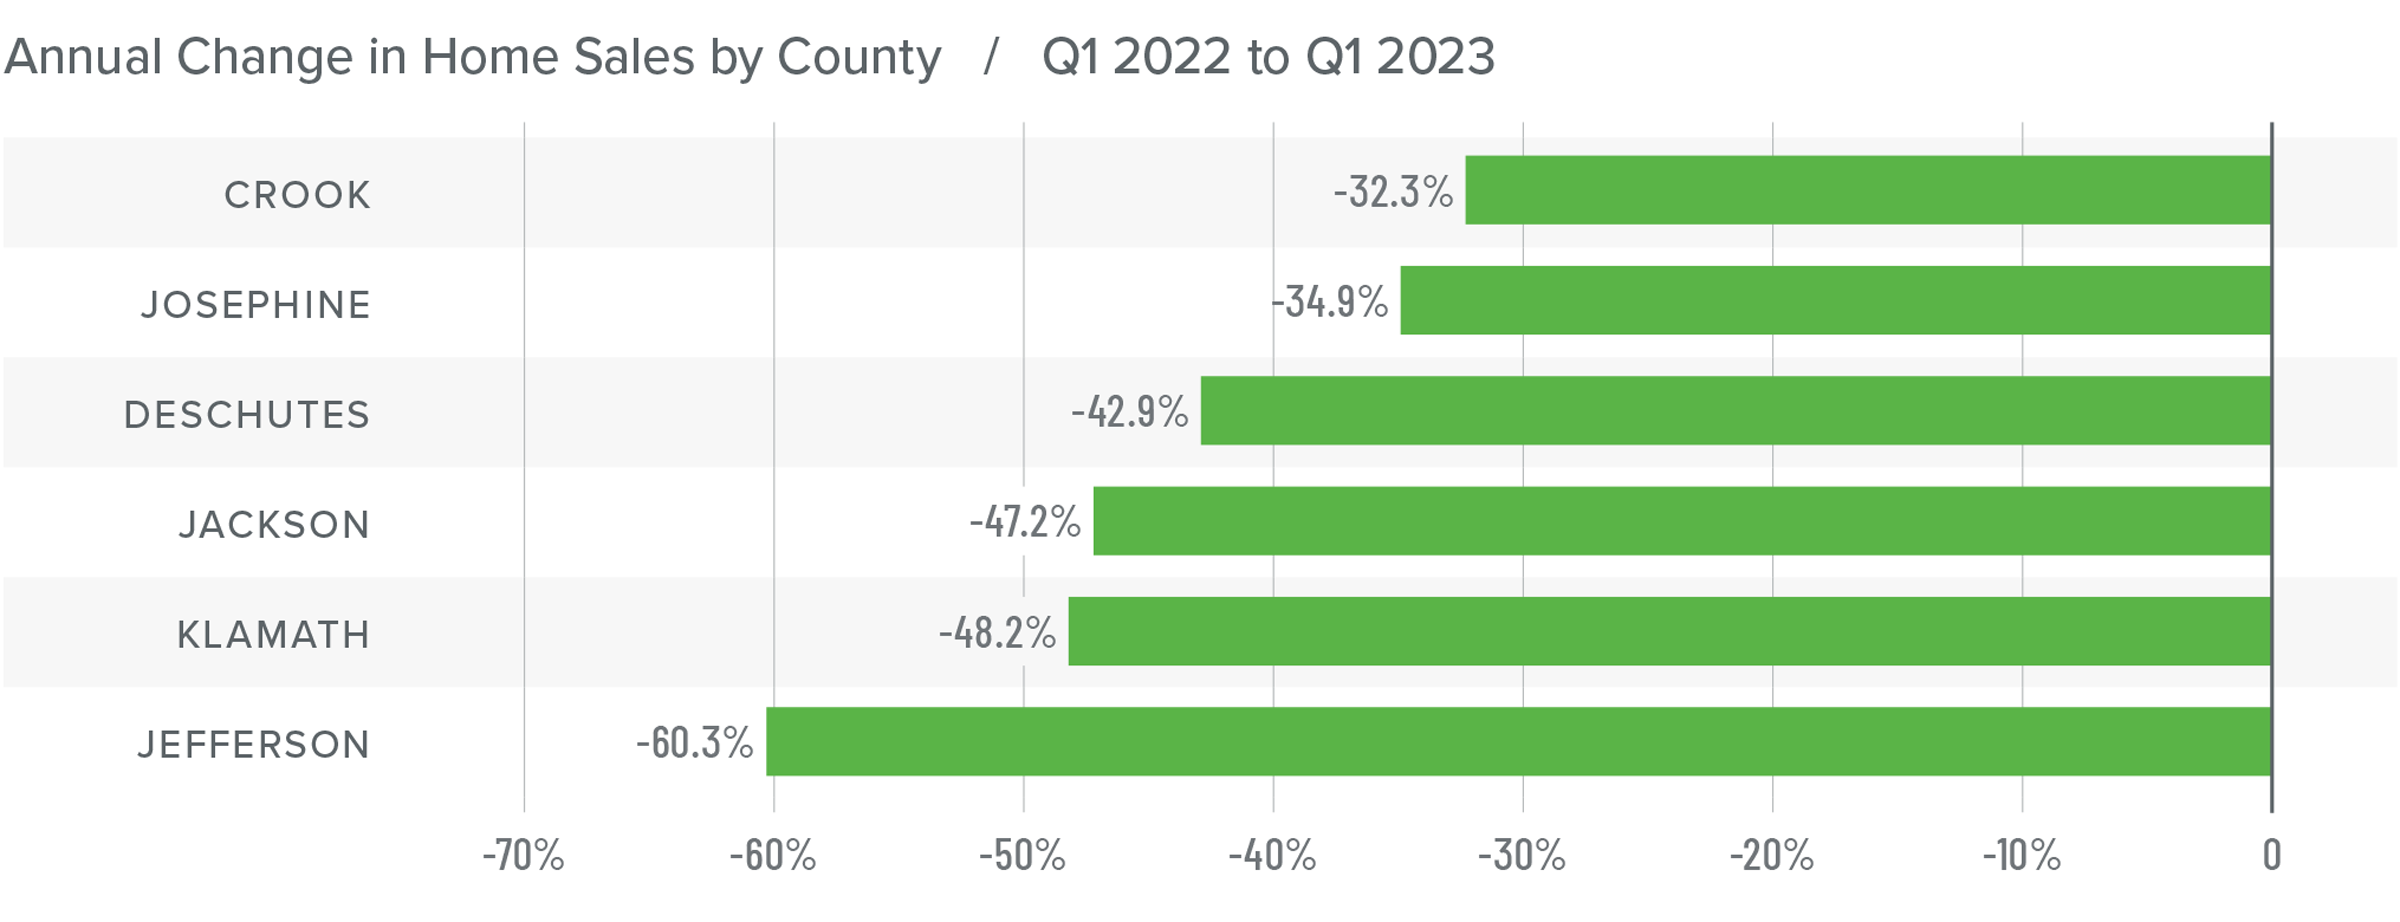
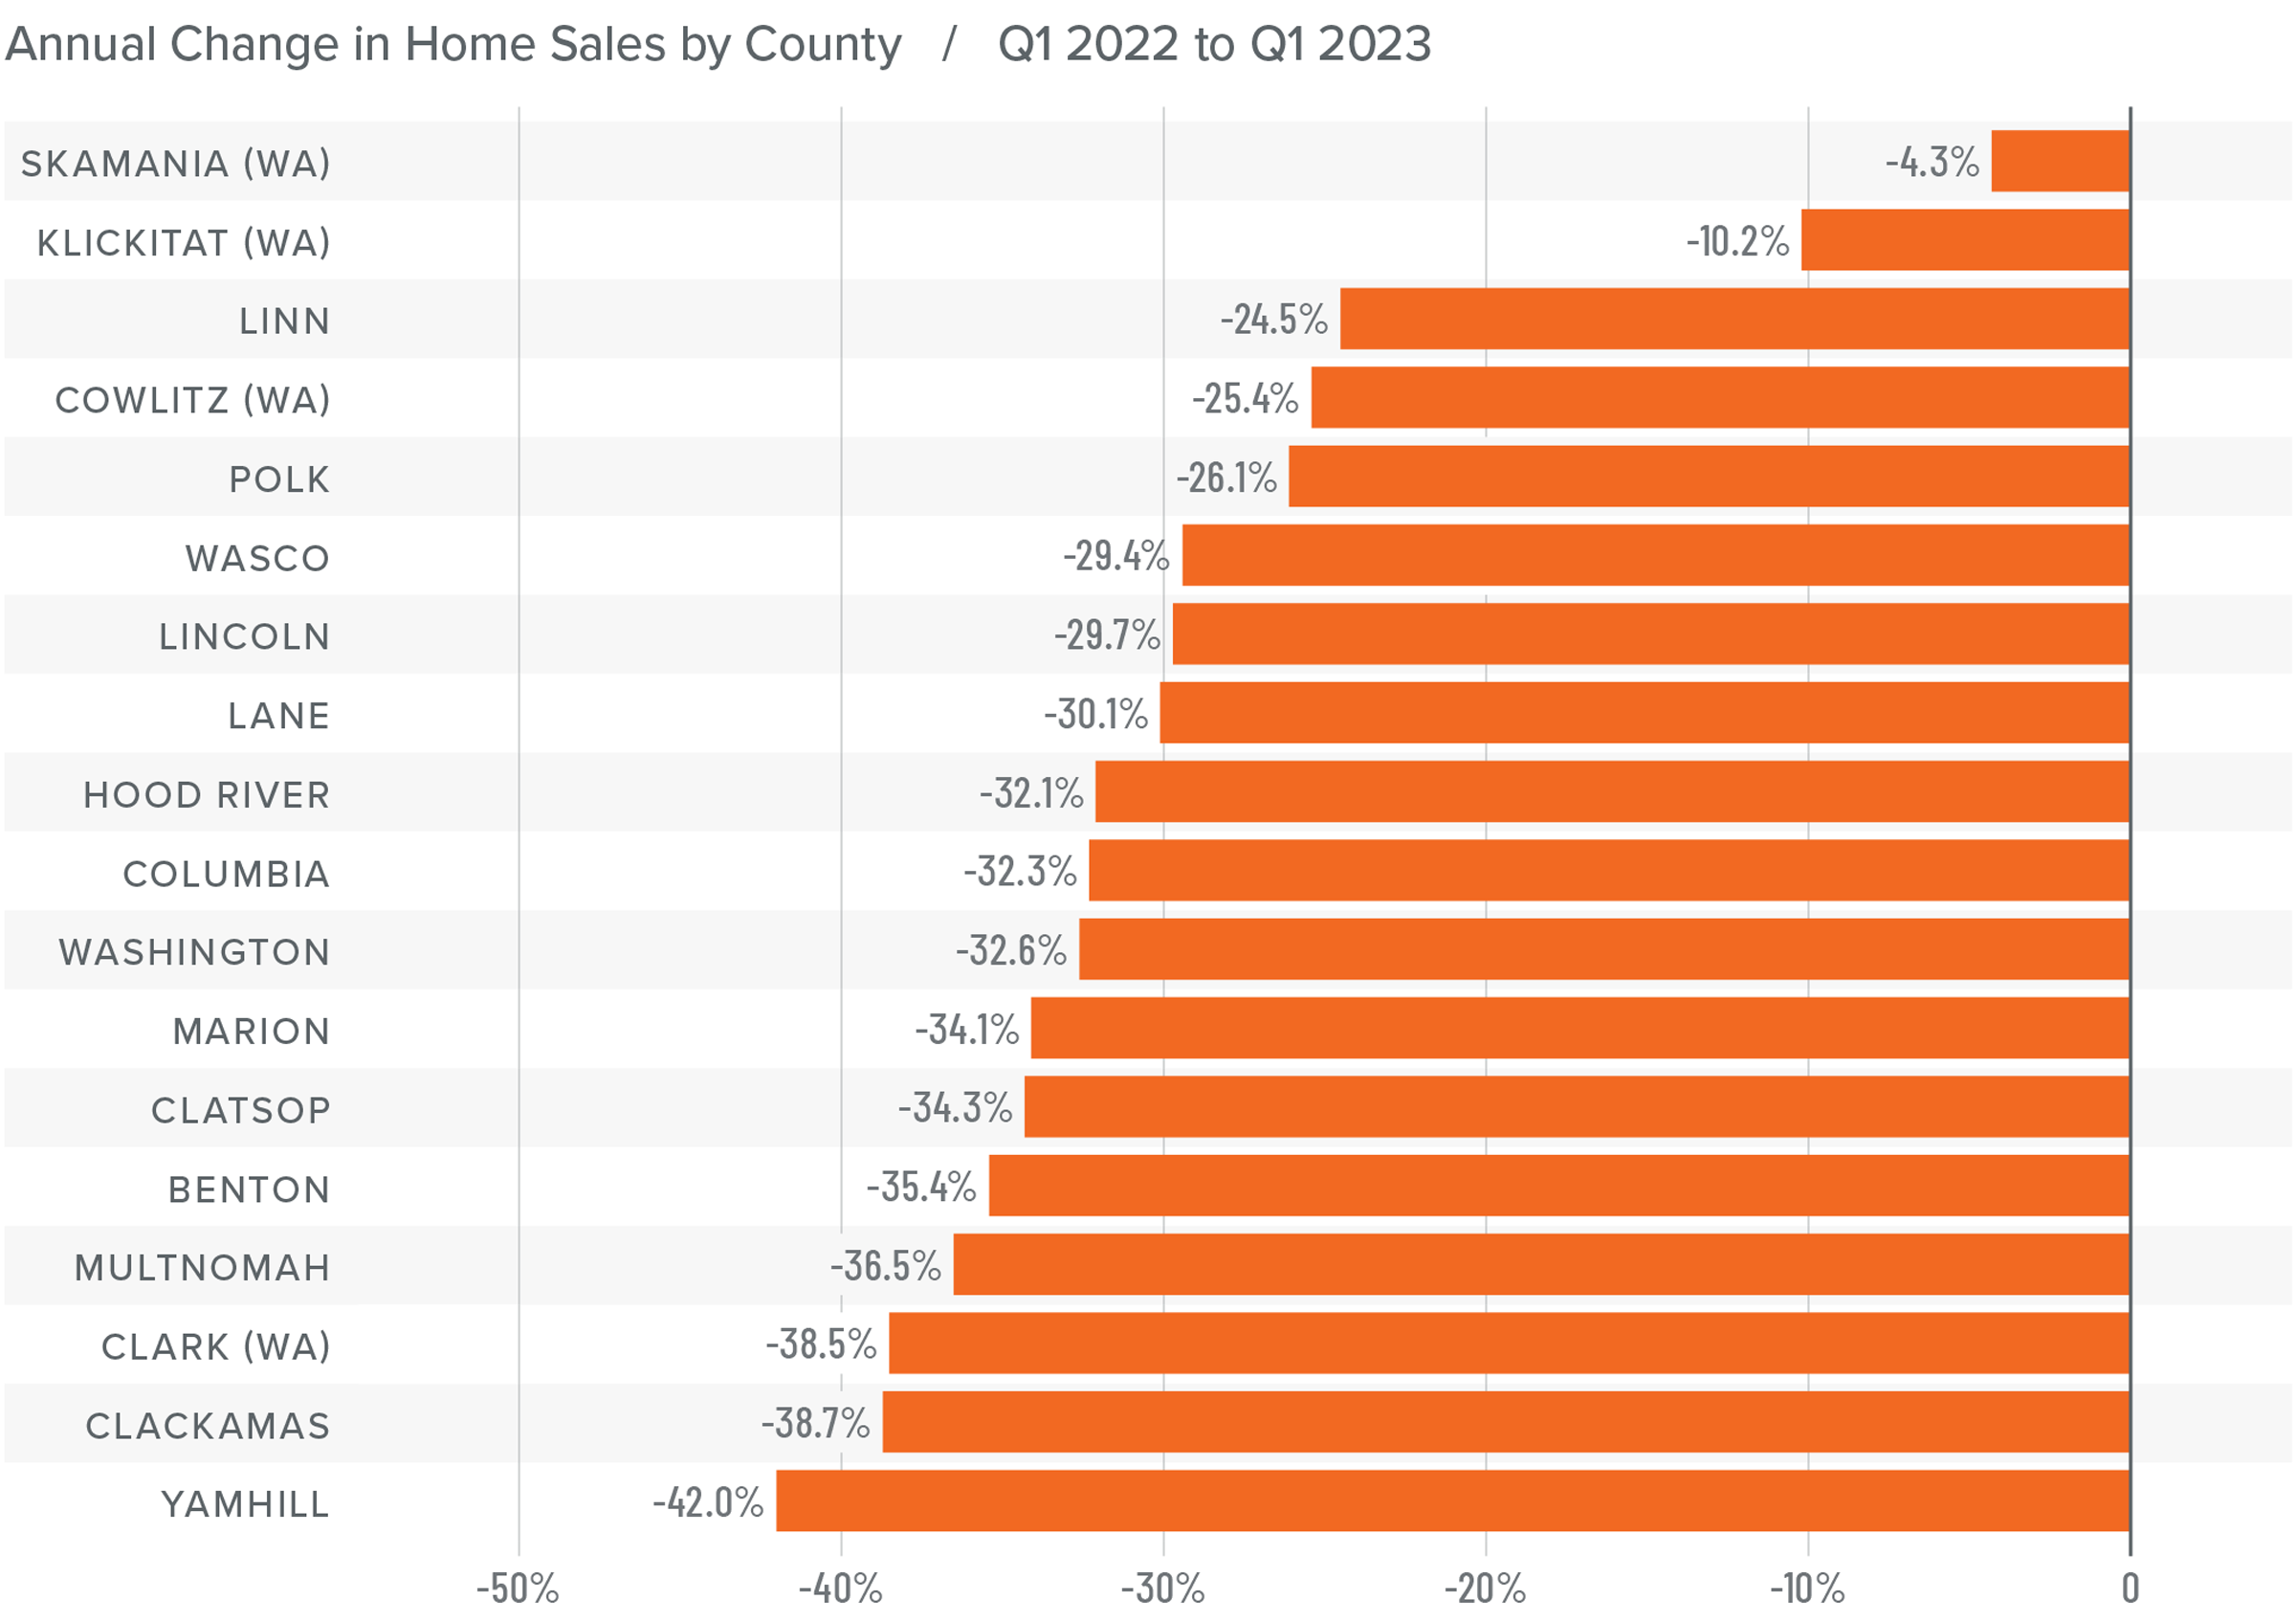
❱ In the first quarter of 2023, 1,344 homes sold, representing a drop of 44% compared to the same period in 2022. Sales were 24.1% lower than in the fourth quarter of last year.
❱ Compared to the fourth quarter of 2022, sales fell in all counties except Crook County, where sales rose 8.3%.
❱ Sales fell across the board compared to the first quarter of 2022, with significant declines in all markets.
❱ Declining sales can mostly be attributed to lower inventory levels, uncertainty regarding the direction of mortgage rates, and lower affordability.
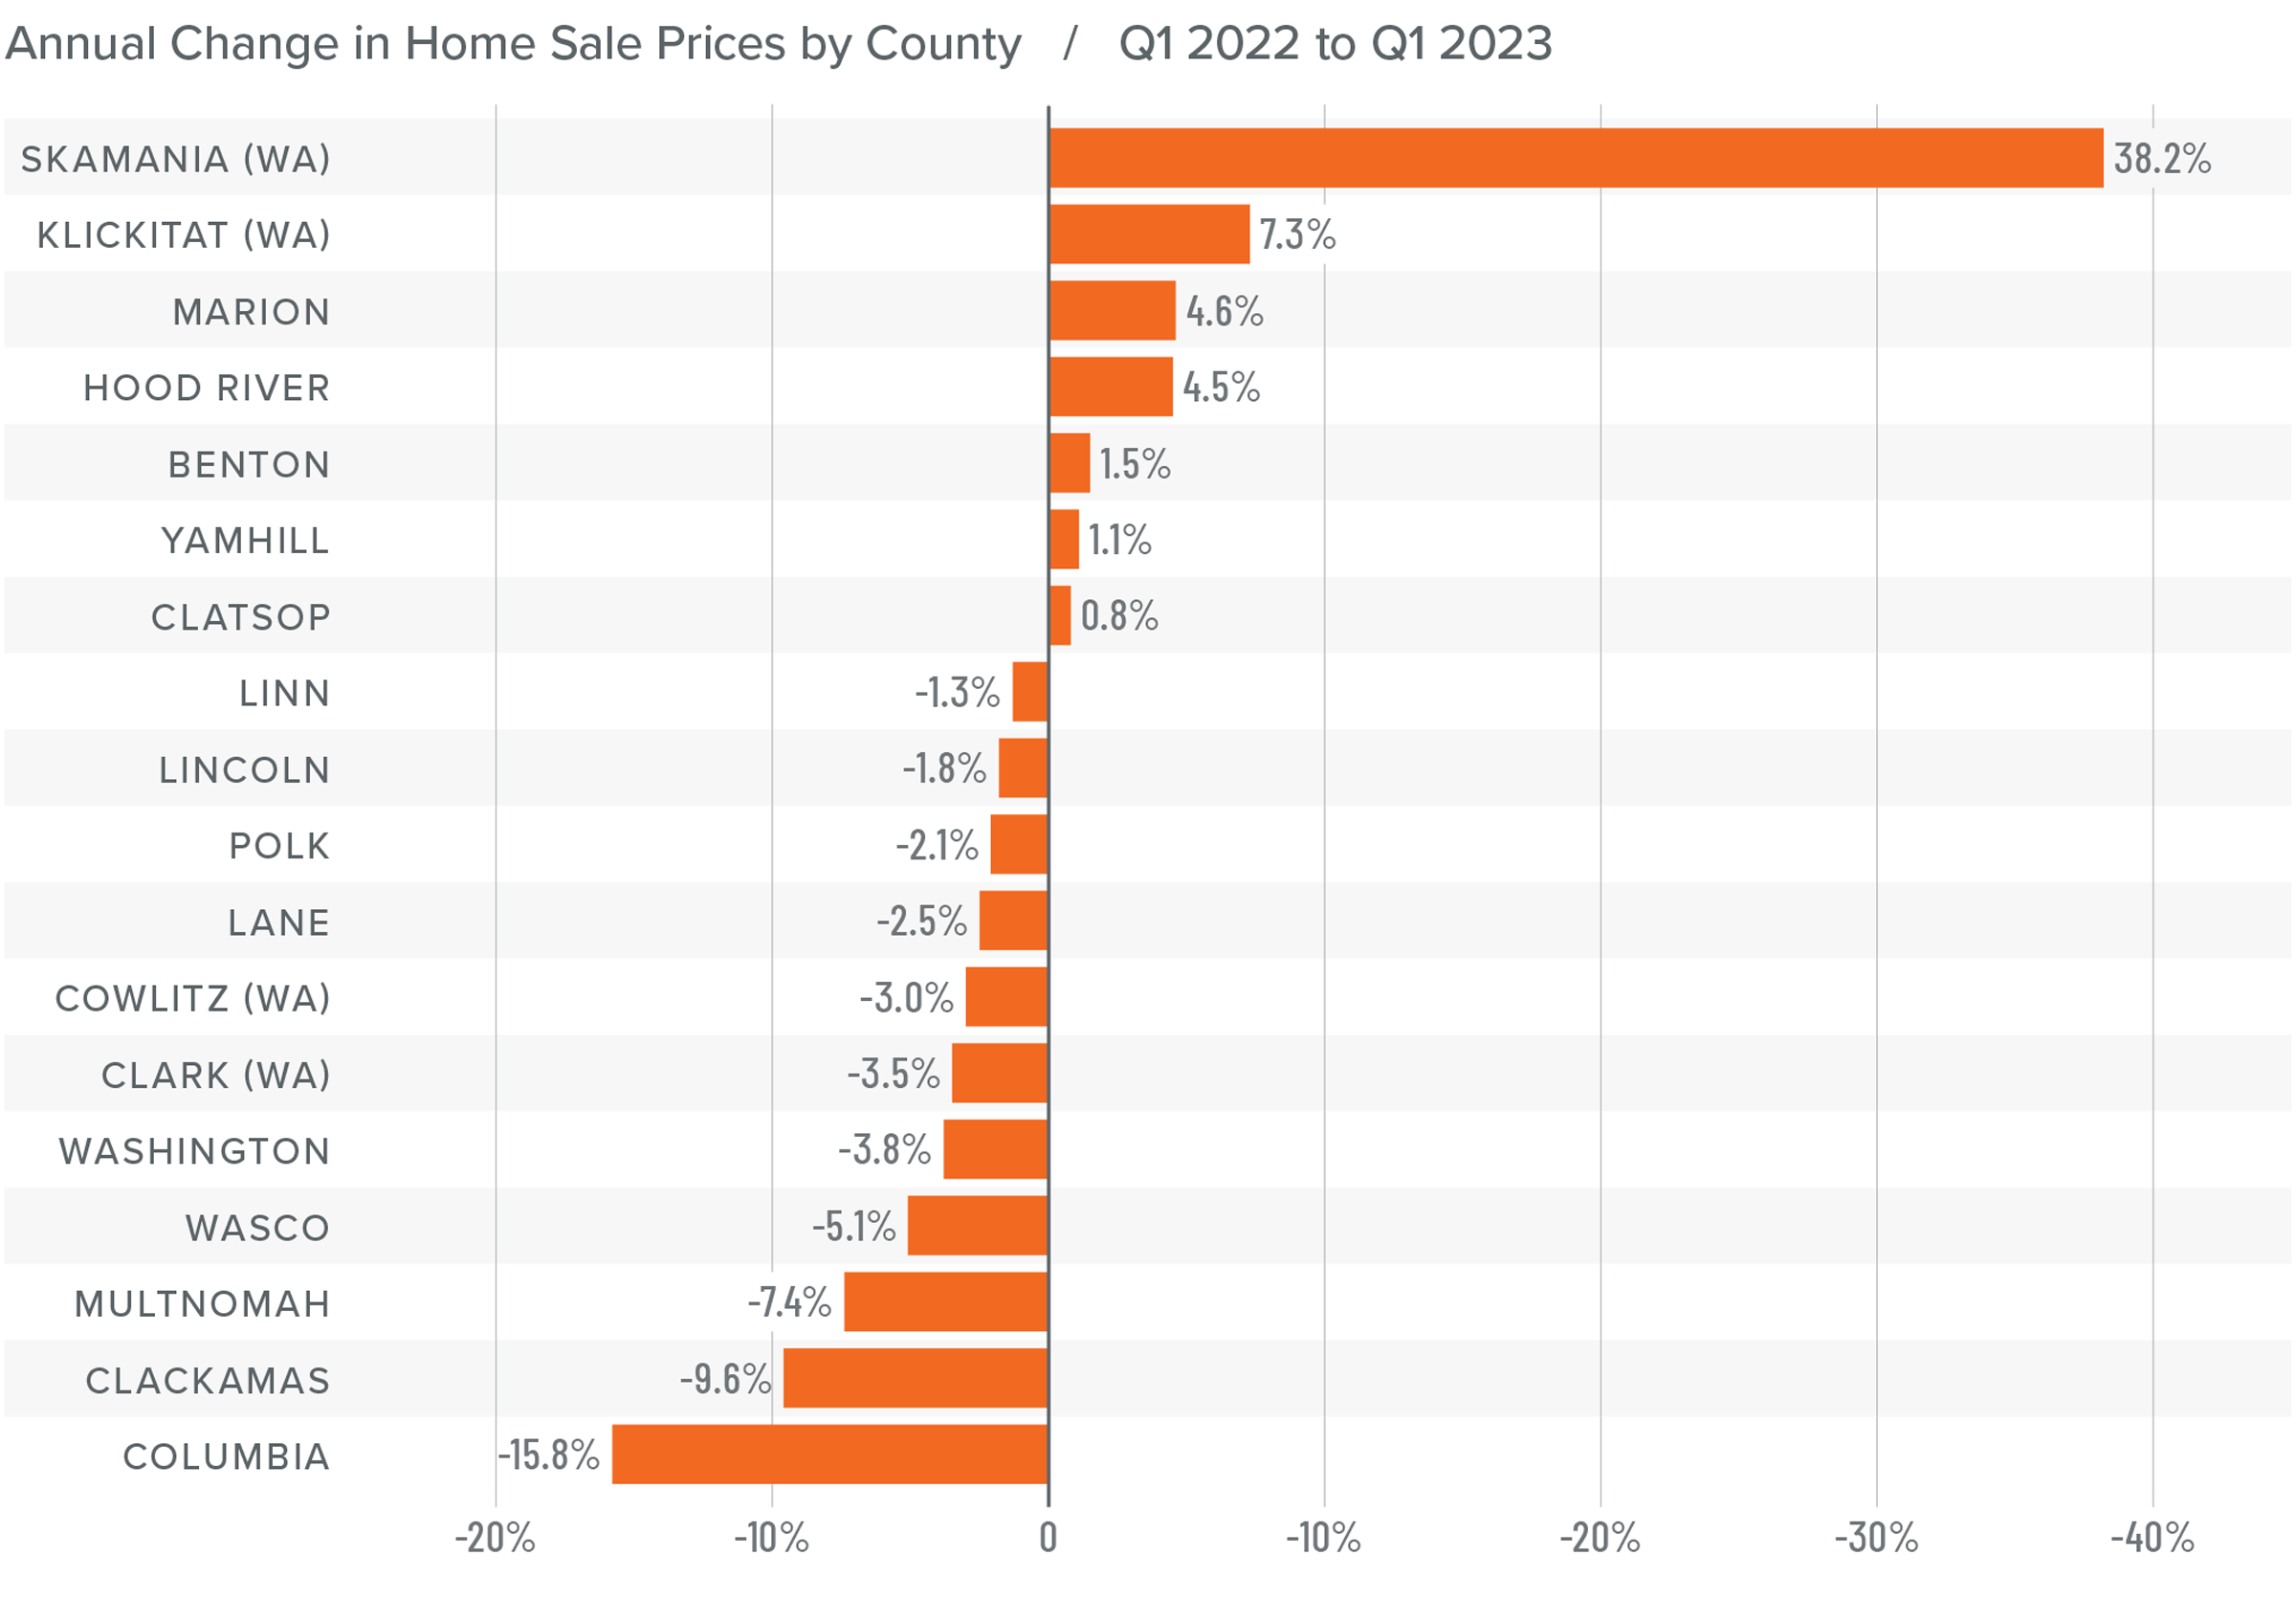
Central and Southern Oregon Home Prices
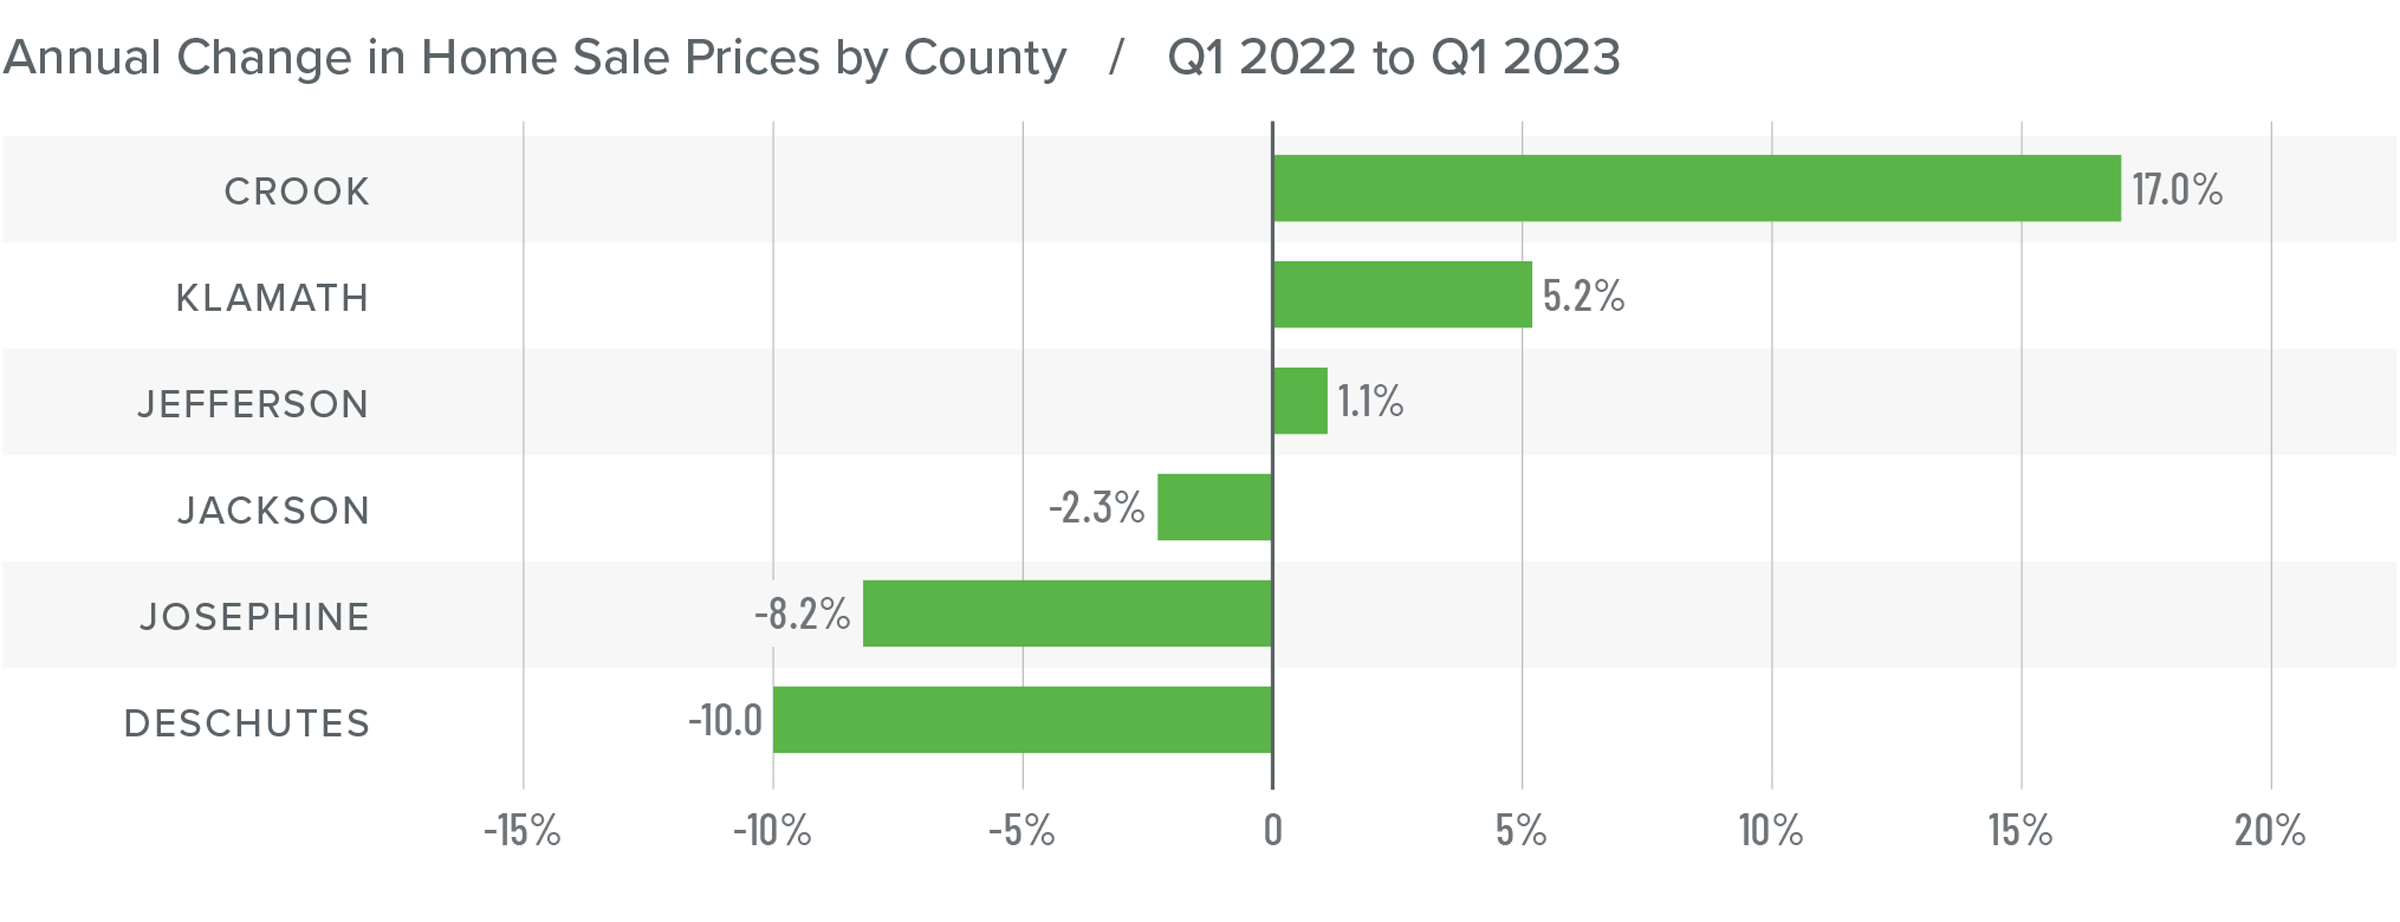
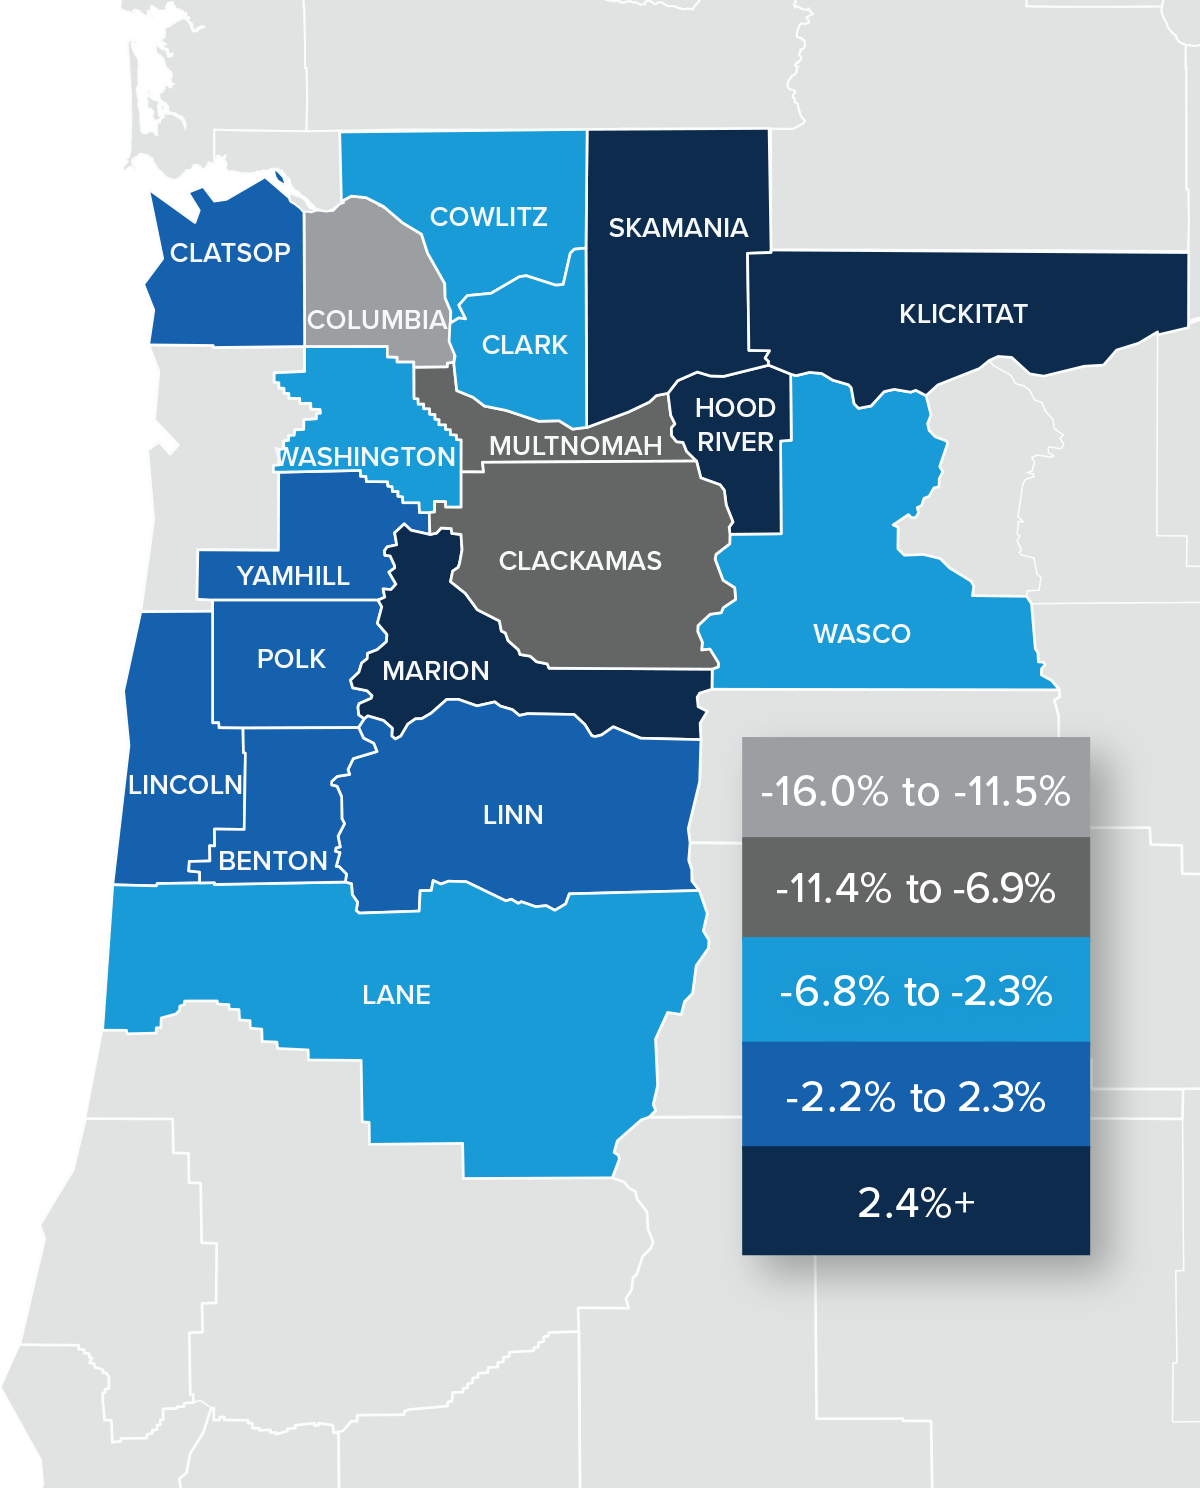
❱ The average home price in the region fell 5% year over year to $549,850. Prices were down .3% compared to the fourth quarter of 2022.
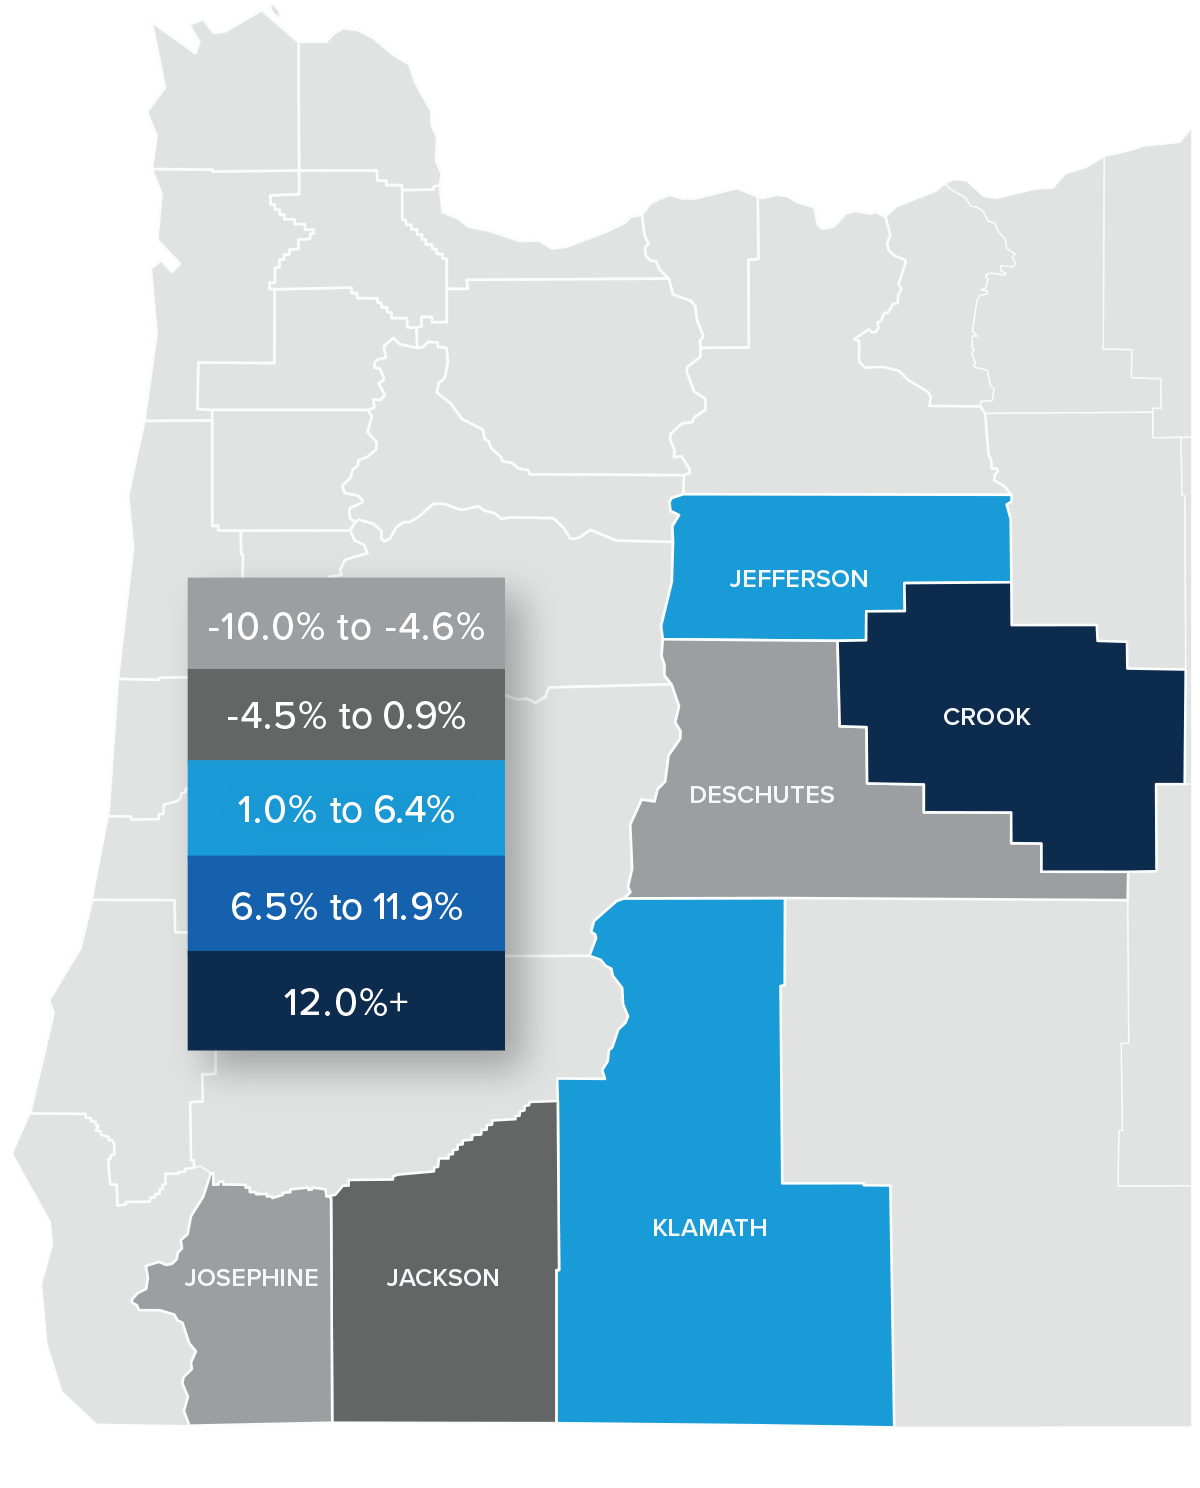
❱ Compared to the final quarter of 2022, home prices rose in Crook and Jackson counties, but fell in the rest of the market areas.
❱ Home prices rose in three counties year over year, while they fell in three. The Bend market area experienced a significant decline.
❱ Median listing prices rose in Crook, Deschutes, Jackson, and Klamath counties, but fell in the other two counties compared to the fourth quarter of 2022. It appears the overall market has not found equilibrium yet.
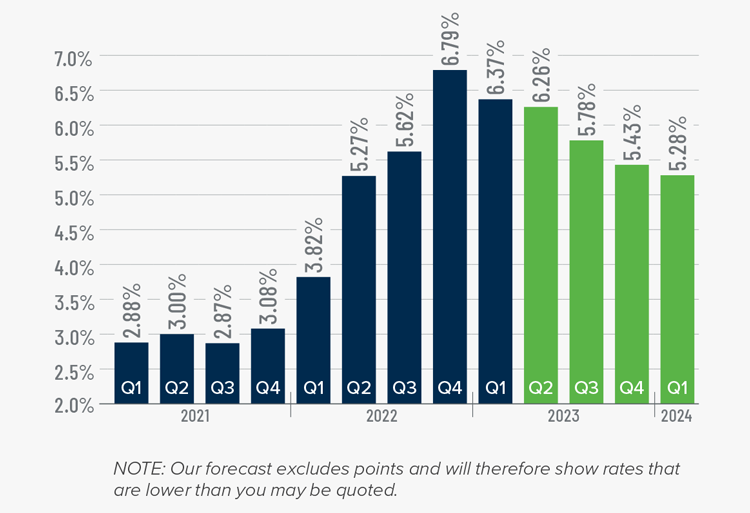
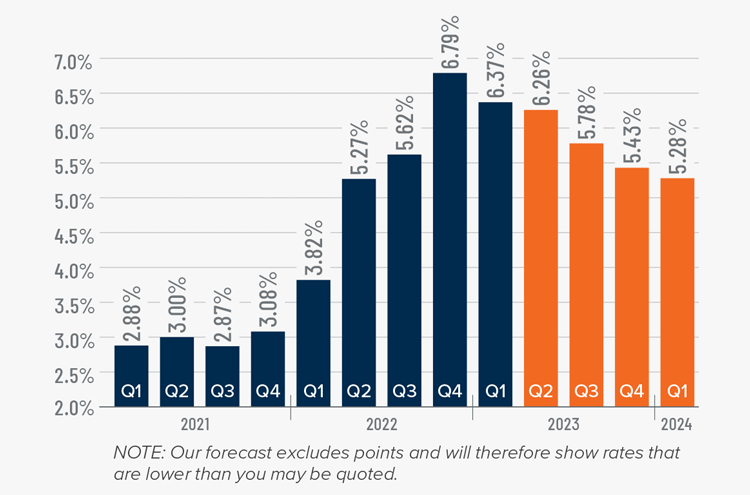
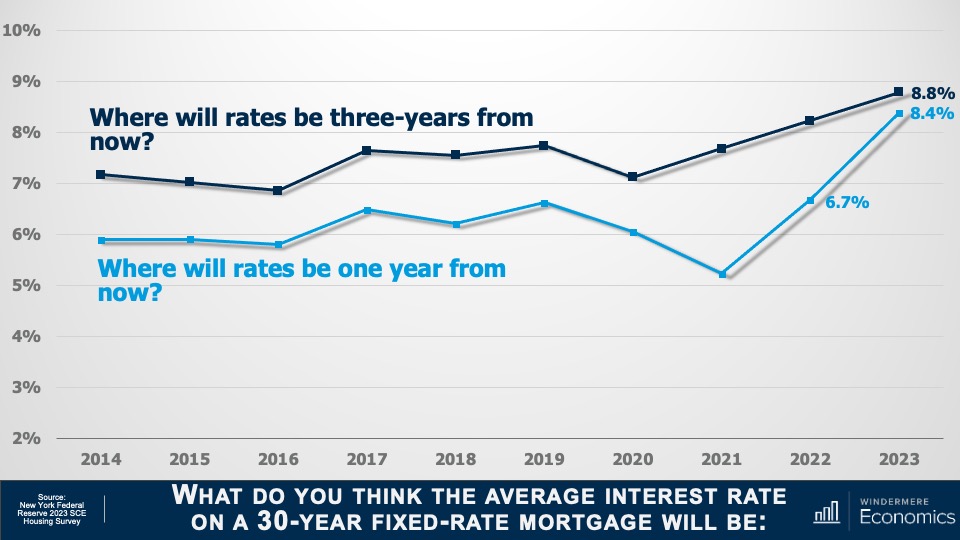
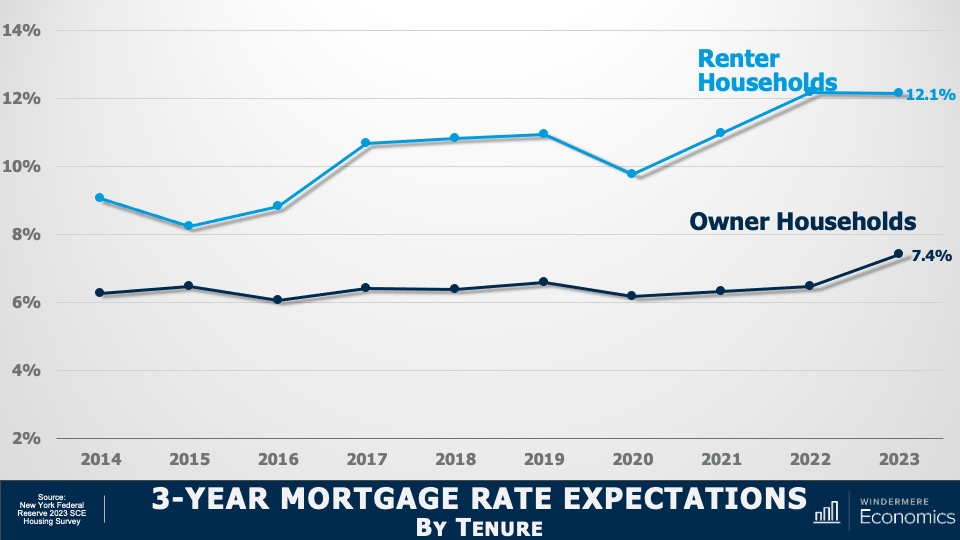
Mortgage Rates
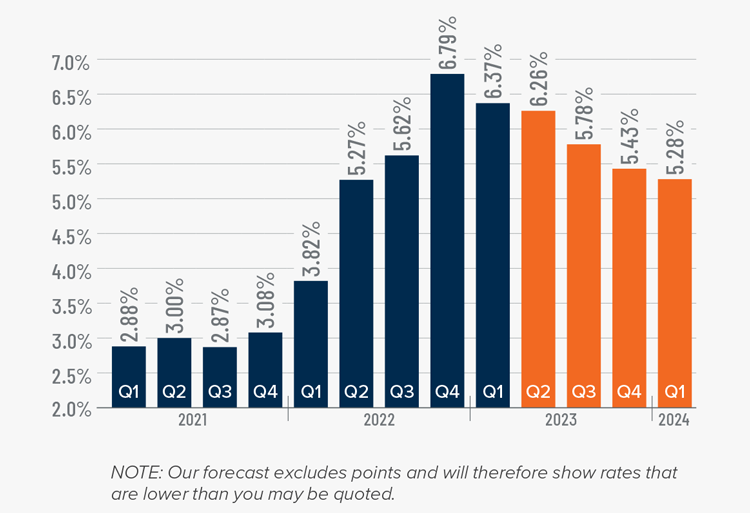
Rates in the first quarter of 2023 were far less volatile than last year, even with the brief but significant impact of early March’s banking crisis. It appears that buyers are jumping in when rates dip, which was the case in mid-January and again in early February.
Even with the March Consumer Price Index report showing inflation slowing, I still expect the Federal Reserve to raise short-term rates one more time following their May meeting before pausing rate increases. This should be the catalyst that allows mortgage rates to start trending lower at a more consistent pace than we have seen so far this year. My current forecast is that rates will continue to move lower with occasional spikes, and that they will hold below 6% in the second half of this year.
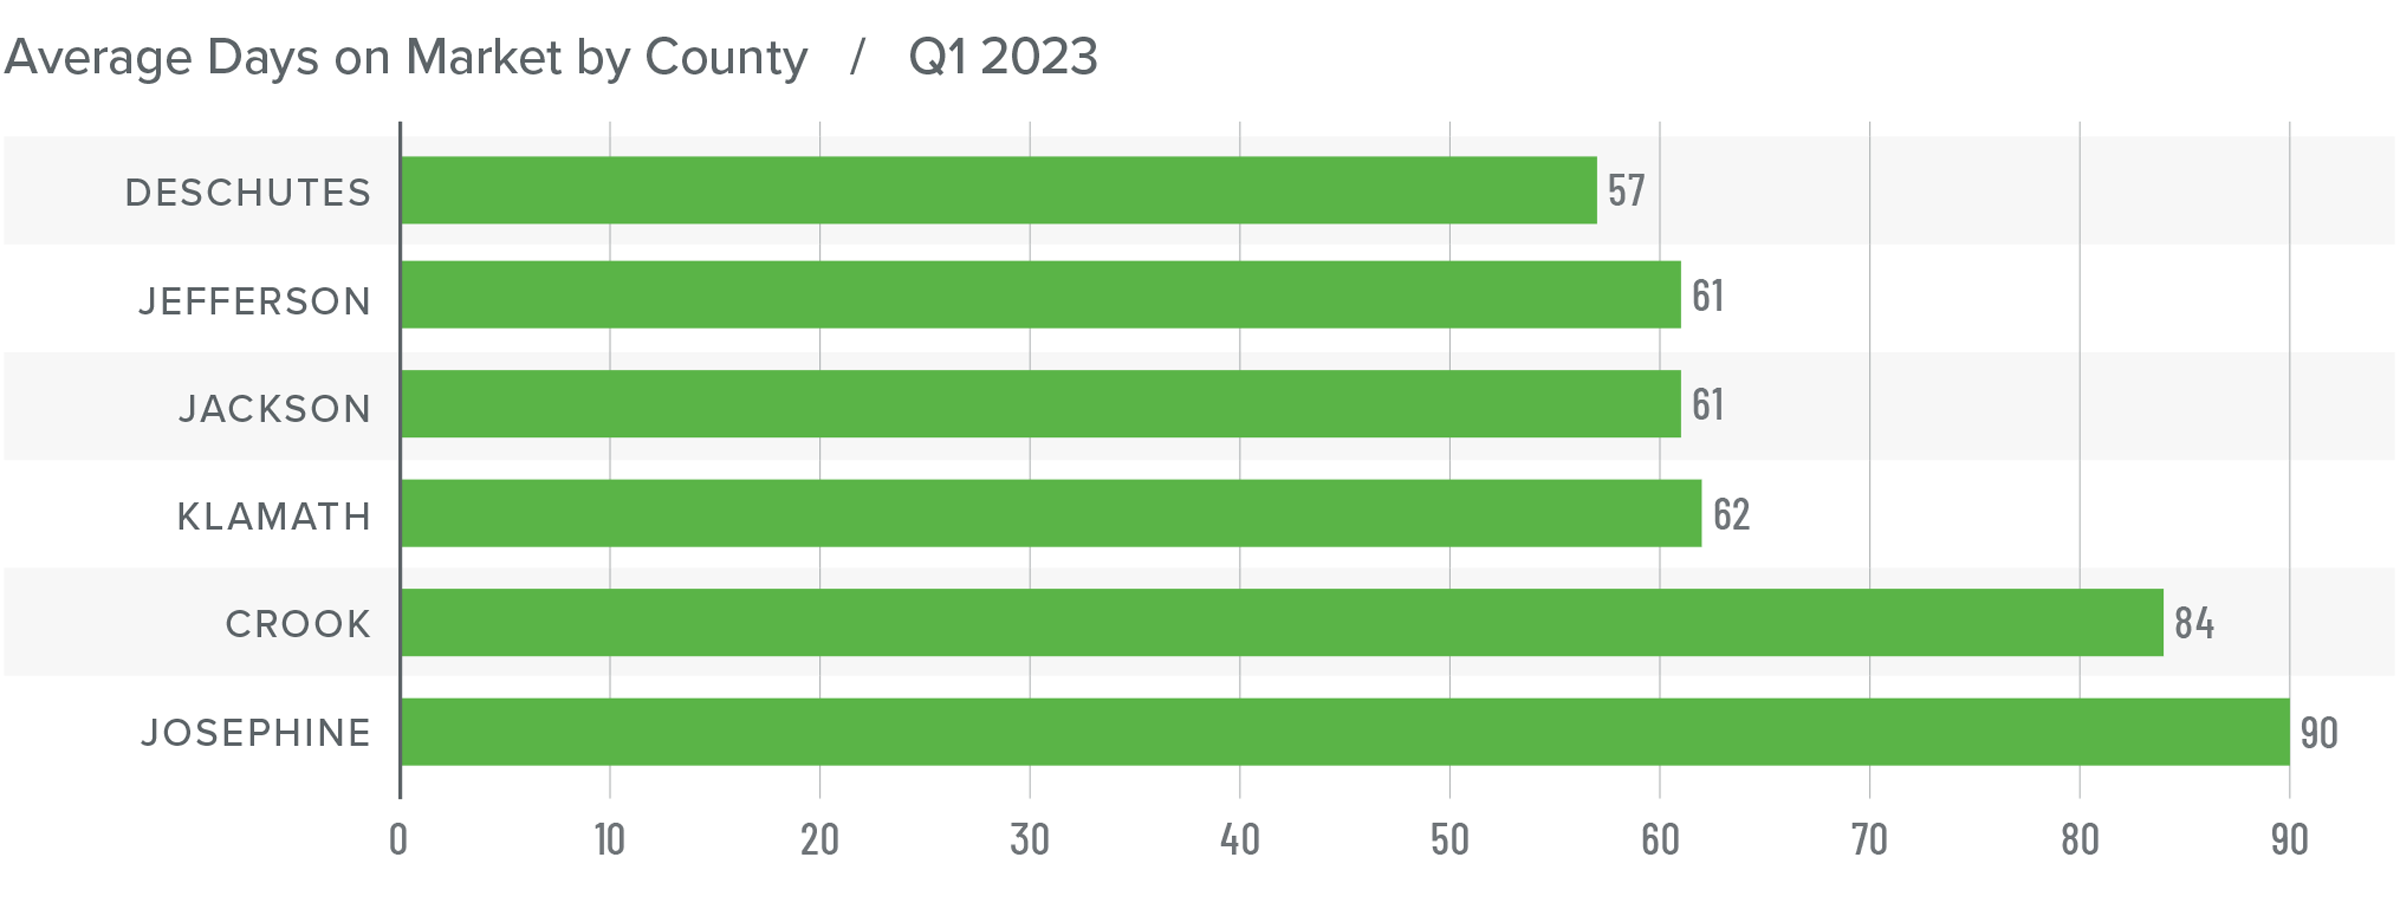
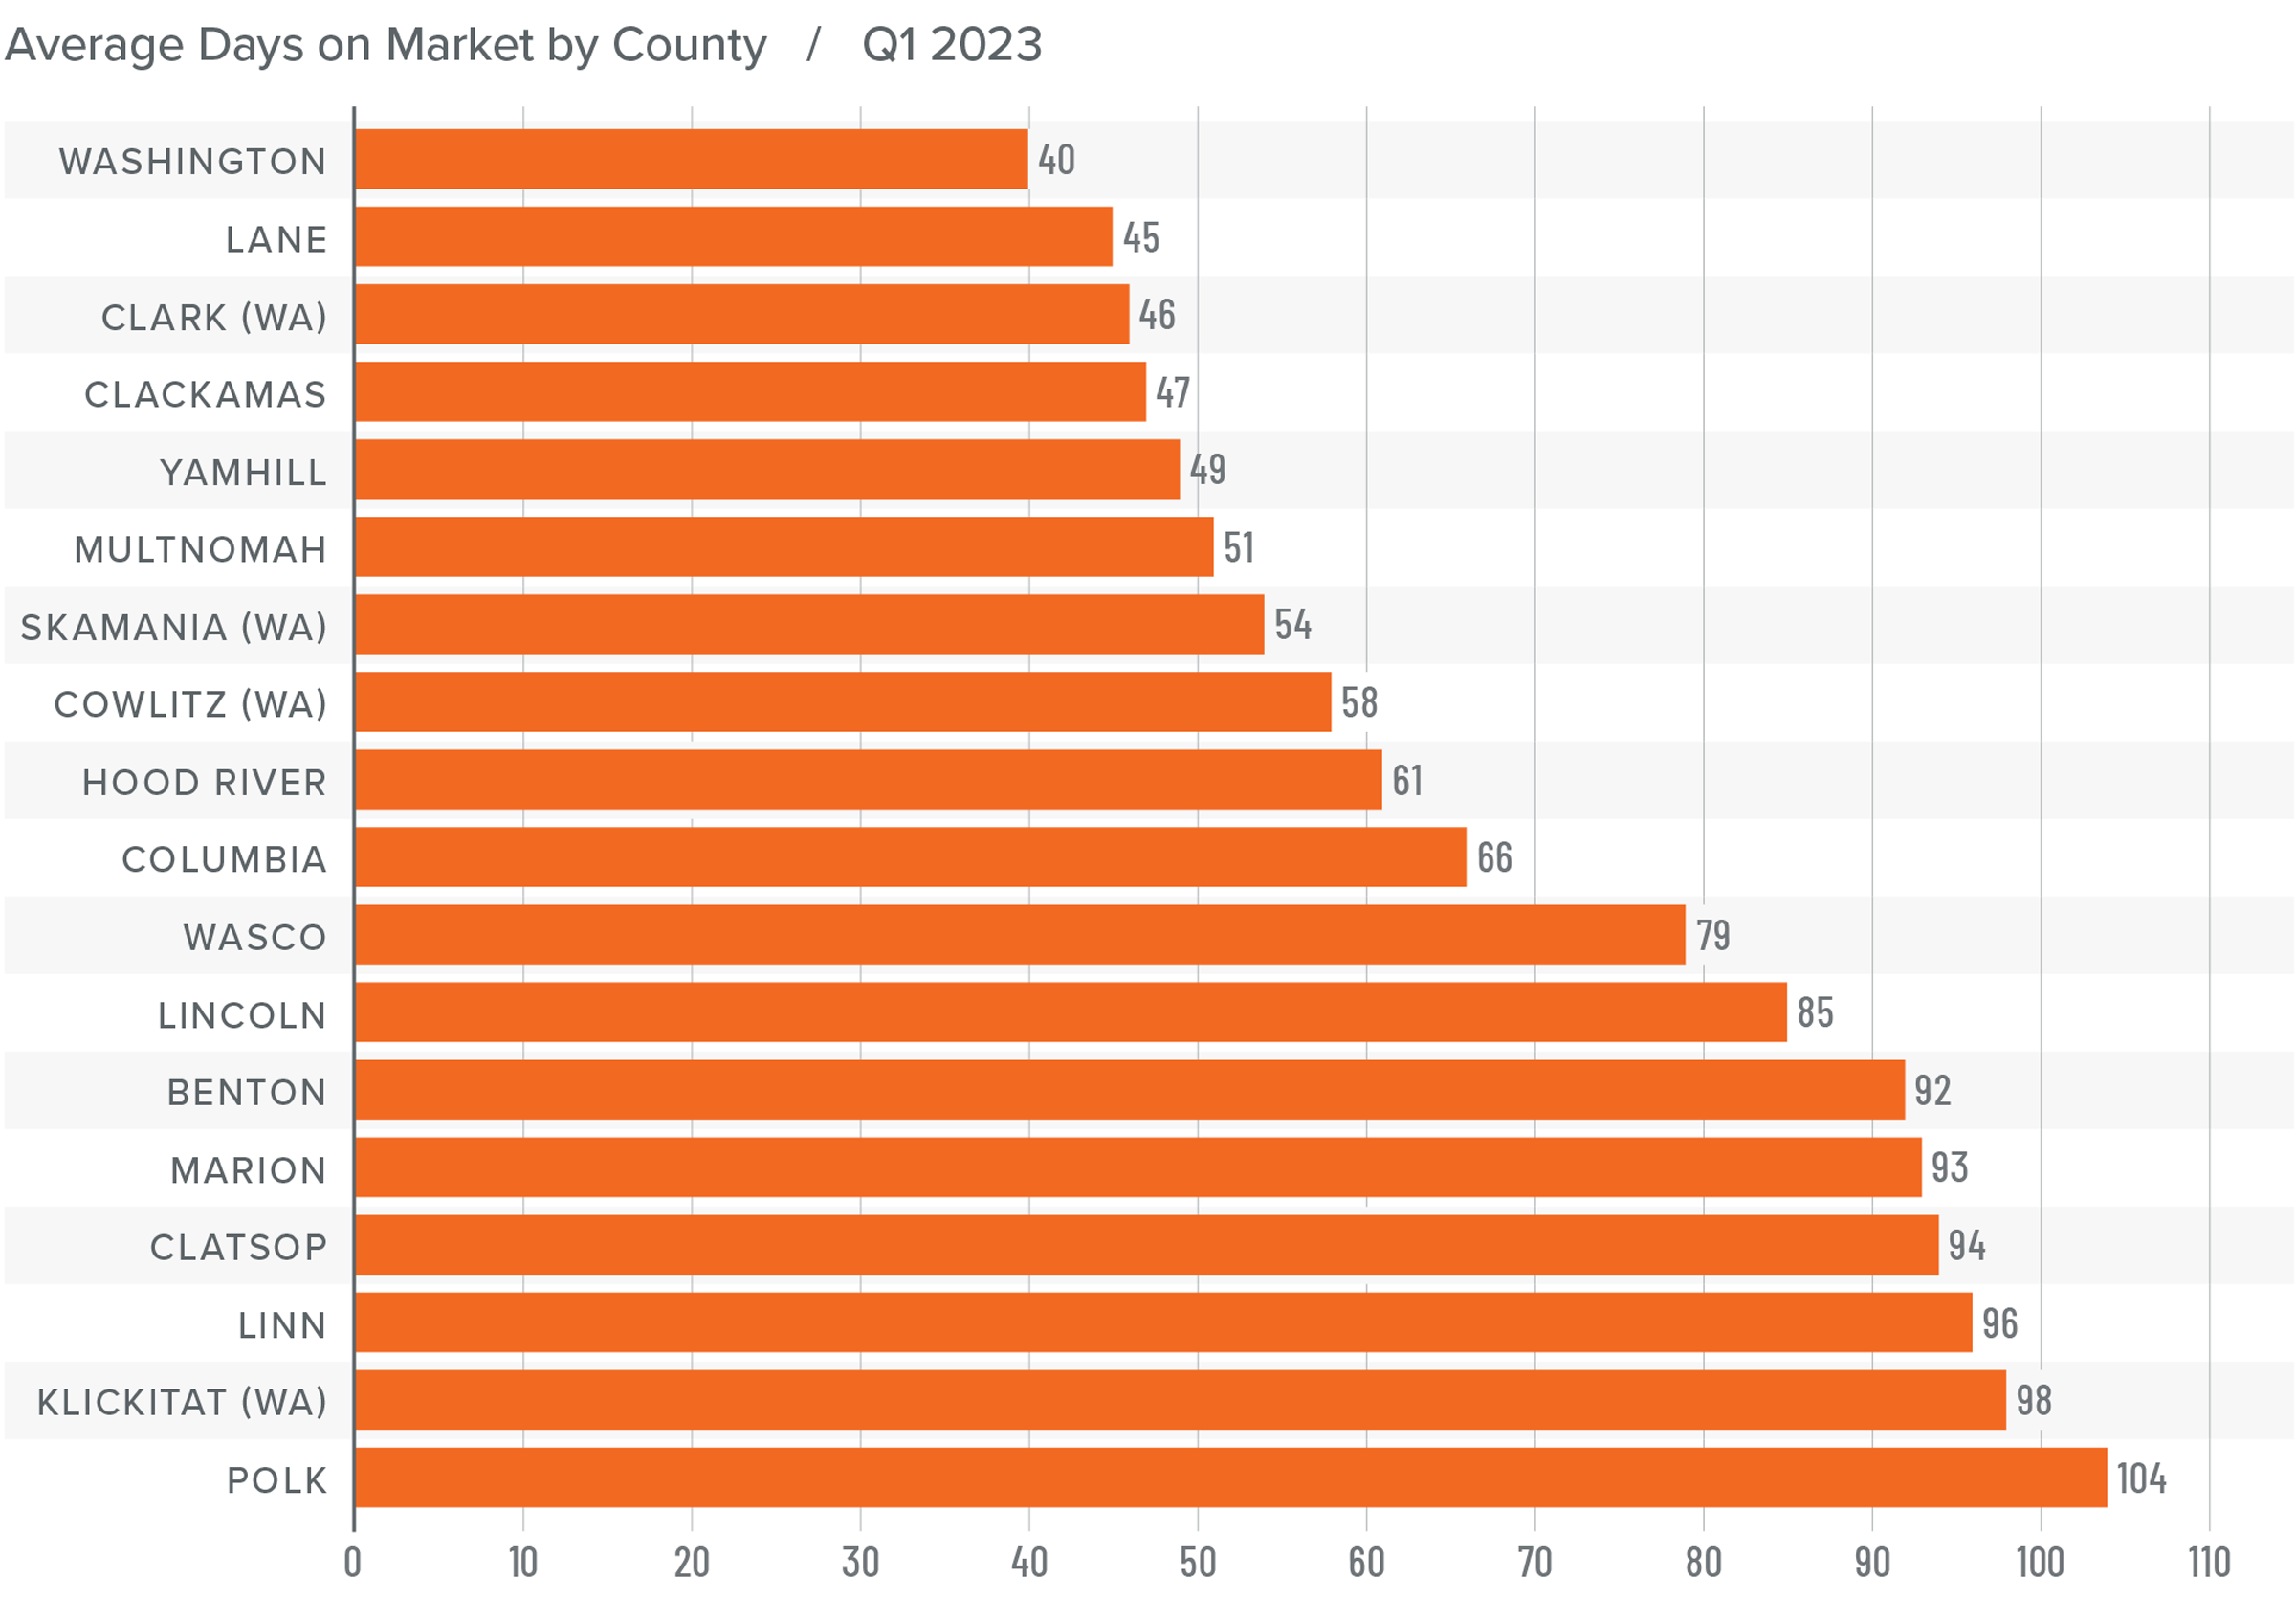
Central and Southern Oregon Days on Market
❱ The average time it took to sell a home in the region rose 29 days compared to the same quarter in 2022. It took 17 more days for a home to go under contract compared to the final quarter of 2022.
❱ The average time it took to sell a home in the first quarter of 2023 was 69 days.
❱ Market time rose in all counties compared to the first quarter of 2022. It took more time for homes to sell in all counties other than Jefferson compared to the fourth quarter of 2022.
❱ Buyers are being far more selective and continue to take their time making an offer on a home.
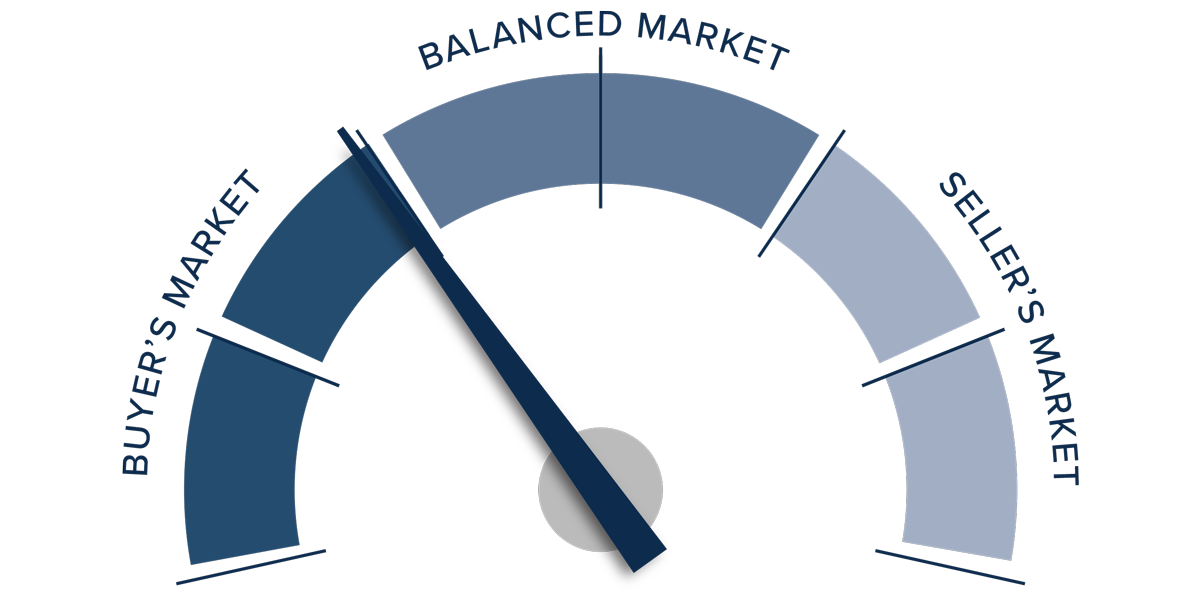
Conclusions
This speedometer reflects the state of the region’s real estate market using housing inventory, price gains, home sales, interest rates, and larger economic factors.
Lower sales, longer market time, and lower listing and home sale prices tell me that buyers currently have the upper hand. As such, sellers have had to adjust to market conditions they haven’t seen in several years. That said, prices have pulled back a fair amount over the past two quarters. If mortgage rates approach the 6% level in the late spring/early summer months, it’s quite possible that the housing market will stabilize and home prices will start to rise again.
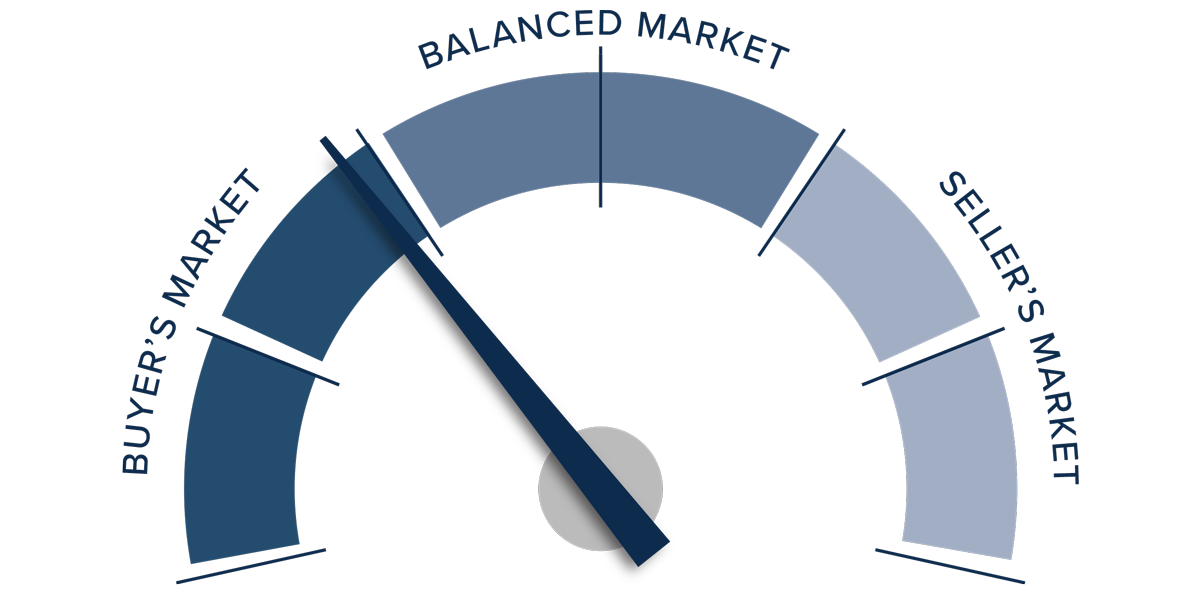
Given all the data contained in this report, I have decided that the market now favors home buyers. However, as I mention above, if stability is found, the needle will certainly move back toward sellers.
About Matthew Gardner

As Chief Economist for Windermere Real Estate, Matthew Gardner is responsible for analyzing and interpreting economic data and its impact on the real estate market on both a local and national level. Matthew has over 30 years of professional experience both in the U.S. and U.K.
In addition to his day-to-day responsibilities, Matthew sits on the Washington State Governors Council of Economic Advisors; chairs the Board of Trustees at the Washington Center for Real Estate Research at the University of Washington; and is an Advisory Board Member at the Runstad Center for Real Estate Studies at the University of Washington where he also lectures in real estate economics.


")


