
 Facebook
 X
X
 Pinterest
 Copy Link

On this week’s episode of “Monday with Matthew,” our Chief Economist, Matthew Gardner, analyzes the surprisingly strong U.S. Job Market Report from October. This video was recorded Friday, November 6th.
On the first Friday of the month, we economists get our hands on the latest US employment report and the October numbers are out and there’s a lot worth discussing, so let’s get to the figures.
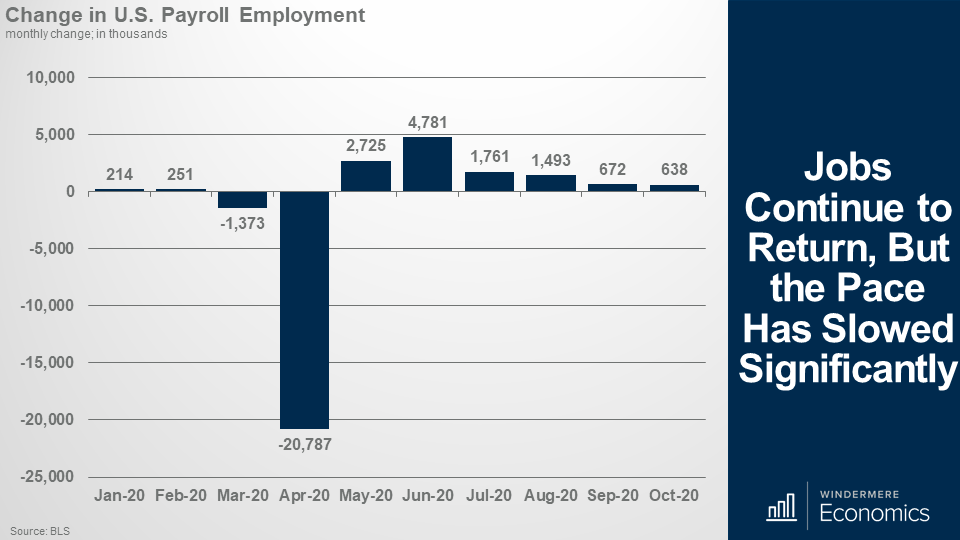
The country added 638,000 jobs in October and, although some would say that it was a mediocre number, it was well above the consensus forecast which anticipated just 530,000 jobs and it also came in above my forecast for 600,000 jobs. You see, 638,000 was actually surprisingly strong. Why? Well, Coronavirus cases are on the increase again and it would be natural to assume that this would impact the number of jobs returning.
But before we all get too carried away – let’s look at it in a slightly different way.
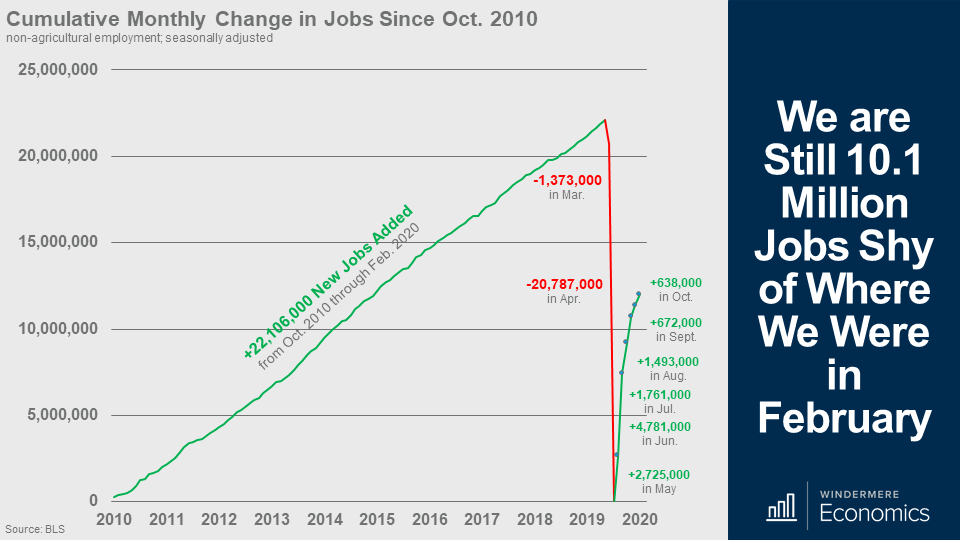
And as you can see here, the country added 22.1 million jobs between the fall of 2010 and February of this year. Now when the pandemic hit, we lost almost the same number, 22.2 million jobs went away but what was remarkable was that we lost almost 10 years of job gains in just 2 months.
And although jobs started to return in May, we are still down by 10.1 million from where we were in February of this year and you can also see that the pace of improvement has certainly slowed.
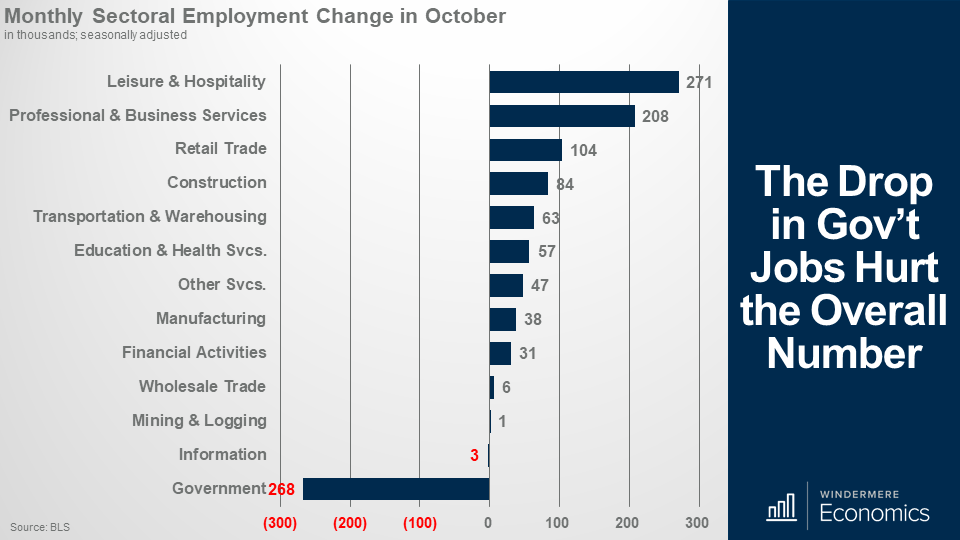
Looking now at where jobs were added, the biggest gains came in what was the hardest-hit sector during the pandemic, leisure and hospitality, with 271,000 jobs returning, but hotels are still suffering as, of that total, bars and restaurants saw 192,000 jobs return, but the country only added 79,000 hotel jobs.
It’s also worth mentioning that the total gain would have been higher but look at government employment. It dropped by 268,000 and was actually inflated because of the loss of 147,000 Census workers.
And you can also see that Professional and Business Services rose 208,000 and retail added 104,000, and that was mostly in electronics and appliance stores because we all appear to be on a buying spree right now, and 31,000 jobs were added in that sub-sector.
Construction also posted a healthy gain, up 84,000, while manufacturing rose by 83,000, even though the sector remains well below its pre-pandemic level.
I would also add that private companies added decent 906,000 workers, which was up by 14,000 from September so the contraction in government jobs certainly impacted the overall growth number.
So far, the numbers could have been worse, but there was some data that wasn’t as pleasing and it concerns furloughed and permanently laid off workers.
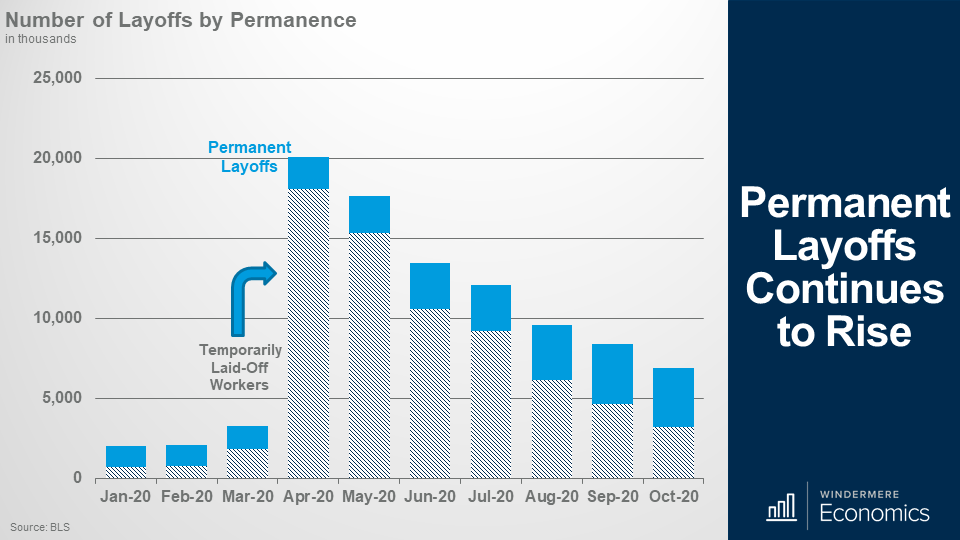
Now, you can see that the number of furloughed – or temporarily laid-off – workers is dropping but it still came in at 3.2 million – even if that is down from a peak of 18 million back in April.
But you will also see that the number of permanent layoffs continues to rise. That number is now at 3.7 million, it is down from 3.8 million seen in September, but the trend is still headed higher.
Now you see, this is very worrying, and gives me another reason to believe that a full recovery in jobs is still a long way away.
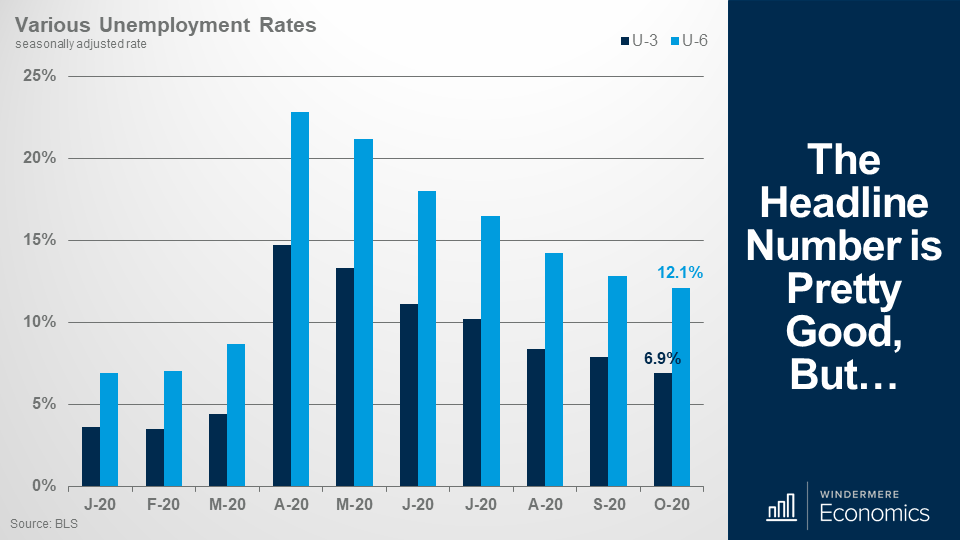
Of course, 1.4 million fewer furloughed workers allowed the unemployment rate to drop a lot – breaking back below 7% and a full percentage point lower than it was in September and I will also add that this too was well below the consensus forecasts which called for the rate to come in at 7.7%.
Additionally, the broader U-6 rate (which includes people out of work but who aren’t actively looking for a job) also pulled back from 12.8% to 12.1%.
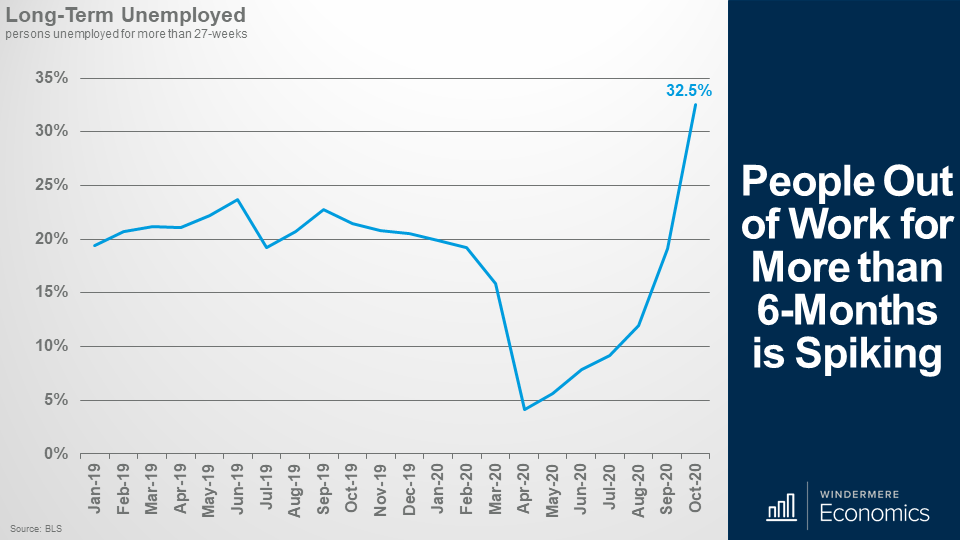
Of course, it was good to see the unemployment rate drop but, again, it wasn’t all good news, because the number of people out of work for more than six months surged by 1.2 million. Today, around a third of all unemployed persons have been out of work for at least six months and the October rate is also quickly approaching the peak seen during the aftermath of the Great Recession when about 45% of unemployed workers were out of work more than half a year.
And this is an important metric because workers who remain out of a job for this long enter a financially precarious period and the contested election reduces the chances of another stimulus package coming this year. But even if more fiscal stimulus is agreed on, it will likely be smaller than is needed.
As I mentioned earlier, even though private payrolls rose by a decent 906,000, the labor market recovery still has a long way to go.
The number of people working in America today is back at a level last seen in late 2015 and, at October’s pace, it would still take about another 16 months for employment to return to its pre-pandemic level.
I still expect that we will see a slow return to work, but the numbers are likely to remain muted until a vaccine or inoculation is not only freely available – but it has to be one that we feel comfortable taking as well.
The bottom line is that the report could have been worse, but it could also have been better too.
With that, as always, if you’ve got any questions about my comments today, I’d love to hear from you but in the meantime, take care out there, and I look forward to seeing you all again – in a couple of weeks.


 This speedometer reflects the state of the region’s real estate market using housing inventory, price gains, home sales, interest rates, and larger economic factors.
 As Chief Economist for Windermere Real Estate, Matthew Gardner is responsible for analyzing and interpreting economic data and its impact on the real estate market on both a local and national level. Matthew has over 30 years of professional experience both in the U.S. and U.K.
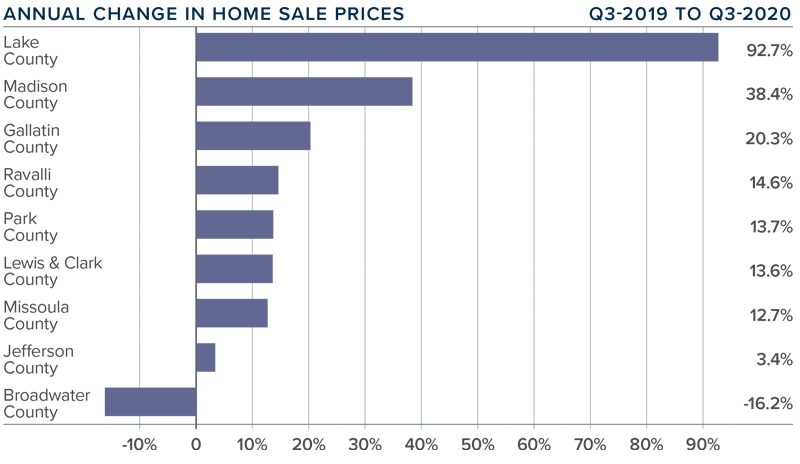
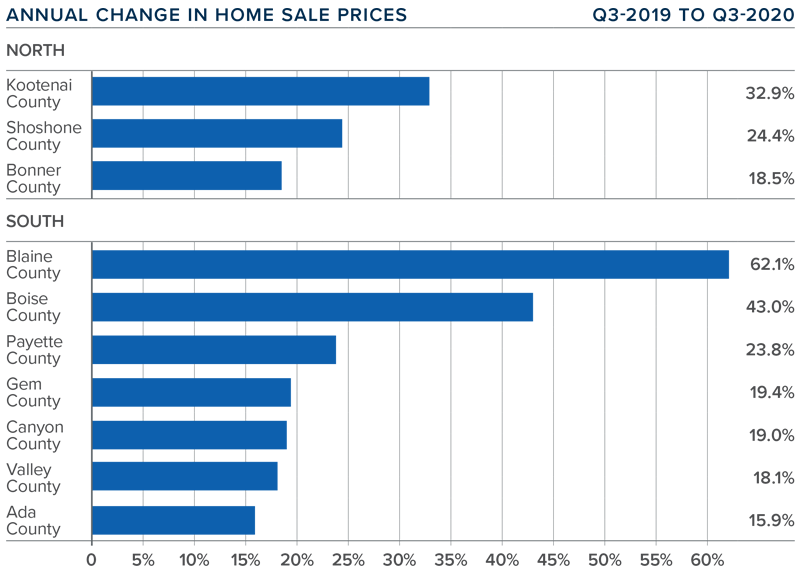
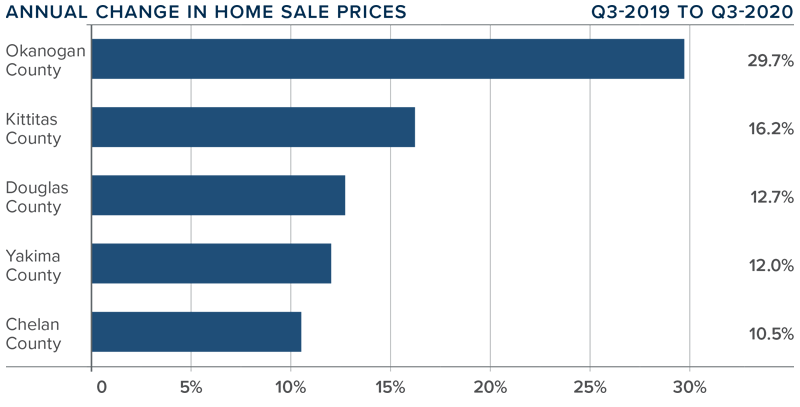
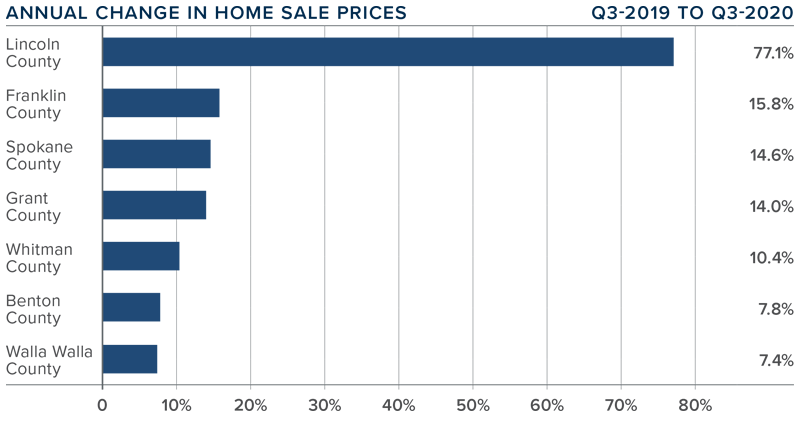
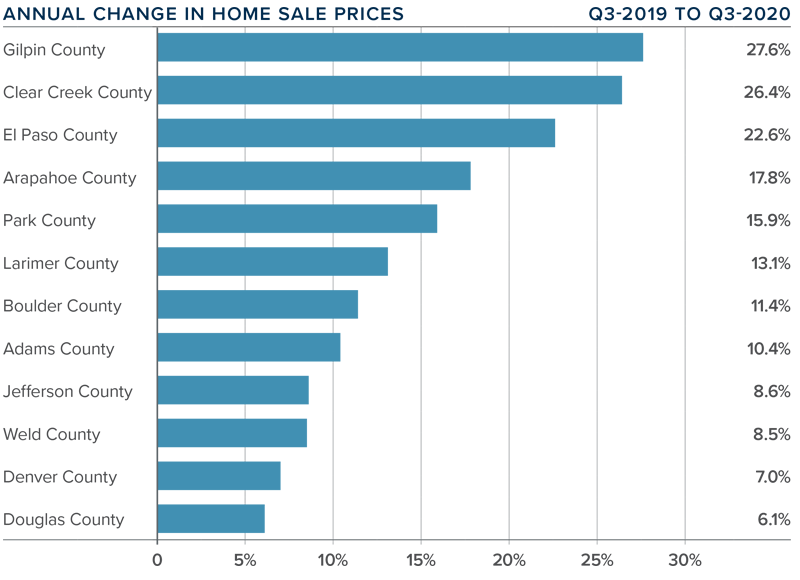
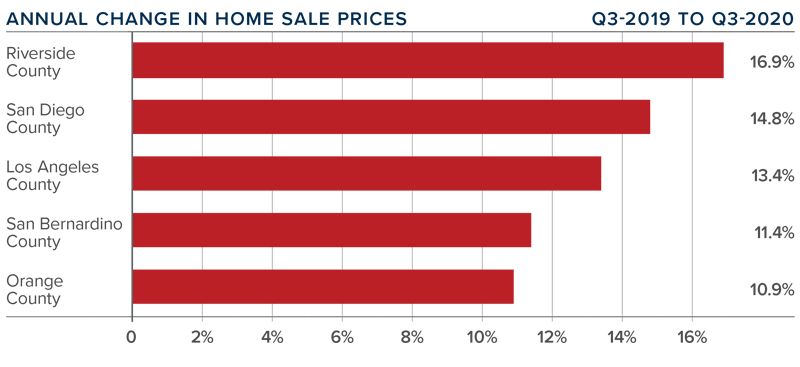
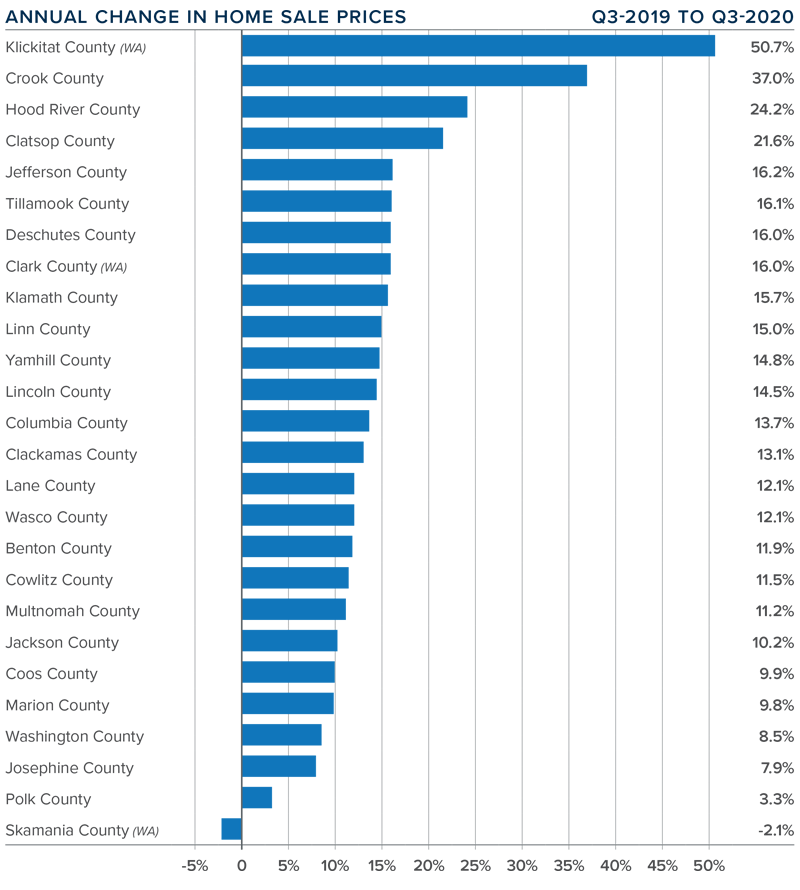
 ❱ The average home price in the region continued to rise in the third quarter, with a year-over-year increase of an impressive 15% to $432,640. Home prices were also 5.9% higher than in the second quarter of 2020.
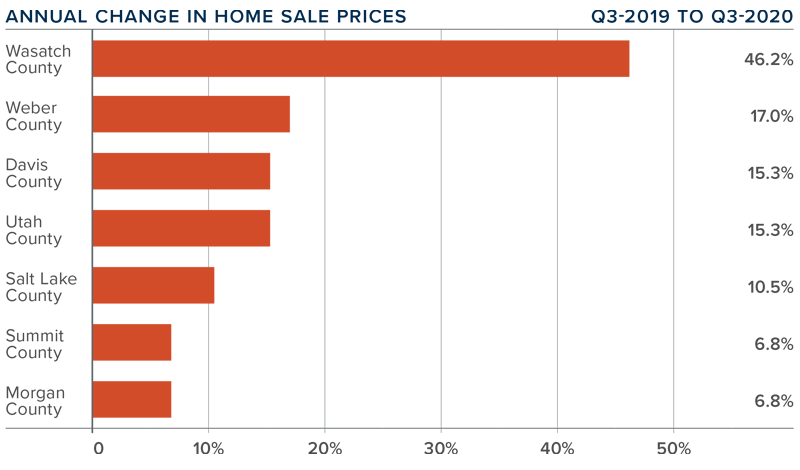
 This speedometer reflects the state of the region’s real estate market using housing inventory, price gains, home sales, interest rates, and larger economic factors.
 This speedometer reflects the state of the region’s real estate market using housing inventory, price gains, home sales, interest rates, and larger economic factors.
  As Chief Economist for Windermere Real Estate, Matthew Gardner is responsible for analyzing and interpreting economic data and its impact on the real estate market on both a local and national level. Matthew has over 30 years of professional experience both in the U.S. and U.K.
 This speedometer reflects the state of the region’s real estate market using housing inventory, price gains, home sales, interest rates, and larger economic factors.
 This speedometer reflects the state of the region’s real estate market using housing inventory, price gains, home sales, interest rates, and larger economic factors.
 This speedometer reflects the state of the region’s real estate market using housing inventory, price gains, home sales, interest rates, and larger economic factors.

 This speedometer reflects the state of the region’s real estate market using housing inventory, price gains, home sales, interest rates, and larger economic factors.
 This speedometer reflects the state of the region’s real estate market using housing inventory, price gains, home sales, interest rates, and larger economic factors.
 This speedometer reflects the state of the region’s real
 ")


