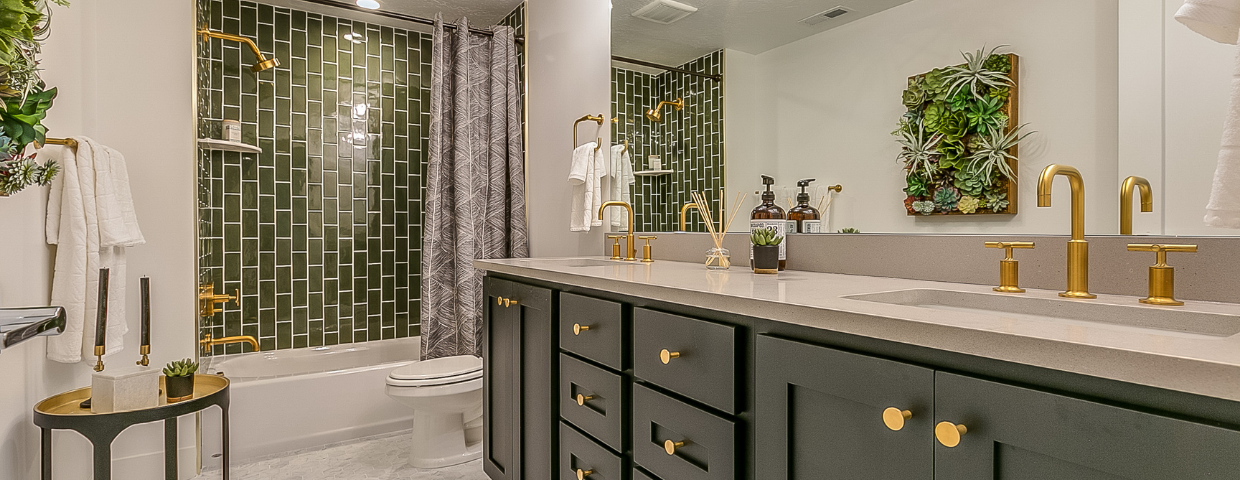
The thought of upgrading a bathroom often brings to mind large-scale renovations, demolition, and hefty price tags. Even projects like replacing a backsplash or repairing tile can be more involved than you might think. However, it’s possible to give your bathroom a makeover without breaking the bank (or your back). Whether you’re looking to just freshen it up or make it feel like your own personal spa, these simple projects can help take your bathroom to the next level.
Upgrade Your Décor
If you want to make a big splash without spending big money, consider upgrading your bathroom with new décor. A fresh coat of paint on the walls or a bold, patterned wallpaper can completely change the character of the space, while accent pieces like a new shower curtain and towel racks can reinforce your color choices. Installing shelving is a simple, functional tactic that gives dimension to your walls. Whether it’s in the shower, above your toilet, or beside your vanity, a shelf can save surface space while helping to tie the room together.
Upgrade Your Tub
Upgrading your tub doesn’t have to mean buying a replacement. Simply refinishing your tub will have it looking brand new and helps you save money. Over time, tubs accumulate cracks, dings, and discoloration due to mold, but refinishing can cure these imperfections right away. Start by removing all hardware from the tub. Sand the whole surface, fill in any cracks or holes with putty or epoxy, then sand them smooth. Apply multiple layers of primer and topcoat, give it a buff, and enjoy your brand-new bathtub.
If refinishing your tub is too much to handle, consider simply touching it up. Fill in any cracks and apply a fresh line of caulking around the surface. After this is done, shop around for new tub hardware to polish off your cost-effective bathtub makeover.
Upgrade Your Vanity
With just a few tweaks, you can turn your vanity area from a mirror with counter space to an impactful centerpiece. Instead of going all out with a new cabinet install, simply replacing your cabinet hardware and drawer pulls can make a big difference. Think of ways your new hardware can reinforce the style of your bathroom. Match them with your shower rod, faucet, and showerhead to make your bathroom more eye-catching.
Your vanity also offers a great opportunity to add some color to your bathroom. Giving it a fresh coat of paint will help to liven up the space at a low cost. For wooden vanities, a re-stain is a great way to give them new life. Start by removing the doors and drawers. Apply wood stripping to all surfaces, then let them sit for the recommended time. Now you can begin to scrape away the old finish. Sand down all surfaces and apply the primer before staining the wood. Once your stain settles in, apply a second coat and your vanity will be good as new.
Finishing Touches
Well-organized surfaces and compartments will help to create serenity in your bathroom. Whether it’s in the shower, the medicine cabinet, or below the vanity, look for multipurpose organizers that help cut down on bathroom clutter and save space. Add in natural elements like bamboo and river rocks to make your bathroom feel like a soothing sanctuary.
For more ideas on affordable home makeovers, check out our tips for upgrading your bedroom, home office, and kitchen.
There is an important distinction to made between two important steps of your mortgage application process: pre-qualification and pre-approval. They are similar in that they both help to inform your financial standing, but there are key differences between the two.
Pre-qualification
Pre-qualification is the first step in your mortgage application process. It will help you to understand the approximate loan amount you can expect to qualify for. You’ll begin by sharing your financial information—debt, income, assets, etc.—with you bank or lender. After reviewing the information, the bank or lender will give a loan estimate. The process is relatively simple, only taking a few business days to process.
Pre-approval
The pre-approval process is more involved than pre-qualification. After submitting a mortgage application, your lender will require all the necessary info to conduct a thorough credit history check and review of your financial health. Getting pre-approved will give you a better idea of how much you can borrow, estimated monthly costs, and what interest rates you can expect on your loans. Mortgage pre-approvals are typically valid for 60 to 90 days.
Once you’re pre-approved, it’s helpful to know which homes you can afford. Use our free Home Monthly Payment Calculator by clicking the button below. With current rates based on national averages and customizable mortgage terms, you can experiment with different values to get an estimate of your monthly payment for any listing price.
Benefits of Pre-Approval
Credibility
The truth is, each home on the market can only go to one buyer. To maximize the chance that your offer is accepted, sellers need to know that your offer is serious. Getting pre-approved shows that you are financially prepared and, in the event that your offer is accepted, there will be no hold ups in obtaining your mortgage. This assurance is what sellers want to know about their potential buyers, especially in a seller’s market.
Home Search
Not only does pre-approval help to bolster your case as a buyer, but it also Indicates your affordable price range. By knowing your budget, you will be able to hone your home search and start preparing offers, eliminating any potential wasted time looking at houses you can’t afford.
Closing Process
Once your offer is accepted, you’ll be counting down the days to move-in. Unfortunately, the closing process can often drag on, leaving buyers feeling like they’re in post-purchase limbo. Pre-approval will speed up the closing process, since the mortgage approvals have already been taken care of, allowing you to focus on next steps like appraisals and inspections.
When to Get Pre-Approved
Being financially prepared for a home purchase is a solid indicator that you’re ready to go about getting pre-approved, but what does that look like? Buying a house means taking on serious debt, so it’s worth your while to begin forming a long-term strategy for paying off outstanding debt before getting pre-approved. Having adequate savings for a down payment is a sign that you’re ready to make your offer.
For any questions about the home buying process, click the button below to connect with an experienced Windermere Real Estate agent.
Hello there and welcome to February’s edition of Mondays with Matthew.
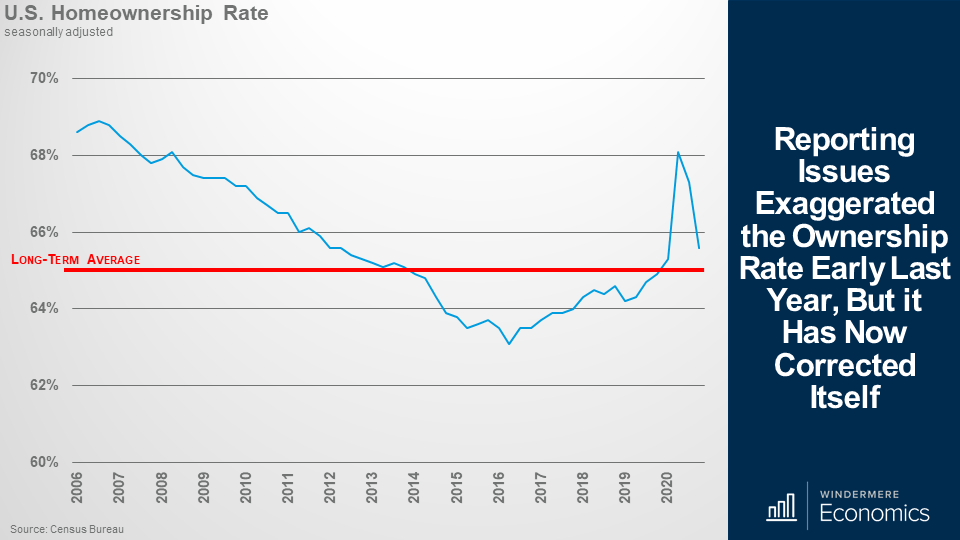
Well, there were a lot of housing-related data releases in the month that are worthy of discussion so let’s get straight to it. I am going to start out with the latest homeownership data that was just released by the Census Bureau.
Those of you who regularly watch my videos may remember that last year I suggested that the data may have been a little bit suspect – specifically when it came to the second and third quarter ownership rates.
Anyway, for those that didn’t see me address this, or if you have forgotten, I had a concern about the significant spike in the ownership rate that you can see here, and I suggested that it might be suspect because of the way the data was gathered during the early days of COVID. You see, the survey was done via telephone and not in person – as it usually is – because of COVID-19 restrictions and I believe that this actually led to an over-reporting of the real ownership rate.
Following the massive spike we saw in the second quarter, it appears that they have found a way to more accurately gather the data and the rate has now pulled back to a level that, at least for me, passes my “sniff test”! However, even though the share of US households who own their homes did drop, it still remains above the long-term average and stands at a level we haven’t seen since 2012.
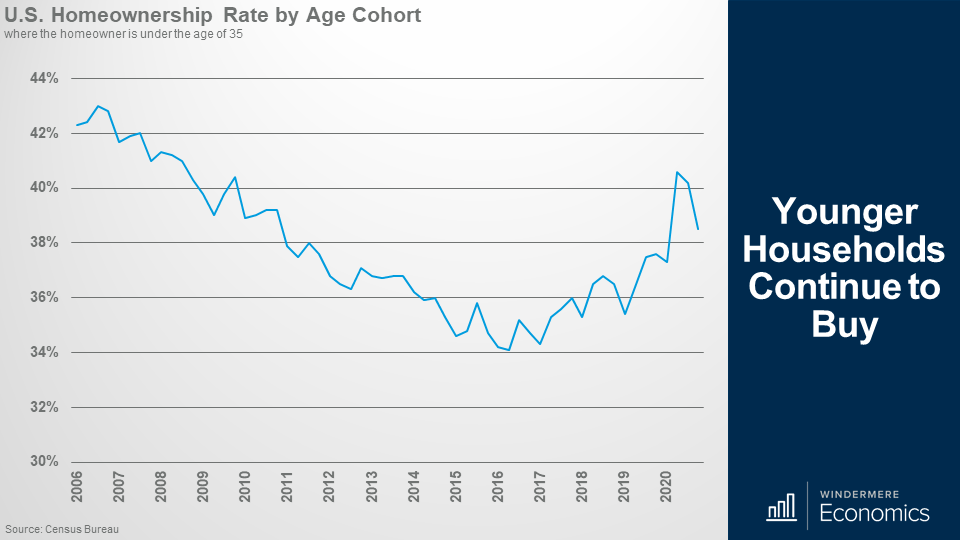
Younger Households Continue to Buy
And when we drill down into the data and look at the ownership rate for Millennials – I know, I harp on about them a lot – but you can clearly see that they really are becoming homeowners in increasing numbers and the current rate of 38.5% is a share not seen since 2011 and I expect to see this number grow over the next several years.
Demographics are driving them into homeownership as they are all getting older, many now starting families and they want to own a home. I would also add that I would not be surprised to see them shift toward ownership at even faster rates if they are allowed to work from home which may lead more of them to leave expensive cities and move to markets where it’s more affordable to buy.
And to give you a different perspective on these younger buyers, last week the New York Fed released their report on household debt that included numbers regarding the share of mortgage borrowing by age. Well, you can see in the above graph, that younger buyers continue to account for a major share of total mortgage borrowing and are borrowing pretty substantial amounts too.
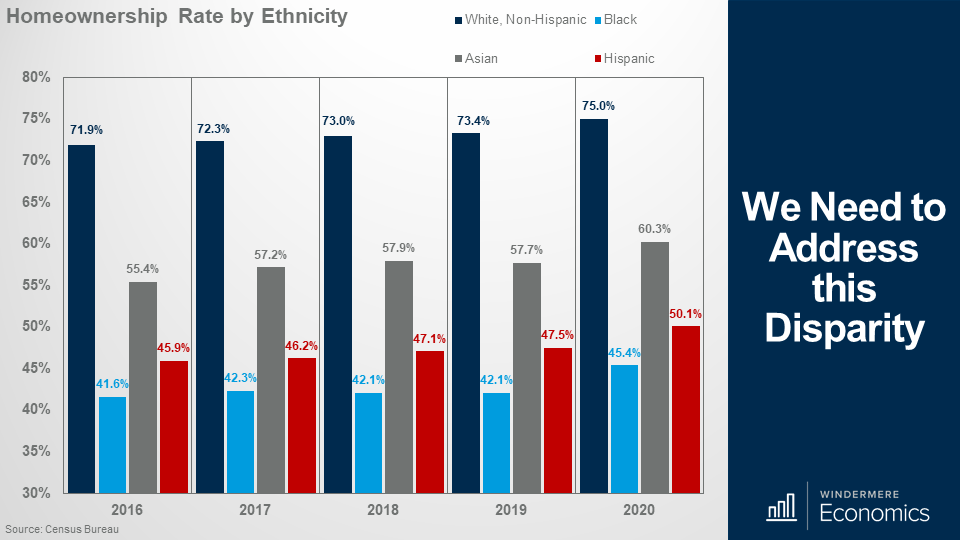
In fact, in 2020 Millennial and Gen Z households borrowed over $1.3 trillion to buy homes and that’s over 35% of total new mortgage debt on a dollar basis. Although I think it’s great to see younger households grow as homeowners and the overall homeownership rate rising, all is not as I would like to see it – especially when we break down the homeownership rate by ethnicity.
And the above report, again from the Census Bureau, showed that although the share of white households who own their homes ticked up it also showed some significant disparities with the ownership rate for black households – although up a little – still well below the levels seen with other ethnicities.
This is a long-term, and systemic issue, that needs to be addressed.
The bottom line is that the ownership rate for Black families was 25 percentage points lower than that for white families in 2020 and was even higher in the 4th quarter of the year when it almost hit 30%.
I am pleased that the Biden administration does have plans to try to address this inequality by looking to expand the ability of the Federal Housing Authority to provide mortgages and this might, if it gets approved, start to address this very significant issue. Of course, nothing will be fixed immediately, but it is a major concern and sincerely hope that, over time, this discrepancy will be addressed.
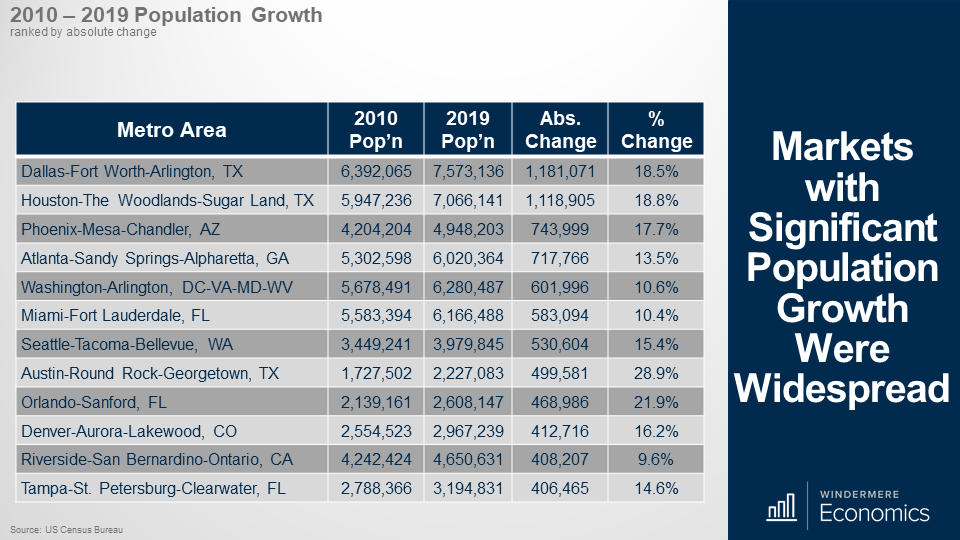
We had a very significant data drop – again from the Census Bureau – who provided their population estimates for 2019. The data may be old, but it is interesting all the same. This table shows the markets with the greatest increase in population between 2010 and 2019.
I will be honest with you that I was not surprised to see Texas lead the way, but it was interesting to see the greater Seattle region, Denver, and Riverside, California all make it close to the top of the list.
And because a couple of markets that were close to the top of the list are of interest to Windermere (as we have offices in these areas) I thought that it would be interesting to look at how some of the other markets where we have a presence are doing and the numbers are equally as impressive.
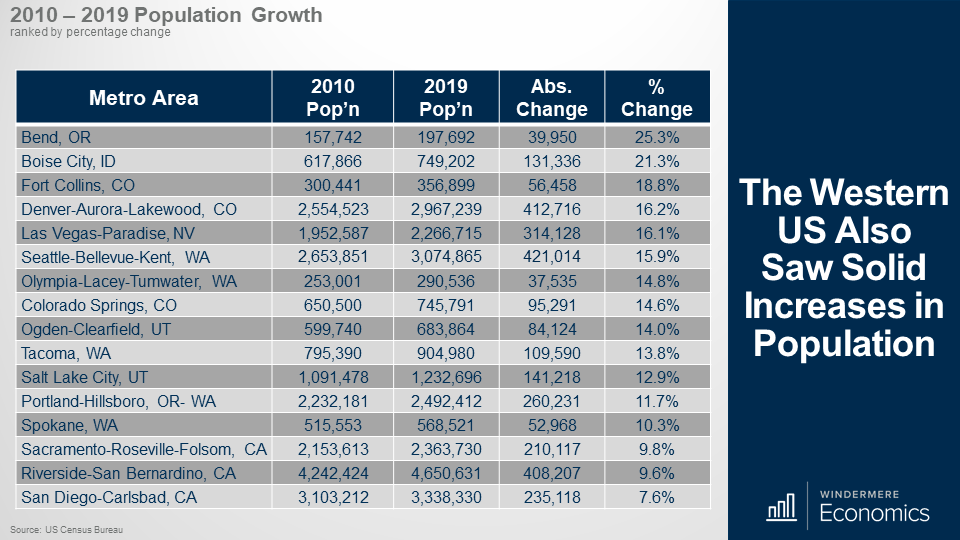
Of course, markets are of different sizes, so to balance this out, the data here shows growth in percentage terms and the numbers are again very impressive.
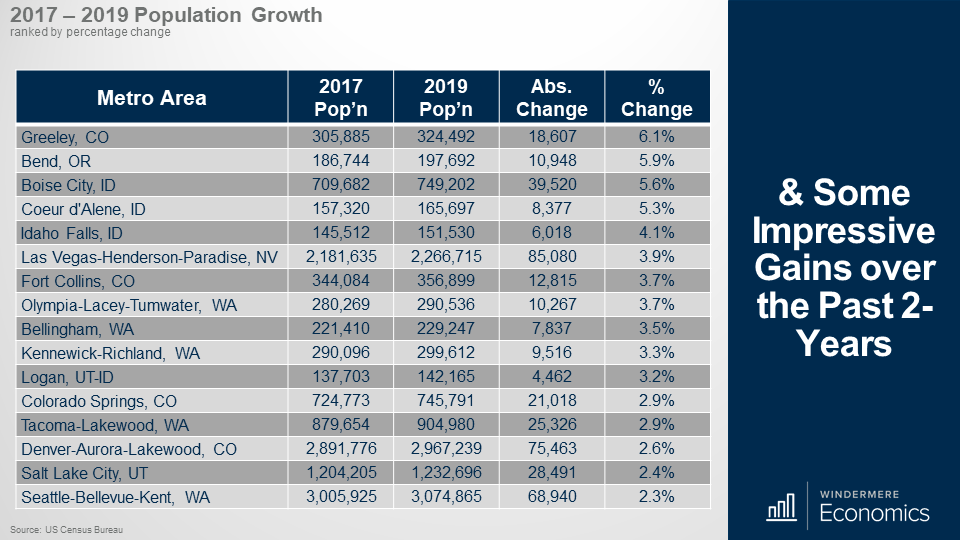
And when I focused on 2-year growth, well it’s again very impressive with significant increases seen in Colorado, several Idaho markets, Las Vegas, Western Washington, and Utah.
And I would also add that Greeley was number one here, but also ranked 4th nationally. Bend came in 7th, Boise 9th, and Coeur d’Alene 10th. Yes, I know that this data is old – it’s an issue I fight with every day – but I still see it as being meaningful.
Of course, I will be very interested to see the 2020 numbers as they will give us an indication as to how COVID-19 really is impacting where we choose to live, but we will have to wait for that!
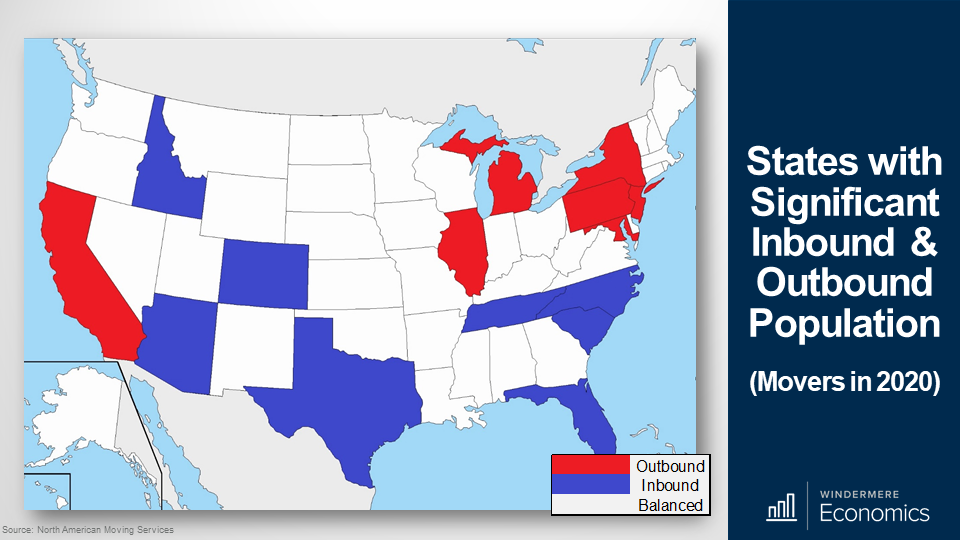
I did read a very interesting report that was recently published by North American Moving Services where they looked at where households who moved between states moved to last year. Of course, it is not a perfect analysis, but it does give us an idea as to not just where people moved to, but where they moved from, in 2020.
Unsurprisingly, the largest out-migration states included California – where people were mainly moving to Texas and Idaho – but there was also significant out-migration from Illinois, New York, and New Jersey.
As far as where most people migrated to, in addition to Idaho, movers were also attracted to Arizona, Colorado, Tennessee, and North and South Carolina.
Interestingly, Northeastern states make up four out of the seven states with the most outbound moves, and none of them make the top eight for inbound moves. Number one was New York which saw significant out-migration. Number 2 was New Jersey and Maryland was just beaten into 4th place by California.
But as far as the western US is concerned, – other than California – people are consistently moving in, and not out.
Also supported by the census numbers we just discussed, the number of households relocating to Idaho has been significant for the past five years and I would add that Colorado has also been in the top-10, or very close to it for the past five years.
Last week we saw the latest data on building permits and starts and although there was a softening in the number of starts in January, permit activity continues to grow significantly with single-family permits up by a massive 3.8% month over month, and 30% higher than seen a year ago. This is good news!
As far as the weakness of starts is concerned, this was primarily due to some builders who remain worried about increasing lumber and other construction material costs, as well as concerns over delays in obtaining building materials because of COVID-19 supply chain issues.
I would add that although single-family starts did drop, the number of homes under construction continued to trend higher. And for those of you who might be wondering how new starts can drop but the number of homes being built can increase, it’s purely terminology. You see, a housing “start” is where a foundation has been poured, but it doesn’t mean that vertical construction has started.
In fact, the number of homes under construction in January was up by 1.1% on the month and is over 16% higher than seen a year ago.
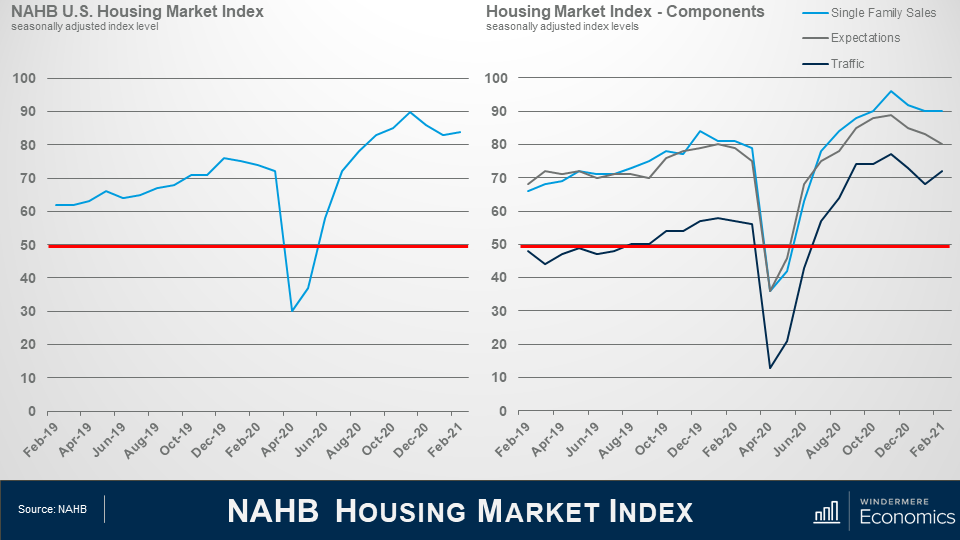
Last week we also got the February take on builder confidence and it was interesting to see it ticking back up as strong buyer demand helped to offset the supply chain challenges and surging lumber prices.
On the right, you will see the three components of the index which showed the gauge of current sales conditions holding steady at 90, while the component measuring sales expectations in the next six months fell three points to 80 but the gauge charting traffic of prospective buyers rising by four points to 72.
Although all are off their peak that was seen last fall, all are above 50 meaning that more builders find the market favorable than not.
So, this was a pretty mixed bag, but the Market Index numbers are more current than the permit and starts report so I will be interested to see what the February housing starts looks like – it wouldn’t surprise me to see a slight uptick in the number.
And finally, the January US housing sales numbers were released by the National Association of Realtors and, well, they were – again – record breaking!
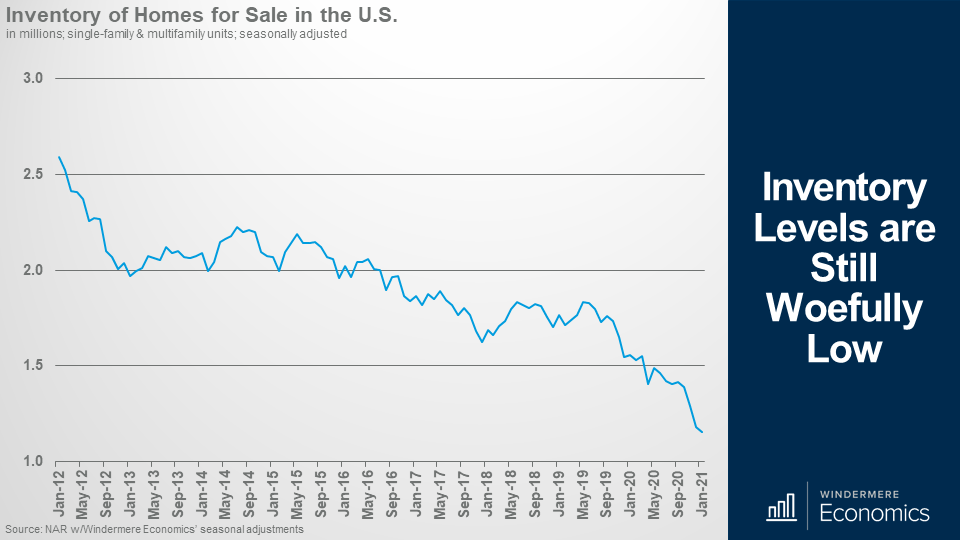
Inventory levels are still woefully low.
On the supply side, any hopes that we might have seen the number of listings rise in January were dashed with total inventory coming in at a measly 1.04 million homes for sale – that’s down 25.7% year-over-year and a new record low in absolute terms, but also a record percentage drop between January of 2020 and January of 2021.
Breaking it down, the number of single-family homes on the market remained static at 880,000 units, but the number of condominium listings dropped a little to 164,000 listings – that’s down from 179,000 in December.
Given the very low number of listings – and sales still very robust – there was just 1.9-months of supply – matching the all-time low we saw in December.
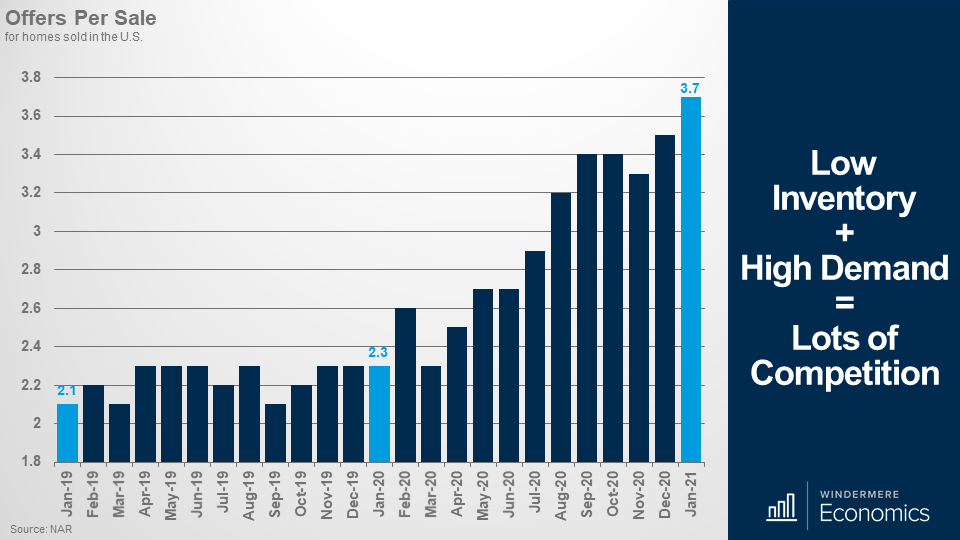
I always find this data set fascinating – and another record has been broken. For every sale that was agreed in January there were an average of 3.7 offers! That’s a massive increase from the old record of 3.5 set just the month before.
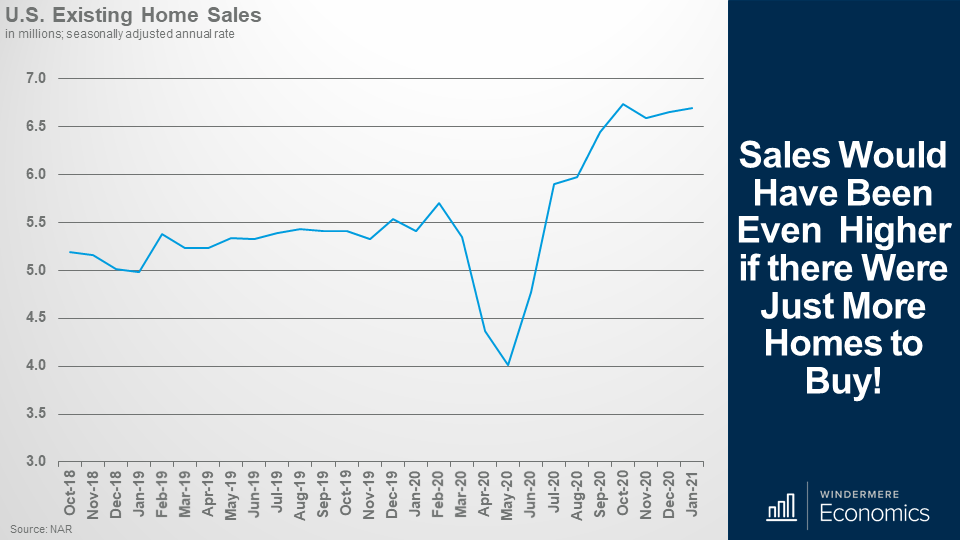
But even with record-low inventory, the number of sales remains very impressive.
Sales would have been even higher if there were just more homes to buy!
Total sales of single-family and multifamily units came in at an annual rate of 6.69 million units in January. That is 0.6% higher than seen in December, and up by a massive 23.7% from a year ago. Sales of single-family homes rose by 23% to an annual rate of 5.93 million units while sales of condos rose by 28.8% to an annual rate of 760,000 units.
Now, some of you may be wondering how this can be? How can sales rise when there are so few homes for sale? And that is a very reasonable question.
You see, the number of homes for sale is the total available on the last day of the month, but sales can still increase because if a home is listed for sale and goes under contract in the same month, well it isn’t included in the inventory numbers for that month.
And in January, properties averaged just 21 days on the market with 71% of them selling within the month.
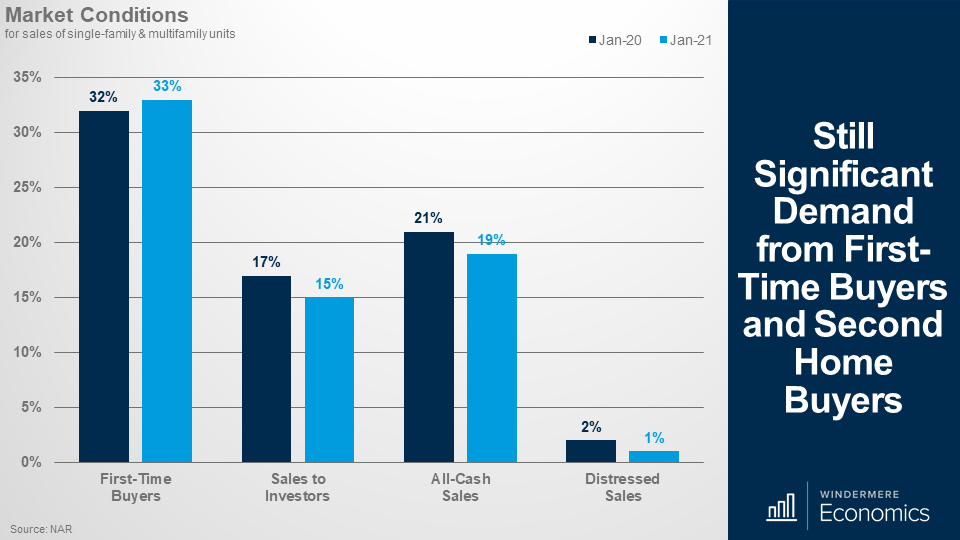
Still significant demand from first-time buyers and second home buyers.
And when we look at the details it was pleasing to see the share of homes that sold to first-time buyers up a little. Sales to investors – and these numbers include many second-home buyers – pulled back a little, but again, not a concern.
And finally, no surprises here – with many homes in forbearance, the share of distressed sales was just 1 percent.
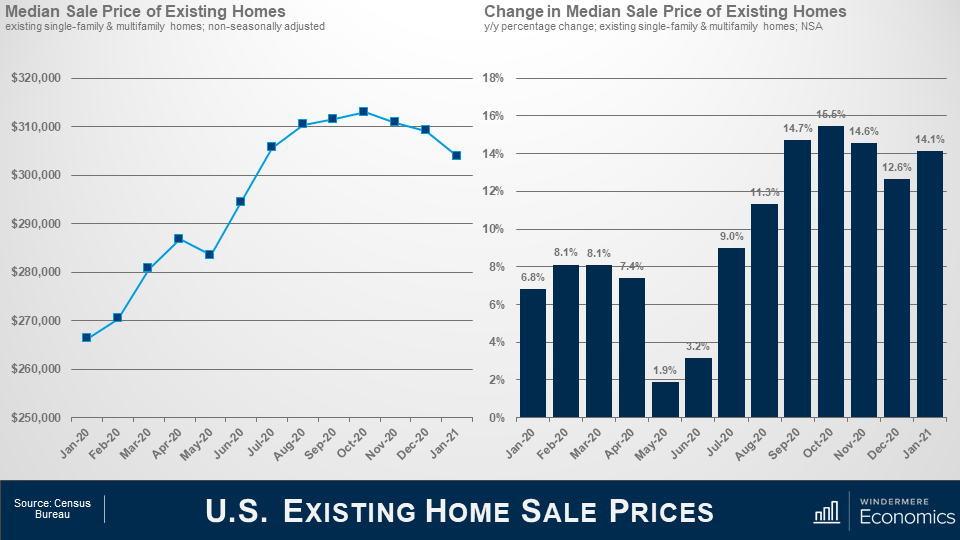
The median sale price in January was $303,900 and that’s up by 14.1% year-over-year. Now, before you get worried about the fact that it appears that prices have plateaued, it’s actually not surprising as it’s mainly a function of seasonality, as well as the limited choice of homes to buy.
Sales of homes in the US priced below $100,000 were down 28% year over year, while sales of homes priced between $500,000 and $750,000 were up 53% year over year, and sales of million-dollar-plus homes were up by 76.7% from a year ago. Geographically, price growth was most robust in the west where they were up by 16.1% year over year. Also, $1 million-plus sales accounted for over 11% of all sales in the western US too.
As I worked through the January numbers, it remains very clear to me that housing remains a shining light as we move through this pandemic period, and I expect this to continue with 2021 being another very good year for the housing market, and home sales rising even more as a vaccine gets more broadly distributed and we reopen more of the country.
So, there you have it. My take on the January housing-related data releases.
In order to sell your home, it must be successfully marketed to potential home buyers. Developing a winning strategy to attract as many buyers as possible to your home is something your real estate agent will work on, and part of that process may include staging.
Staging doesn’t just involve decorating your home; it’s using furniture and décor to reveal the possibilities in the space in order to make it appealing to a wide variety of buyers. It is an important step to helping buyers imagine the space for their own use, and it often leads to a higher dollar value and quicker sale time.
Staging for Buyers
A well-staged home creates stunning photographs that will attract buyers as they search online. In 2020, 97% of home buyers used the internet to search for prospective homes, and about half of them used mobile devices like smart phones and tablets. Because photos on a mobile device can be quite small and easily swipeable, staging has the potential to grab a buyer’s eye and pull them into the listing. Once they visit in person, staging serves to elevate your space while allowing buyers to visualize themselves living in your home.
Investment and ROI
For a relatively low investment, the return on investment (ROI) for a staged listing is worth it for just about any home seller. No matter the size of your home, the average investment on staging is 1% of the sale price of the home. And that 1% investment can lead to amazing gains. According to a 2020 survey by the Real Estate Staging Association, of those who spent 1% on staging, 75% saw a return of 5-15% over the asking price. As this shows, investing in staging can turn into one of the best ways to add value to your home.
In addition to increasing the dollar value of your home, staging is also likely to lead to a quicker sale. In 2020, staged listings sold after an average of 23 days on market. That’s two days faster than the national average of 25 days on market in the same year.
Your real estate agent can connect you with a professional stager who they will work side-by-side with to create a cost-effective strategy for staging your home and getting it sold in the most efficient and effective manner.
For more information on home staging and how to market your home for sale, connect with an experienced Windermere agent today.
Deciding whether to DIY a remodeling project or leave it to a professional is a matter of weighing the risks and rewards, time, and budget. Before you start applying a new coat of paint or go about knocking down a wall, create a plan for your remodel to help you decide which projects you can handle, and which ones belong in the hands of a pro.
Create Your Remodeling Plan
Knowing your plans for your remodel will help to determine your timeline and budget, which will inform your DIY-vs-Pro decision making. Set specific goals for each project so you’ll know when you’re getting off track but remain flexible in your planning to leave room for any unexpected hurdles that will inevitably pop up in the remodeling process. Your budget will also help you decide who should execute certain projects. For example, if you’re budgeting more for a kitchen remodel than any other project, that is a likely candidate for professional help.
If you’re having trouble deciding the best route to take with your remodeling projects, ask yourself the following questions:
What risks am I comfortable taking on?
How much time am I willing to dedicate to this project?
Does this project require a permit?
Do I have any experience with this kind of remodel?
Am I comfortable giving up control of this project?
DIY Remodeling Pros and Cons
Pros:Taking a DIY approach to remodeling projects pays dividends in many ways. Without having to pay labor costs, you stand to save significant money by tackling a project on your own. Going DIY also allows you to set your own schedule for the project. And of course, the sense of ownership and pride you will feel knowing you completed the project on your own is a priceless feeling for a homeowner.
Cons: DIY projects can be consequential. Mistakes at any point in the renovation process can lead to greater costs and sometimes, hiring a professional to fix the mistake. Unfortunately, this can result in the loss of significant time and money.
Professional Remodeling Pros and Cons
Pros: Professionals are inherently more experienced, bringing their specialization to the table on every home renovation project, so you can expect them to perform high-quality work that will increase the value of your home.
Cons: Getting professional quality work means paying for it. When budgeting, expect higher costs for any project you’re thinking of outsourcing to a pro. Bear in mind that, especially for large-scale renovation projects, your home will become a construction site. Accordingly, you may need a back-up plan, such as a temporary kitchen set-up or a short-term rental home.
DIY Remodeling vs Professional Remodeling: Around the House
The following list breaks down which projects are typical DIY candidates and which ones homeowners commonly opt for professional help to complete. However, the decision is ultimately up to you. If you have your heart on tackling a project on your own, gather your tools and make it happen!
Kitchen
Professional: Any large-scale structural changes, new gas lines, or new plumbing projects should be handled by a professional.
DIY:Simpler kitchen projects like a backsplash or faucet replacement and any cabinet finishing tasks are perfect DIY candidates.
Bathroom
Professional: Plumbing installation, running electricity, or any projects involving an expansion or alteration to your bathroom structure.
DIY: If your bathroom is simply in need of some new tile work, basic medicine cabinet restoration, or minor flooring improvements, roll up your sleeves and DIY.
Backyard
Professional: Consider hiring a professional for any significant outdoor projects like concrete builds, in-ground pools, and technical deck work.
DIY: Common backyard DIY projects include building a garden tool shed, building a fence, and refinishing a deck.
General
Professional: It is best to hire pros for new roofing, any foundation work, and extensive demolition projects. For asbestos and drywall finishing, it’s easiest, and safest, to go with the pros.
DIY: Any interior painting projects, basic electrical work, or simple trim and door upgrades.
If you’re planning on going through a remodel while you live at home, read this first. For more information on how certain renovations may impact the value of your home, talk to your Windermere agent.
Valentine’s Day is a time for exchanging gifts, indulging your sweet tooth, and spending time with your significant other. Of all the places you and your Valentine could be, where better to spend the day, than in the place you love most: home sweet home. Let this list of ideas inspire your day at home with the one you love.
Tips for Valentine’s Day at Home
Breakfast in bed: Kick off your Valentine’s Day by preparing breakfast in bed. Surprise your Valentine by waking up early to get a jumpstart on decadent breakfast classics like pancakes, an omelet, or frittata, or keep it simple with donuts and coffee.
Create an at-home spa: Couples massages are a fitting indulgence for Valentine’s Day. Fortunately, you can create the same experience at home. Set the mood by lighting candles and putting on some relaxing music. Take turns applying facial masks and giving each other massages to put you both in a state of relaxation.
Scavenger hunt: Combine the thrill of adventure and your memories as a couple with a scavenger hunt around the house. Create clues tied to memories of your relationship and hide them room-by-room, letting the answer to each clue lead to the next. Get creative and plan something special for discovering the final clue!
What’s for dinner? Spending this special day at home gives you and your Valentine countless options for dinner. If you feel like keeping the kitchen quiet, order in your favorite meal. Otherwise, your culinary team of two can try your hand at a Valentine’s Day staple—fondue. For the full fondue experience, go for three courses: a broth fondue to open the palette; a cheese fondue to pair with bread, sliced meats, and charcuterie; and a chocolate fondue with fruit and pound cake bites to top it all off.
Plan a game night: Add some fun to your Valentine’s Day itinerary by setting aside time to play games. A game will help you and your Valentine relax and have a laugh between the food, drinks, and chocolate. Grab a deck of cards for classic two-player games like Go Fish, Crazy Eights, War, and Rummy. Add in a game of truth or dare or charades to kick your game night into high gear.
Paint and sip: Keep the creative juices flowing this Valentine’s Day at home with a paint-and-sip activity. It’s simple: pick out your favorite wine, set up two easels, and choose a reference image to paint. For some extra laughs, face each other and paint one another’s portrait.
Dance the night away: Make dancing an integral part of your day at home with your Valentine. Whether slow jams or ballroom classics are more your style, pick out a playlist and turn your living room into a dance floor.
Save room for dessert: Be sure to save room for the tastiest part of Valentine’s Day—dessert. Whether you put on the aprons and make dessert together or pick something up from your favorite bakery or chocolatier, no Valentine’s Day would be complete without it. Red Velvet Cake, dark chocolates, cheesecake, and brownies are just some of the can’t-miss classics for you and your partner to enjoy after dinner.
Cuddle up for a movie: At the end of your busy day together, cuddle up, settle in, and turn on a movie. Valentine’s Day is the perfect occasion for a romantic drama or rom-com.
Look to the future: Valentine’s Day is also a time to reflect on the love in your household and where you are headed in the future. What plans or changes lie ahead? How does your home fit with the changes you see coming?
From all of us at Windermere, we wish you and your Valentine a Happy Valentine’s Day!
Restrictive racial covenants—which excluded people of color from purchasing, leasing, or occupying homes in certain neighborhoods, developments, or regions—have been deeply embedded in the practices of the housing industry since the early 20th century. Although the Supreme Court ruled that municipally mandated racial zoning was unconstitutional with 1917’s Buchanan v. Warley, this decision extended only to government action such as city ordinances, and not to private agreements such as restrictive covenants.
This left the door open for discrimination in real estate to continue. The Supreme Court’s 1926 ruling in Corrigan v. Buckley validated the use of racially restrictive covenants, and they quickly became common practice. Shortly thereafter, these restrictions were endorsed by federal housing administrators and lenders alike, creating a system that shaped communities and segregated neighborhoods throughout the country.
In 1948, with Shelley v. Kraemer, the United States Supreme Court ruled that these racial deed restrictions were no longer enforceable. But the structures of segregation remained intact and real estate brokers, agents, and property owners continued to discriminate based on race.
Congress struck a blow against these practices by passing the Fair Housing Act in 1968, which prohibited discrimination on the basis of race, color, religion, or national origin in the sale or rental of housing. However, the language of restrictive racial covenants is still written in the chain of title for many homeowners nationwide.
Striking Restrictive Language By State
As part of our commitment to diversity, equity, and inclusion, Windermere has prepared educational content on how homeowners can remove racially restrictive language from their chain of title. Of the ten states that Windermere operates in, there are processes in place to remove this language in Arizona, California, Colorado, Idaho, Nevada, Oregon, and Washington. Homeowners in Idaho will note that the process to strike restrictive language is subject to change, pending the legislature’s passing of I.C. § 55-616 in 2021. In Hawaii, Montana, and Utah, there is currently no process for the removal of discriminatory covenants from a chain of title, nor is there pending legislation to address the issue. In Hawaii and Utah, although there is legislation in place declaring such covenants void, there is nothing currently in place that permits a court or auditor to strike the restrictive language from the title.
The following analysis of select Maui real estate markets is provided by Windermere Real Estate Chief Economist Matthew Gardner. We hope that this information may assist you with making better-informed real estate decisions. For further information about the housing market in your area, please don’t hesitate to contact your Windermere agent.
Regional Economic Overview
COVID-19’s impact on the Maui economy remains significant, and spikes in new infections in the fall have weighed on the job recovery. That said, the latest available employment data (November) showed that the labor market has recovered more than 13,000 of the jobs that were lost. Total employment is still down 14,750 from the early 2020 levels. With jobs starting to return, the unemployment rate on the island is improving but still stands at a seasonally adjusted rate of 16.6%. That is down from the peak of 33.5% but significantly higher than the 2.3% rate last March and the 2.5% level at the same time the prior year. All of the islands continue to suffer from slow economic growth due to the pandemic, but I remain hopeful that jobs will continue to return—assuming new infection rates do not go up again.
Maui, Hawaii Home Sales
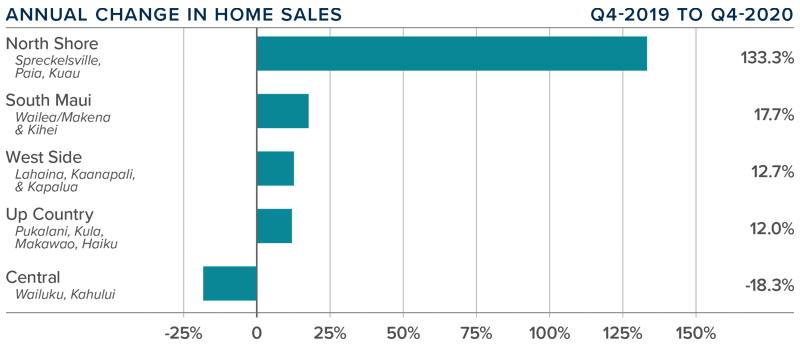
❱ In the fourth quarter of 2020, 615 homes changed hands, an increase of 7.5% compared to the same period the previous year, and 26.3% higher than in the third quarter of 2020.
❱ Sales rose in all markets other than the Central area, but the drop there was small in absolute numbers (26 fewer sales). The largest increase in home sales was in North Shore, but all markets other than the Central area saw double-digit increases compared to the final quarter of 2019.
❱ Listing activity rose 5.6% compared to the same quarter in 2019 but was 5.8% lower than in the third quarter. It is interesting that sales rose even with fewer listings, proving that demand is robust.
❱ Pending home sales were 9.8% higher than in the third quarter of 2020, suggesting that closings in the first quarter of 2021 will likely be positive.
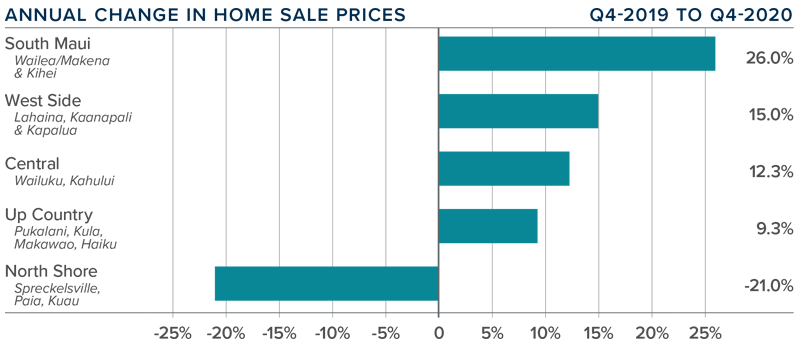
maui, hawaii Home Prices
❱ The average home price on Maui rose 21.3% year-over-year to $1.14 million and was 10.9% higher than in the third quarter of 2020.
❱ Affordability remains a significant issue, but prices continue to appreciate, suggesting that demand is still in place.
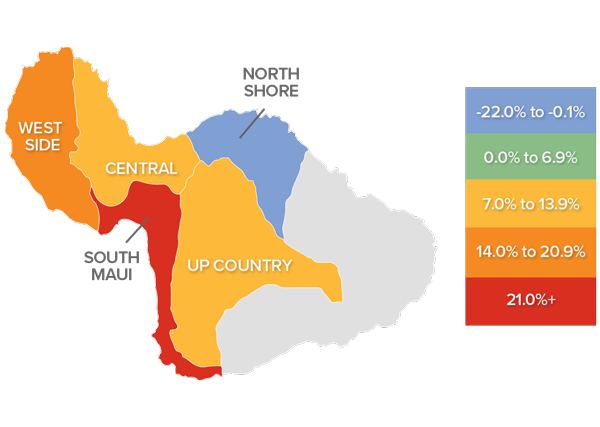
❱ The increase in average prices was driven by significant gains in South Maui, the Westside, and in the Central area. Up Country also saw decent growth. The very small North Shore market again saw prices drop but I am not particularly concerned given so few transactions occur there.
❱ I expect prices to continue rising, but I anticipate that growth will be modest given that mortgage rates are unlikely to drop much further.
Days on Market
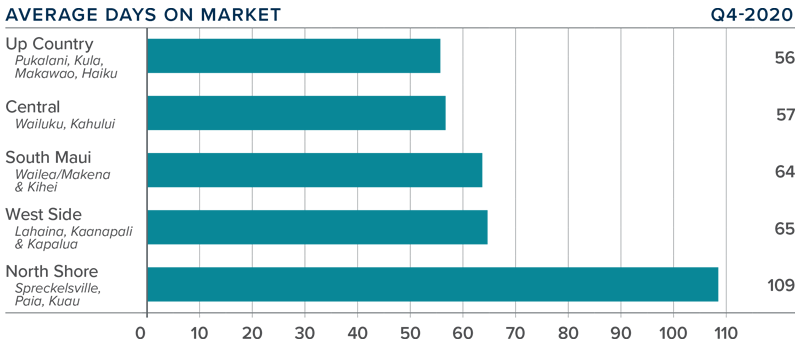
❱ The average number of days it took to sell a home on Maui rose 11 days from the final quarter of 2019.
❱ The amount of time it took to sell a home dropped on the Westside and Up Country but rose in all other areas.
❱ In fourth quarter, it took an average of 70 days to sell a home, with homes selling the fastest in Up Country and slowest in North Shore.
❱ Market time also rose 17 days compared to the third quarter of 2020, giving credence to my belief that affordability issues appear to be outweighing the limited number of homes for sale.
Conclusions
This speedometer reflects the state of the region’s real estate market using housing inventory, price gains, home sales, interest rates, and larger economic factors.
Price growth has been very significant, which, in concert with inventory limitations, should indicate a seller’s market. However, the increase in market time suggests this may not be the case. The pandemic and affordability are still influencing the direction of the housing market, which should favor buyers. Quite the conundrum!
Overall, I expect well-positioned and well-priced homes to continue to sell, but some of the heat appears to have come off the market. Accordingly, I am leaving the needle in the same position as last quarter’s report.
About Matthew Gardner
As Chief Economist for Windermere Real Estate, Matthew Gardner is responsible for analyzing and interpreting economic data and its impact on the real estate market on both a local and national level. Matthew has over 30 years of professional experience both in the U.S. and U.K.
In addition to his day-to-day responsibilities, Matthew sits on the Washington State Governors Council of Economic Advisors; chairs the Board of Trustees at the Washington Center for Real Estate Research at the University of Washington; and is an Advisory Board Member at the Runstad Center for Real Estate Studies at the University of Washington where he also lectures in real estate economics.
The following analysis of the Big Island real estate market is provided by Windermere Real Estate Chief Economist Matthew Gardner. We hope that this information may assist you with making better-informed real estate decisions. For further information about the housing market in your area, please don’t hesitate to contact your Windermere agent.
Regional Economic Overview
The impact of COVID-19 on the Big Island’s economy remains significant. That said, jobs started to return after the spike in new infections in September. The latest available employment data (November) showed that the labor market has recovered 14,650 of the jobs that were shed and that employment is now only 6,850 jobs lower than in February of 2020. The unemployment rate on the Island continues to improve but still stands at 9.8%. For perspective, the rate in November of 2019 was only 3.3%. All of the islands continue to suffer from slow economic growth, but I remain hopeful that jobs will continue to return—assuming new infection rates do not go up again.
big island of hawaii Home Sales
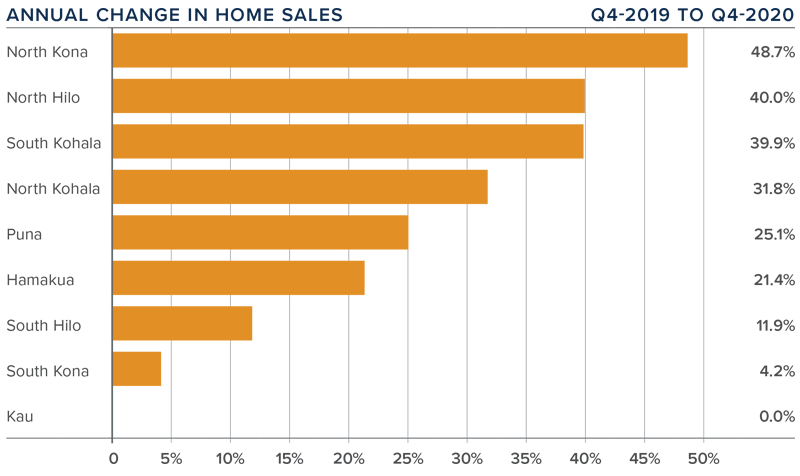
❱ In the fourth quarter of 2020, 1,083 homes sold on the Big Island. This was an increase of 30.5% compared to the final quarter of 2019 and a significant 21.7% higher than in the third quarter of 2020.
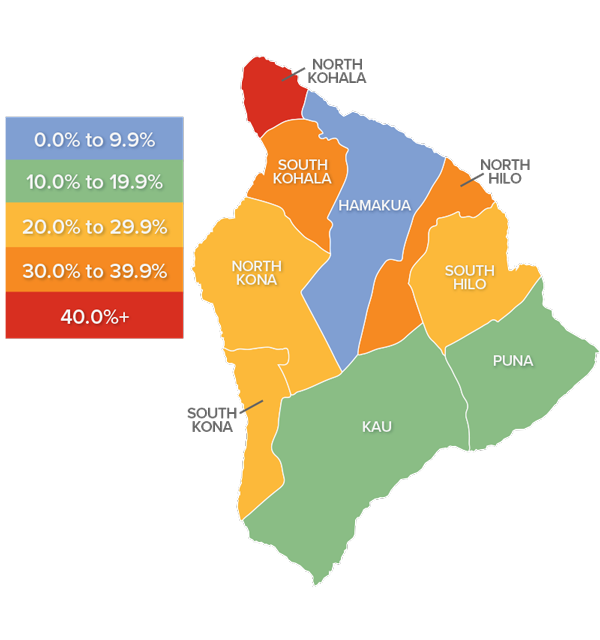
❱ Sales were static in Kau but higher in all other markets. North Kona and North Hilo saw significant increases in sales. All but two markets saw sales rise by double digits.
❱ The growth in sales came even though inventory levels were 33.5% lower year-over-year. The average number of homes for sale in the quarter was also down 14.4% from the third quarter of 2020.
❱ Pending home sales fell .9% compared to the third quarter of 2020, but this can most easily be attributed to a lack of supply of homes to buy—not a lack of demand.
big island of hawaii Home Prices
❱ The average home price on the Island rose an impressive 33.9% year-over-year to $775,902. Prices were also 23.2% higher than in the third quarter of 2020.
❱ Affordability continues to be an issue, but competitive mortgage rates and the desire for vacation homes kept demand from mainland buyers very robust.
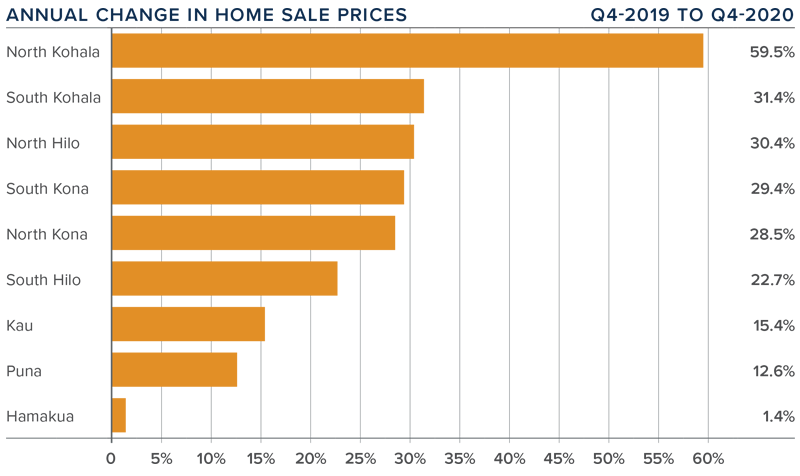
❱ The substantial increase in average sale prices was driven by significant price growth in North and South Kohala, but all markets except Hamakua saw double-digit price growth compared to a year ago.
❱ Given the events of 2020, the housing market has recovered very admirably.
Days on Market
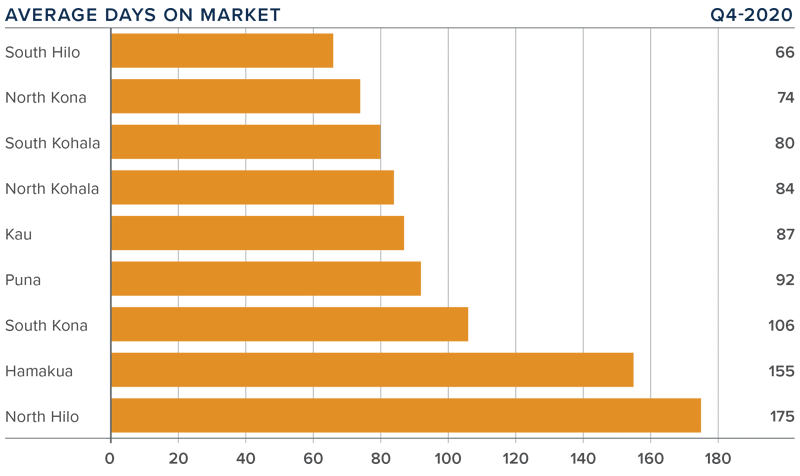
❱ The average time it took to sell a home on the Big Island dropped one day compared to the final quarter of 2019.
❱ The amount of time it took to sell a home dropped in North & South Kohala, North Kona, Kau, and South Hilo, but rose in the other four markets.
❱ It took an average of 102 days to sell a home in the fourth quarter, with the fastest sales occurring in South Hilo and the slowest in North Hilo.
❱ It took four fewer days to sell a home in the fourth quarter of 2020 than in the third.
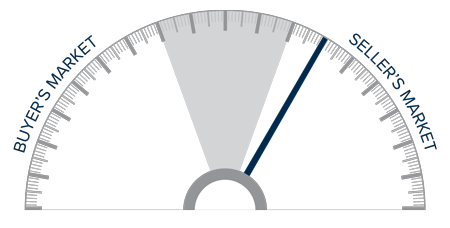
Conclusions
This speedometer reflects the state of the region’s real estate market using housing inventory, price gains, home sales, interest rates, and larger economic factors.
Even though the economy and job market are still suffering from the fallout of COVID-19, the housing market is recovering nicely.
Demand appears to be in place, but buyers who want to get into the market are still finding limited choices, which has allowed prices to continue to rise at very significant rates. Even though I anticipate mortgage rates will not drop much further, demand is likely to continue to be strong. Therefore, I am moving the needle back a bit more in favor of home sellers.
About Matthew Gardner
As Chief Economist for Windermere Real Estate, Matthew Gardner is responsible for analyzing and interpreting economic data and its impact on the real estate market on both a local and national level. Matthew has over 30 years of professional experience both in the U.S. and U.K.
In addition to his day-to-day responsibilities, Matthew sits on the Washington State Governors Council of Economic Advisors; chairs the Board of Trustees at the Washington Center for Real Estate Research at the University of Washington; and is an Advisory Board Member at the Runstad Center for Real Estate Studies at the University of Washington where he also lectures in real estate economics.
The following analysis of the greater Las Vegas real estate market is provided by Windermere Real Estate Chief Economist Matthew Gardner. We hope that this information may assist you with making better-informed real estate decisions. For further information about the housing market in your area, please don’t hesitate to contact your Windermere agent.
Regional Economic Overview
COVID-19 led to the loss of almost 247,000 jobs in the Las Vegas market—a very significant number. I am happy to report that more than 114,000 of them have now returned. The Leisure & Hospitality sector, unsurprisingly, was significantly impacted, but we are seeing continued improvement here: more than 75,000 of the 136,000 jobs that were lost have returned. With the job recovery continuing at a decent pace, the unemployment rate, which peaked at a remarkable 34% in April, continues to improve. The November rate was 11.5%. The market still has a way to go to get back to where it was pre-COVID, but the improvement is palpable. While the job recovery remains in place, COVID-19 infection rates are still elevated, even if they have pulled back from the new peak seen in December. I remain hopeful that new infection rates will continue to drop and, if I am correct, more jobs will be recovered. But I don’t expect to see a faster recovery until a vaccine becomes readily available.
nevada Home Sales
❱ A total of 10,008 homes sold in the fourth quarter of 2020, an increase of 22.7% compared to the same period a year ago, and 5.2% higher than in the third quarter of 2020.
❱ Pending sales dropped 8.7% from the third quarter, suggesting that closings in the first quarter of 2021 may be lower than I would like to see. That said, pending sales were 27.4% higher year-over-year.
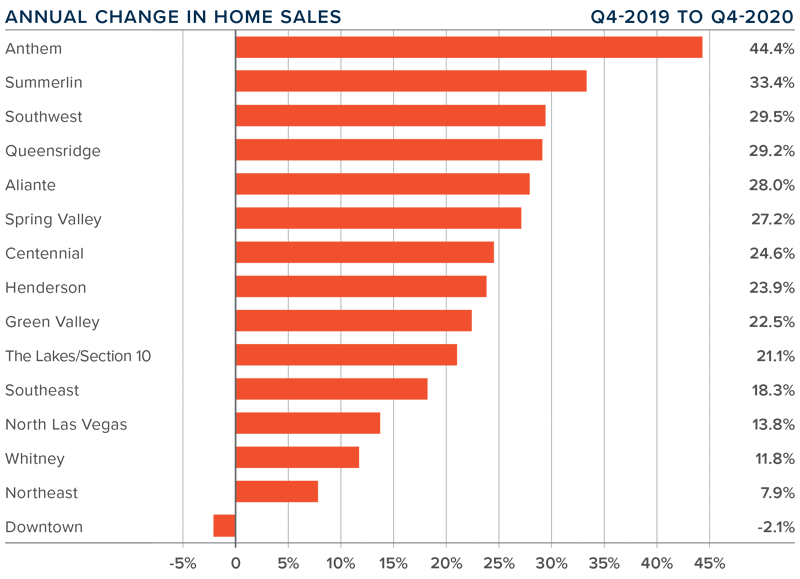
❱ Sales rose in every market other than Downtown, which saw a very modest drop. The Anthem area once again had significant growth. It is also worth noting that all but two markets saw double-digit growth in sales.
❱ Listing activity was down 16.9% compared to the third quarter, and 34.2% lower than the fourth quarter of 2019. I still expect listings will remain relatively muted until a vaccine is readily available and the Las Vegas economy gets back to as close to normal as possible.
nevada Home Prices
❱ With sales rising and inventory levels still very low, it was not surprising home prices continued to rise at well-above-average rates. The average sale price in the fourth quarter rose 17.6% year-over-year to $383,477. Prices were up 5.4% compared to the third quarter of 2020.
❱ Annual home-price growth continues at well-above-average levels, but as mortgage rates start to creep higher, I expect some modest slowing in the pace of growth. But not yet!
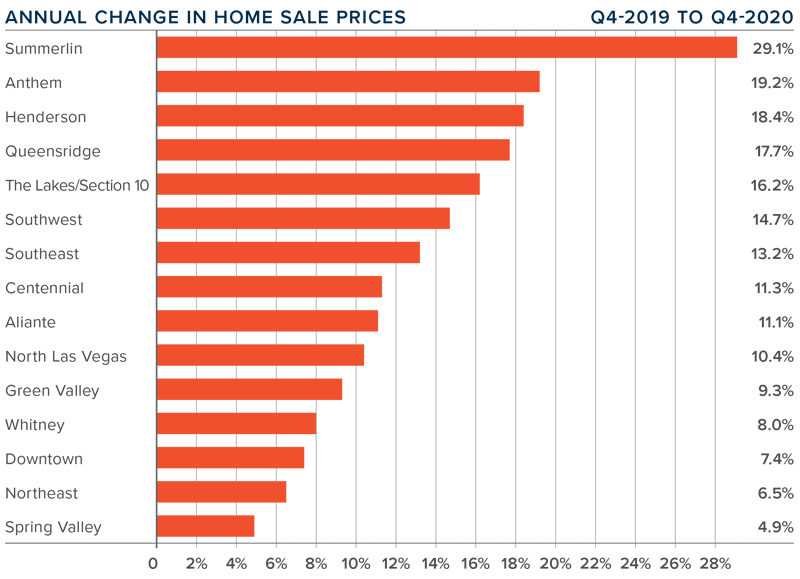
❱ Prices rose in every sub-market compared to the same quarter last year, with significant gains in Summerlin. An additional nine neighborhoods saw double-digit price growth.
❱ Buyer demand remains robust, which continues to benefit home sellers.
Days on Market
❱ The average time it took to sell a home in the region dropped nine days compared to the fourth quarter of 2019.
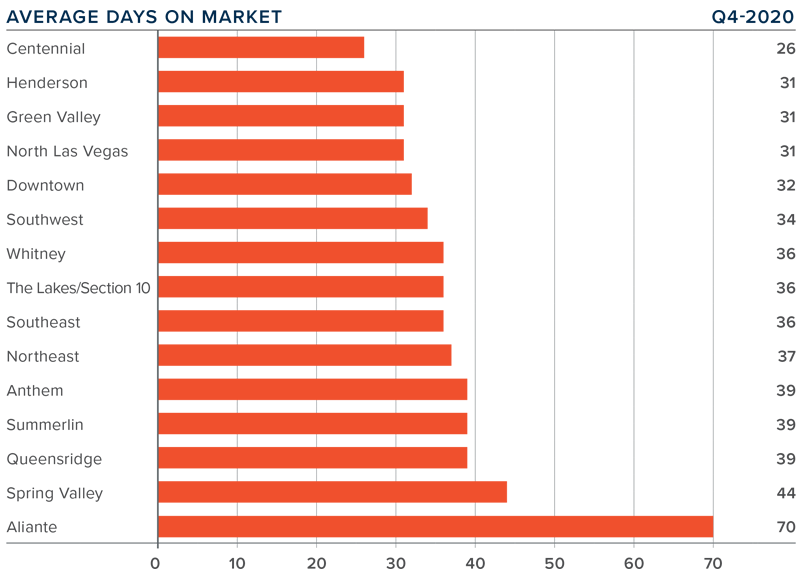
❱ Regionally, it took an average of 37 days to sell a home in the final quarter of 2020, which is 5 fewer days than in the third quarter.
❱ Days on market dropped or remained static in all the neighborhoods contained in this report compared to a year ago.
❱ The greatest decline in market time was again in The Lakes/Section 10, where the length of time it took to sell a home dropped 16 days.
Conclusions
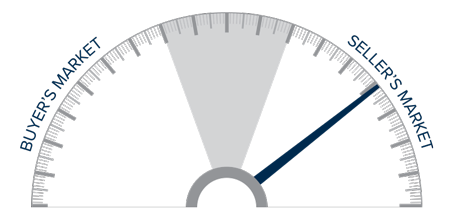
This speedometer reflects the state of the region’s real estate market using housing inventory, price gains, home sales, interest rates, and larger economic factors.
The market continues to recover from the impact of COVID-19. Demand is in place and buyers remain very active. Even modestly rising mortgage rates likely won’t be a deterrent to home buyers. Although frustrated by the lack of homes for sale, they are still looking, which benefits home sellers. As such, I am moving the needle a little more in their favor.
About Matthew Gardner
As Chief Economist for Windermere Real Estate, Matthew Gardner is responsible for analyzing and interpreting economic data and its impact on the real estate market on both a local and national level. Matthew has over 30 years of professional experience both in the U.S. and U.K.
In addition to his day-to-day responsibilities, Matthew sits on the Washington State Governors Council of Economic Advisors; chairs the Board of Trustees at the Washington Center for Real Estate Research at the University of Washington; and is an Advisory Board Member at the Runstad Center for Real Estate Studies at the University of Washington where he also lectures in real estate economics.

 Facebook
 X
X
 Pinterest
 Copy Link


")


