
 Facebook
 Twitter
 Pinterest
 Copy Link

The following analysis of select counties of the Montana real estate market is provided by Windermere Real Estate. We hope that this information may assist you with making better-informed real estate decisions. For further information about the housing market in your area, please don’t hesitate to contact your Windermere Real Estate agent.
Regional Economic Overview
The pace of job growth in Montana continues to taper. The state added only 6,000 jobs, which represents an annual growth rate of 1.2%. This is the slowest pace of growth in the state since pandemic influences started to come into play.
Regional variations continued: the Billings metro area lost 600 jobs, Great Falls employment was flat, and the Missoula metro area saw employment rise 1,100 jobs.
The state unemployment rate in August was 2.5%, which was down from 2.7% in the same period of 2022. All metro areas in this report showed unemployment rates of 2.5%.
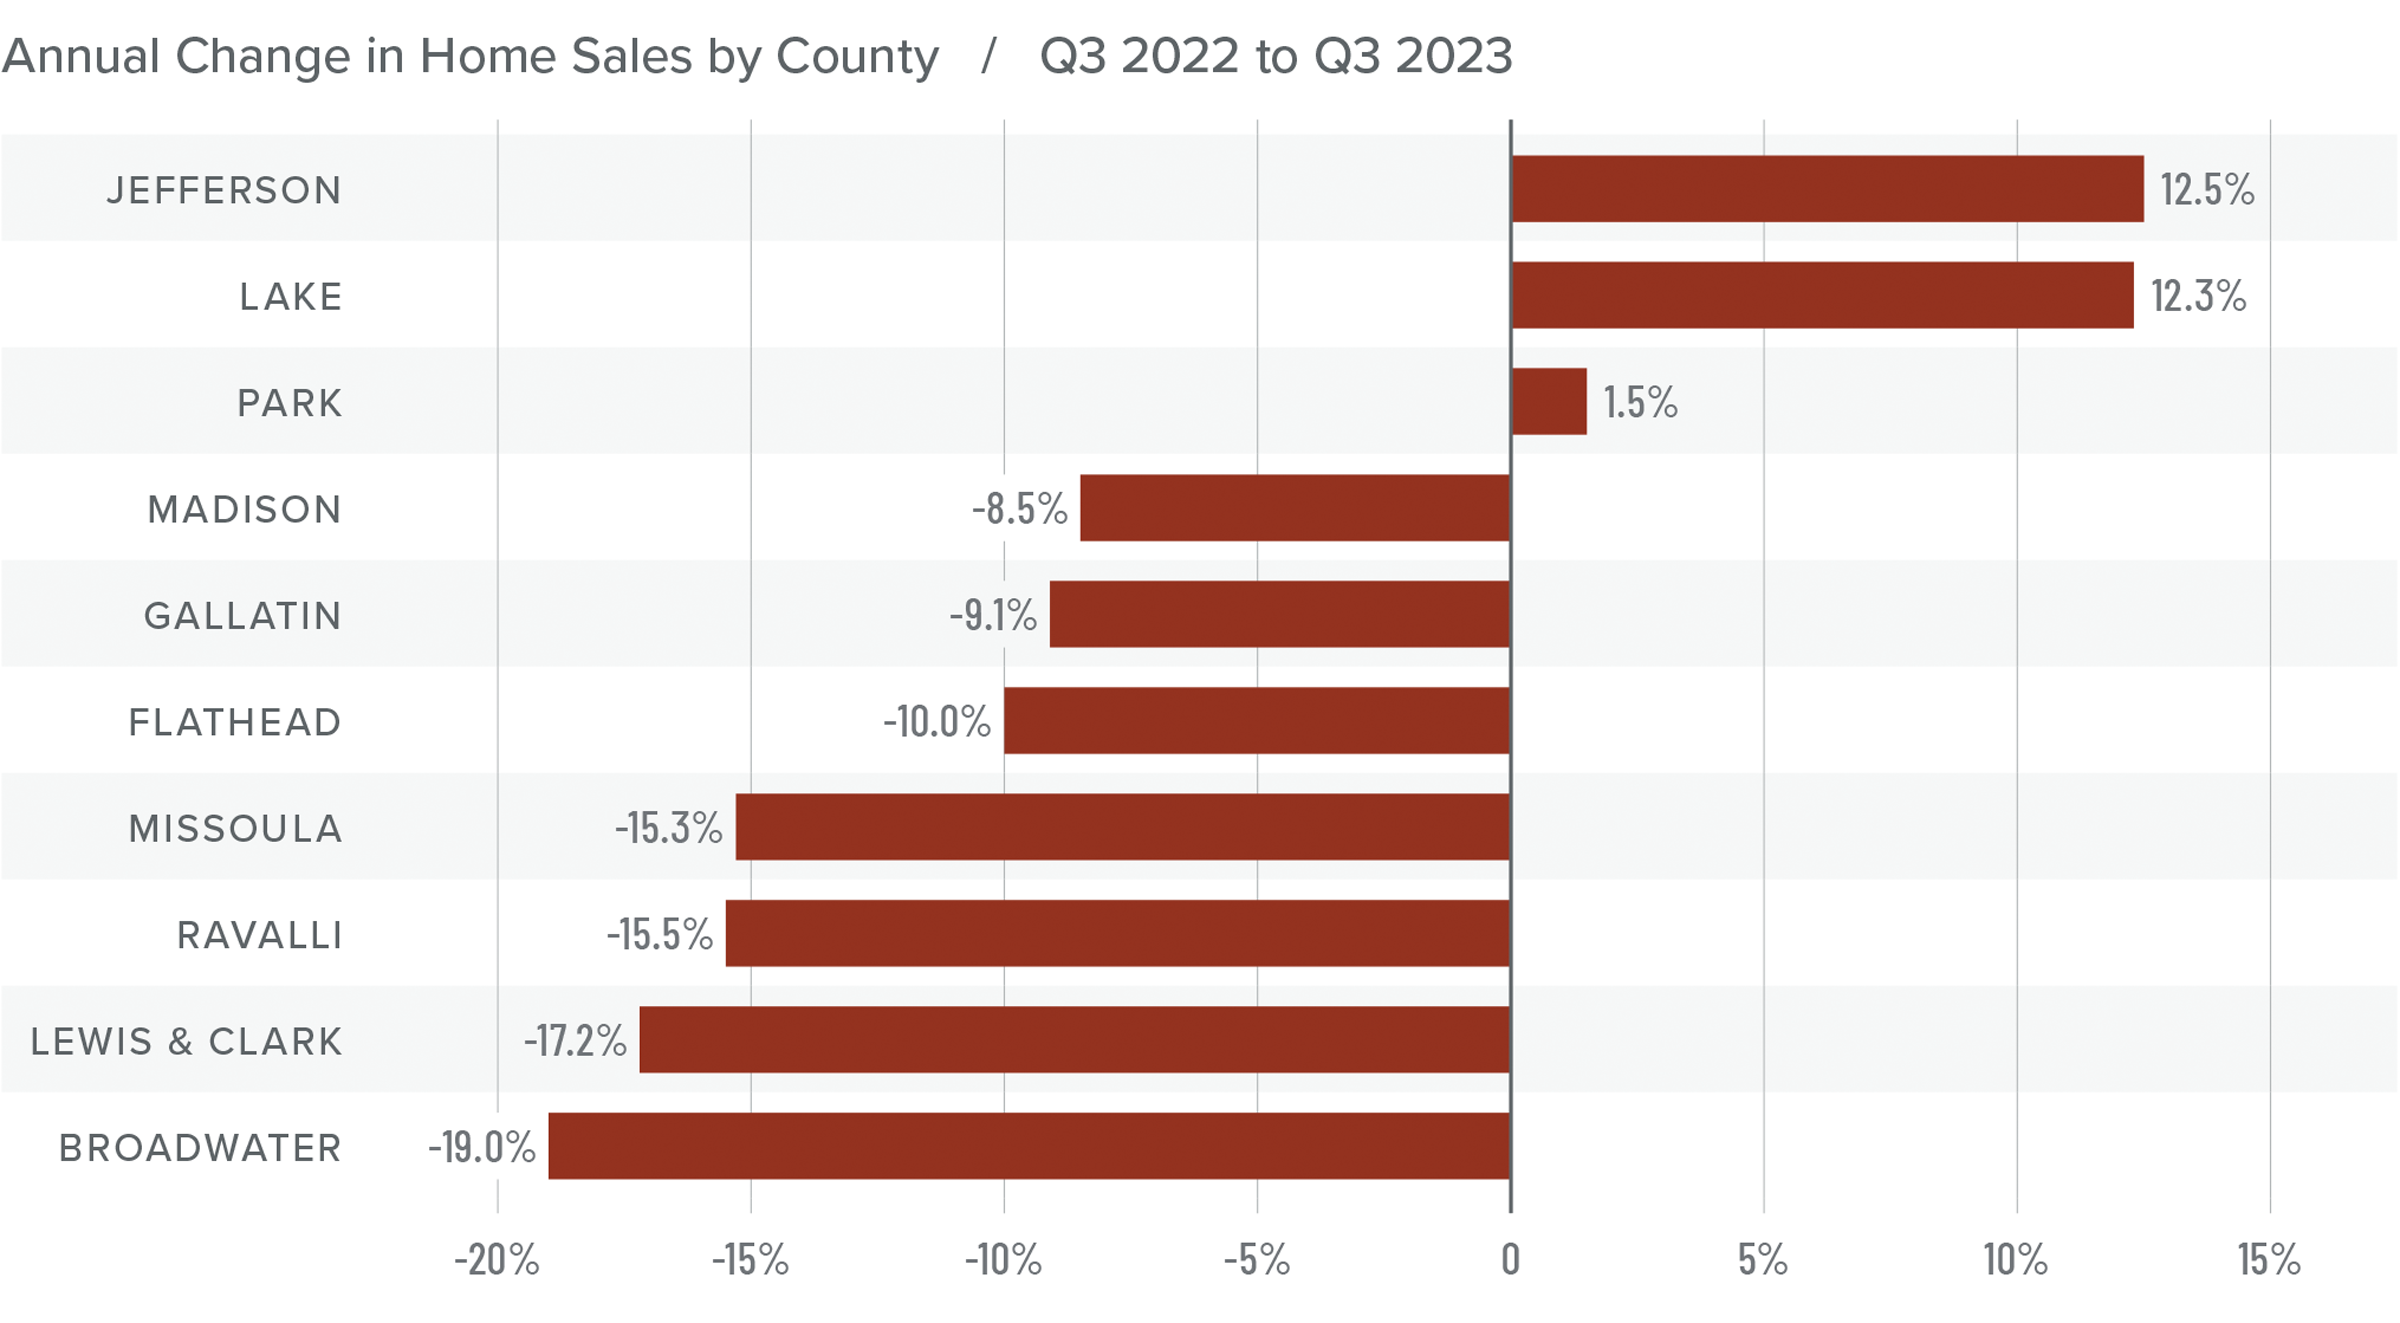
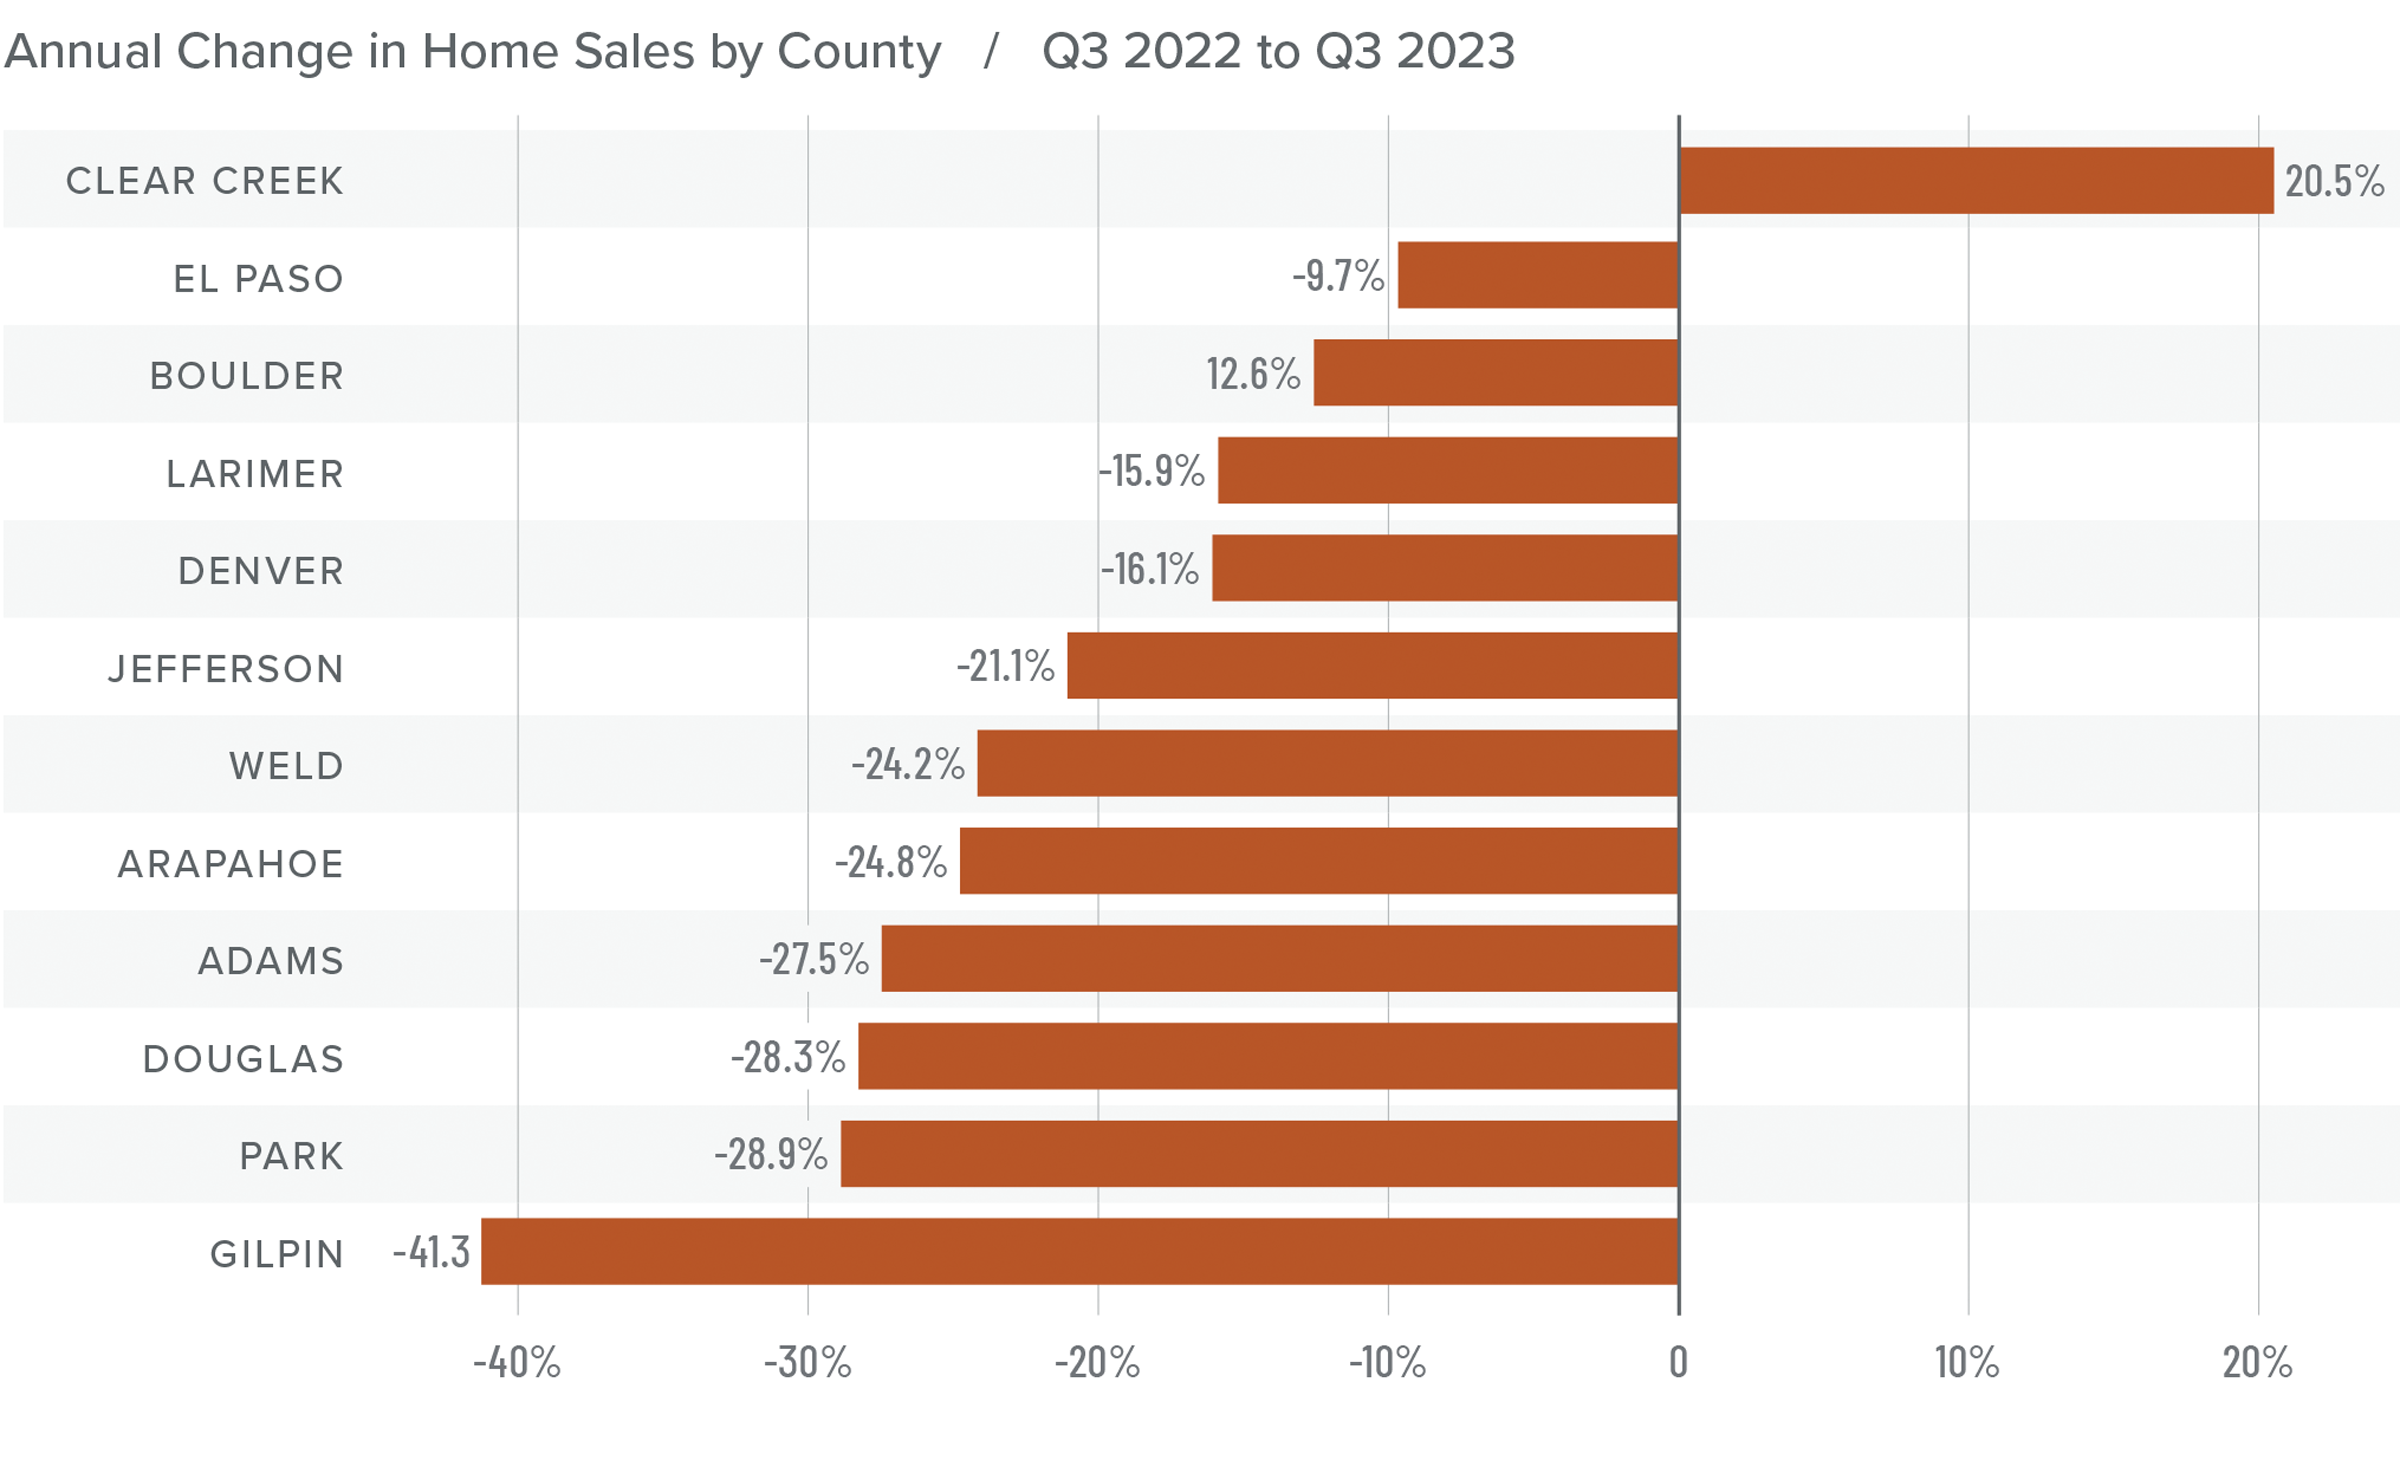
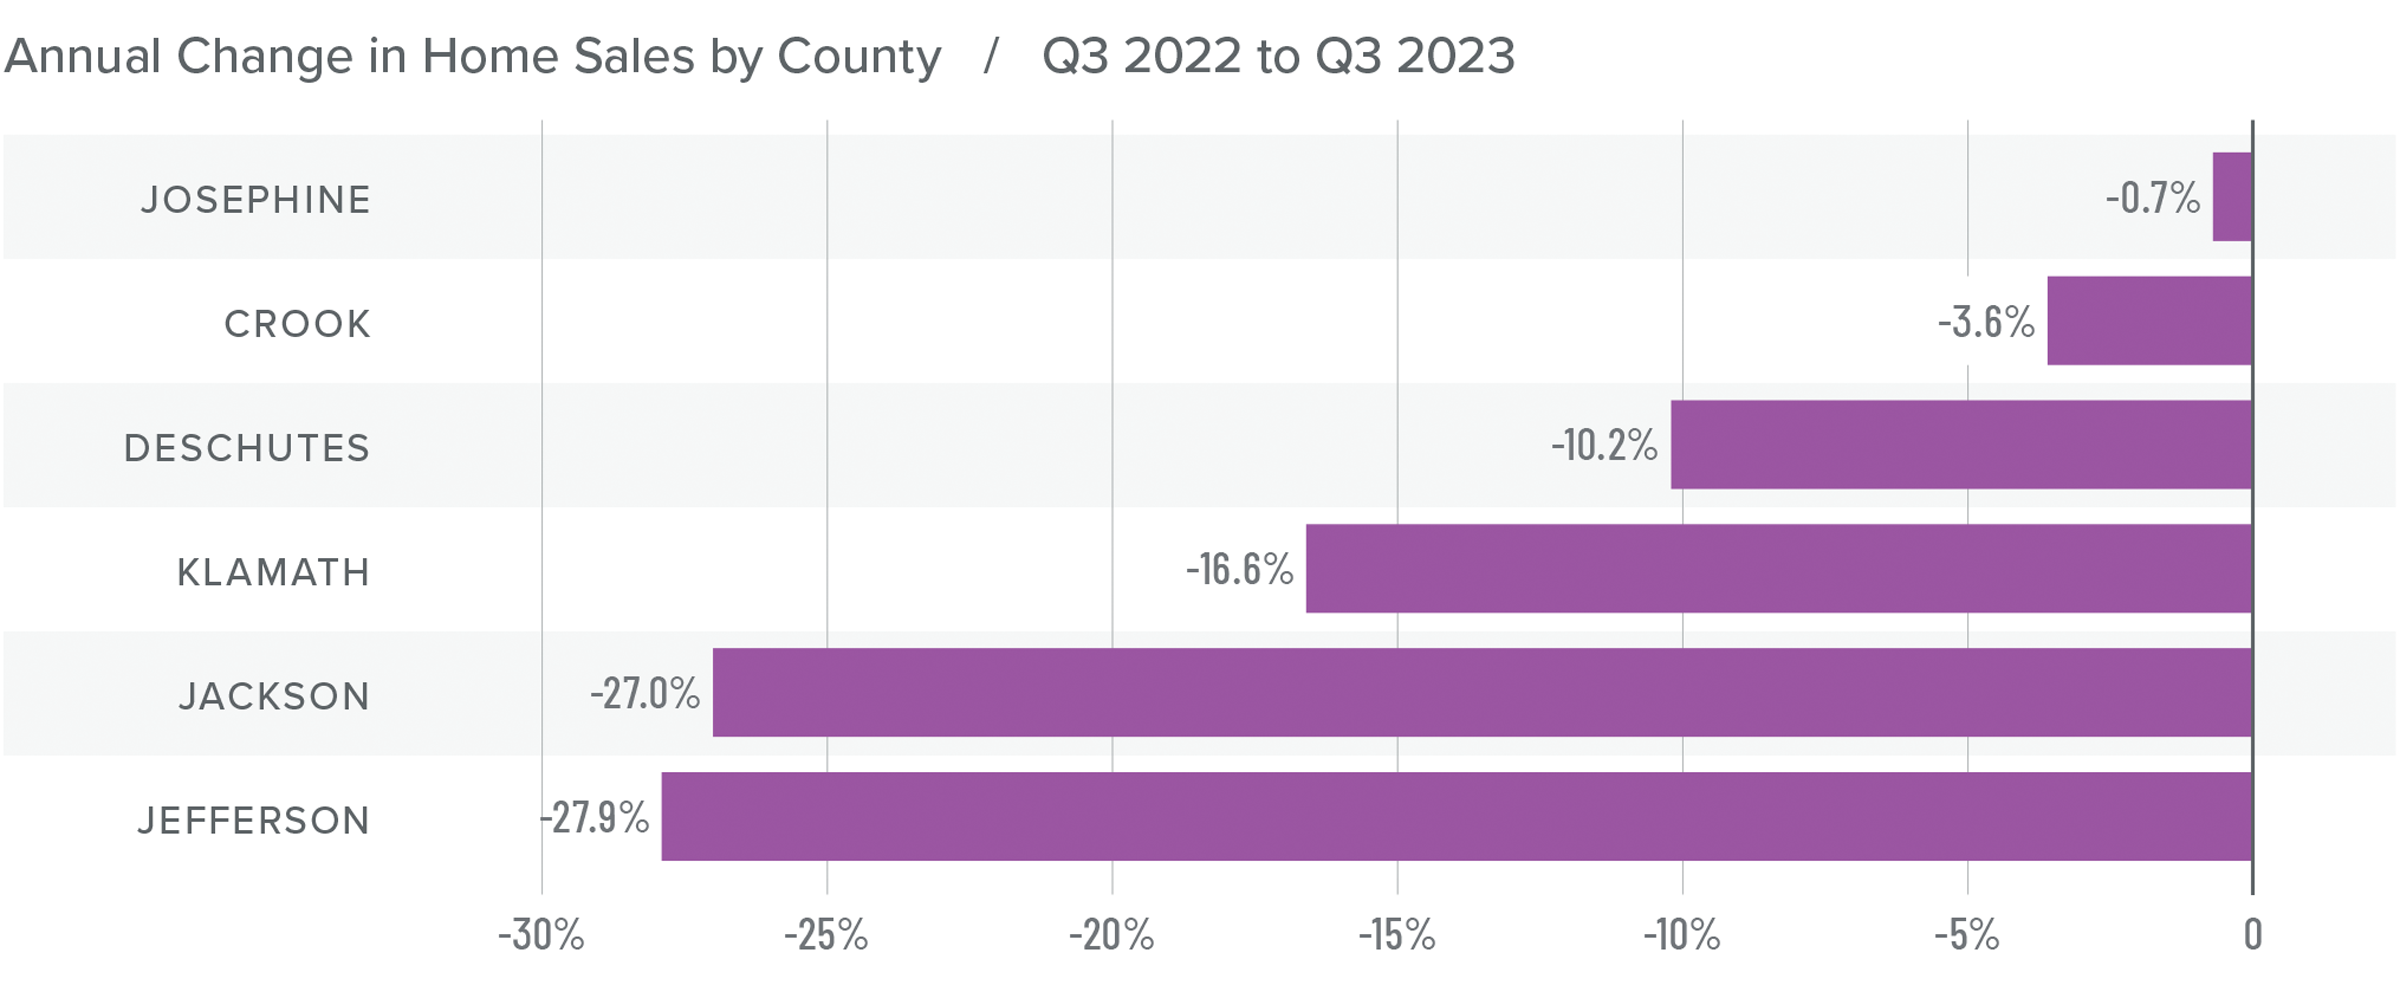
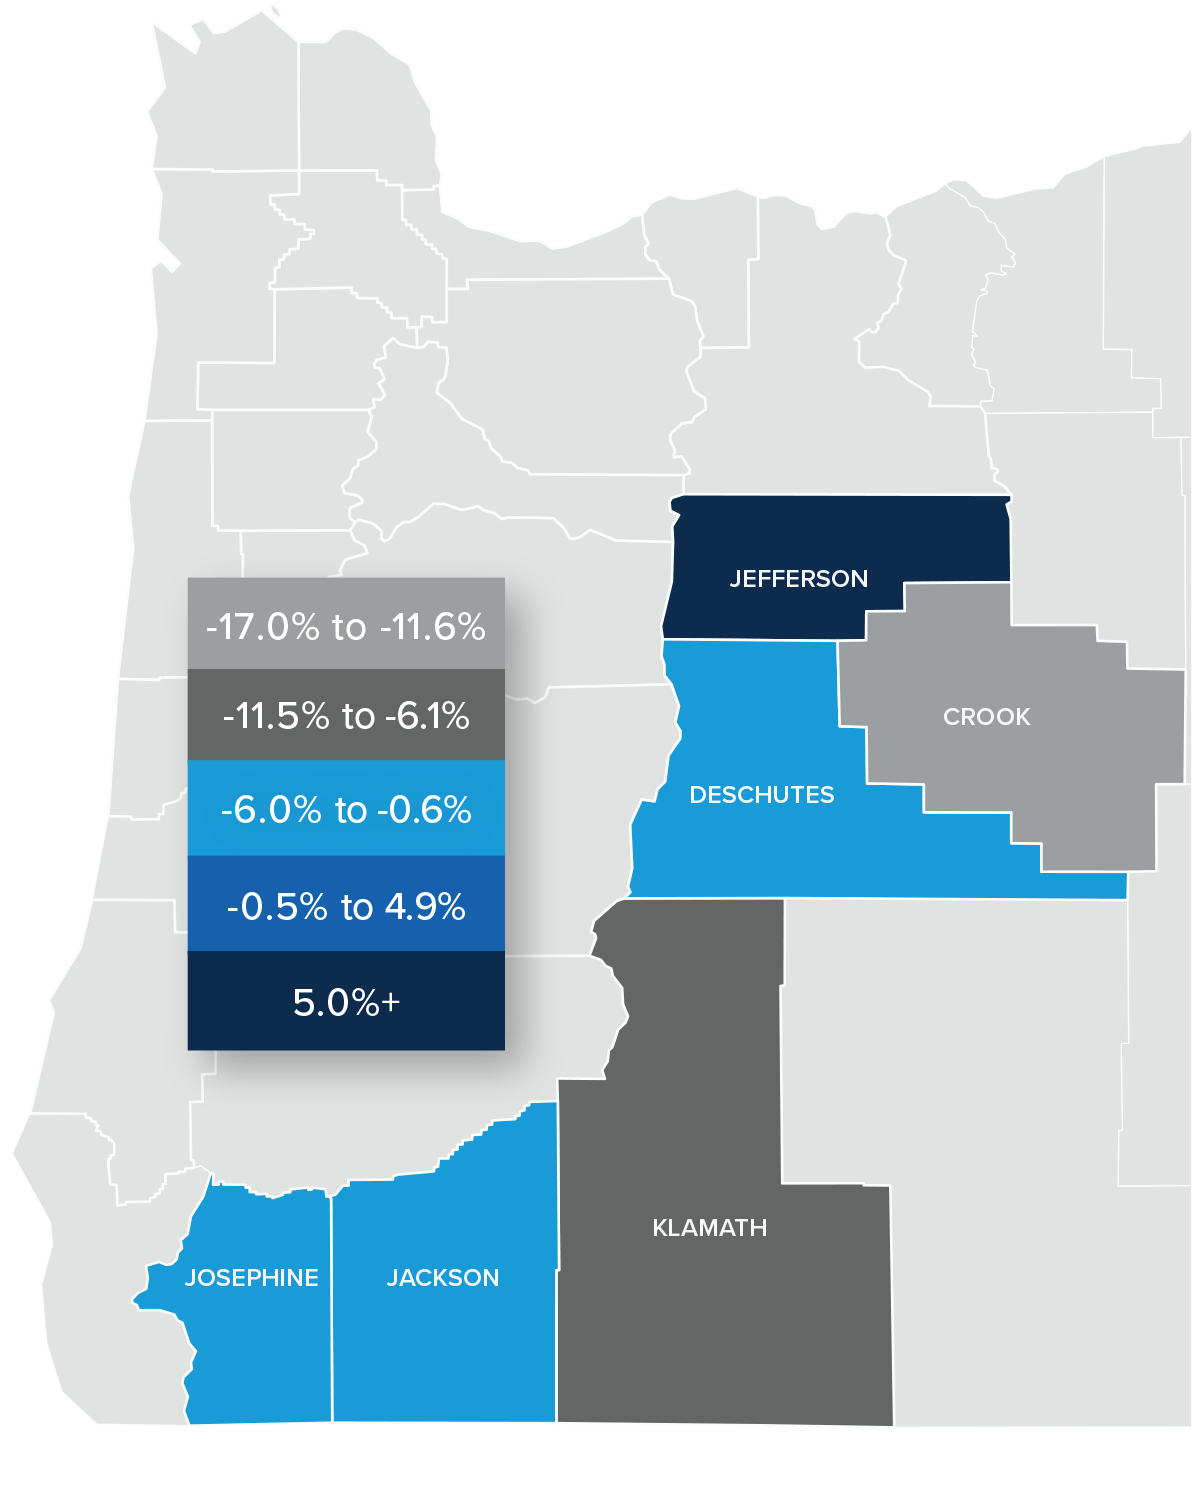
Montana Home Sales
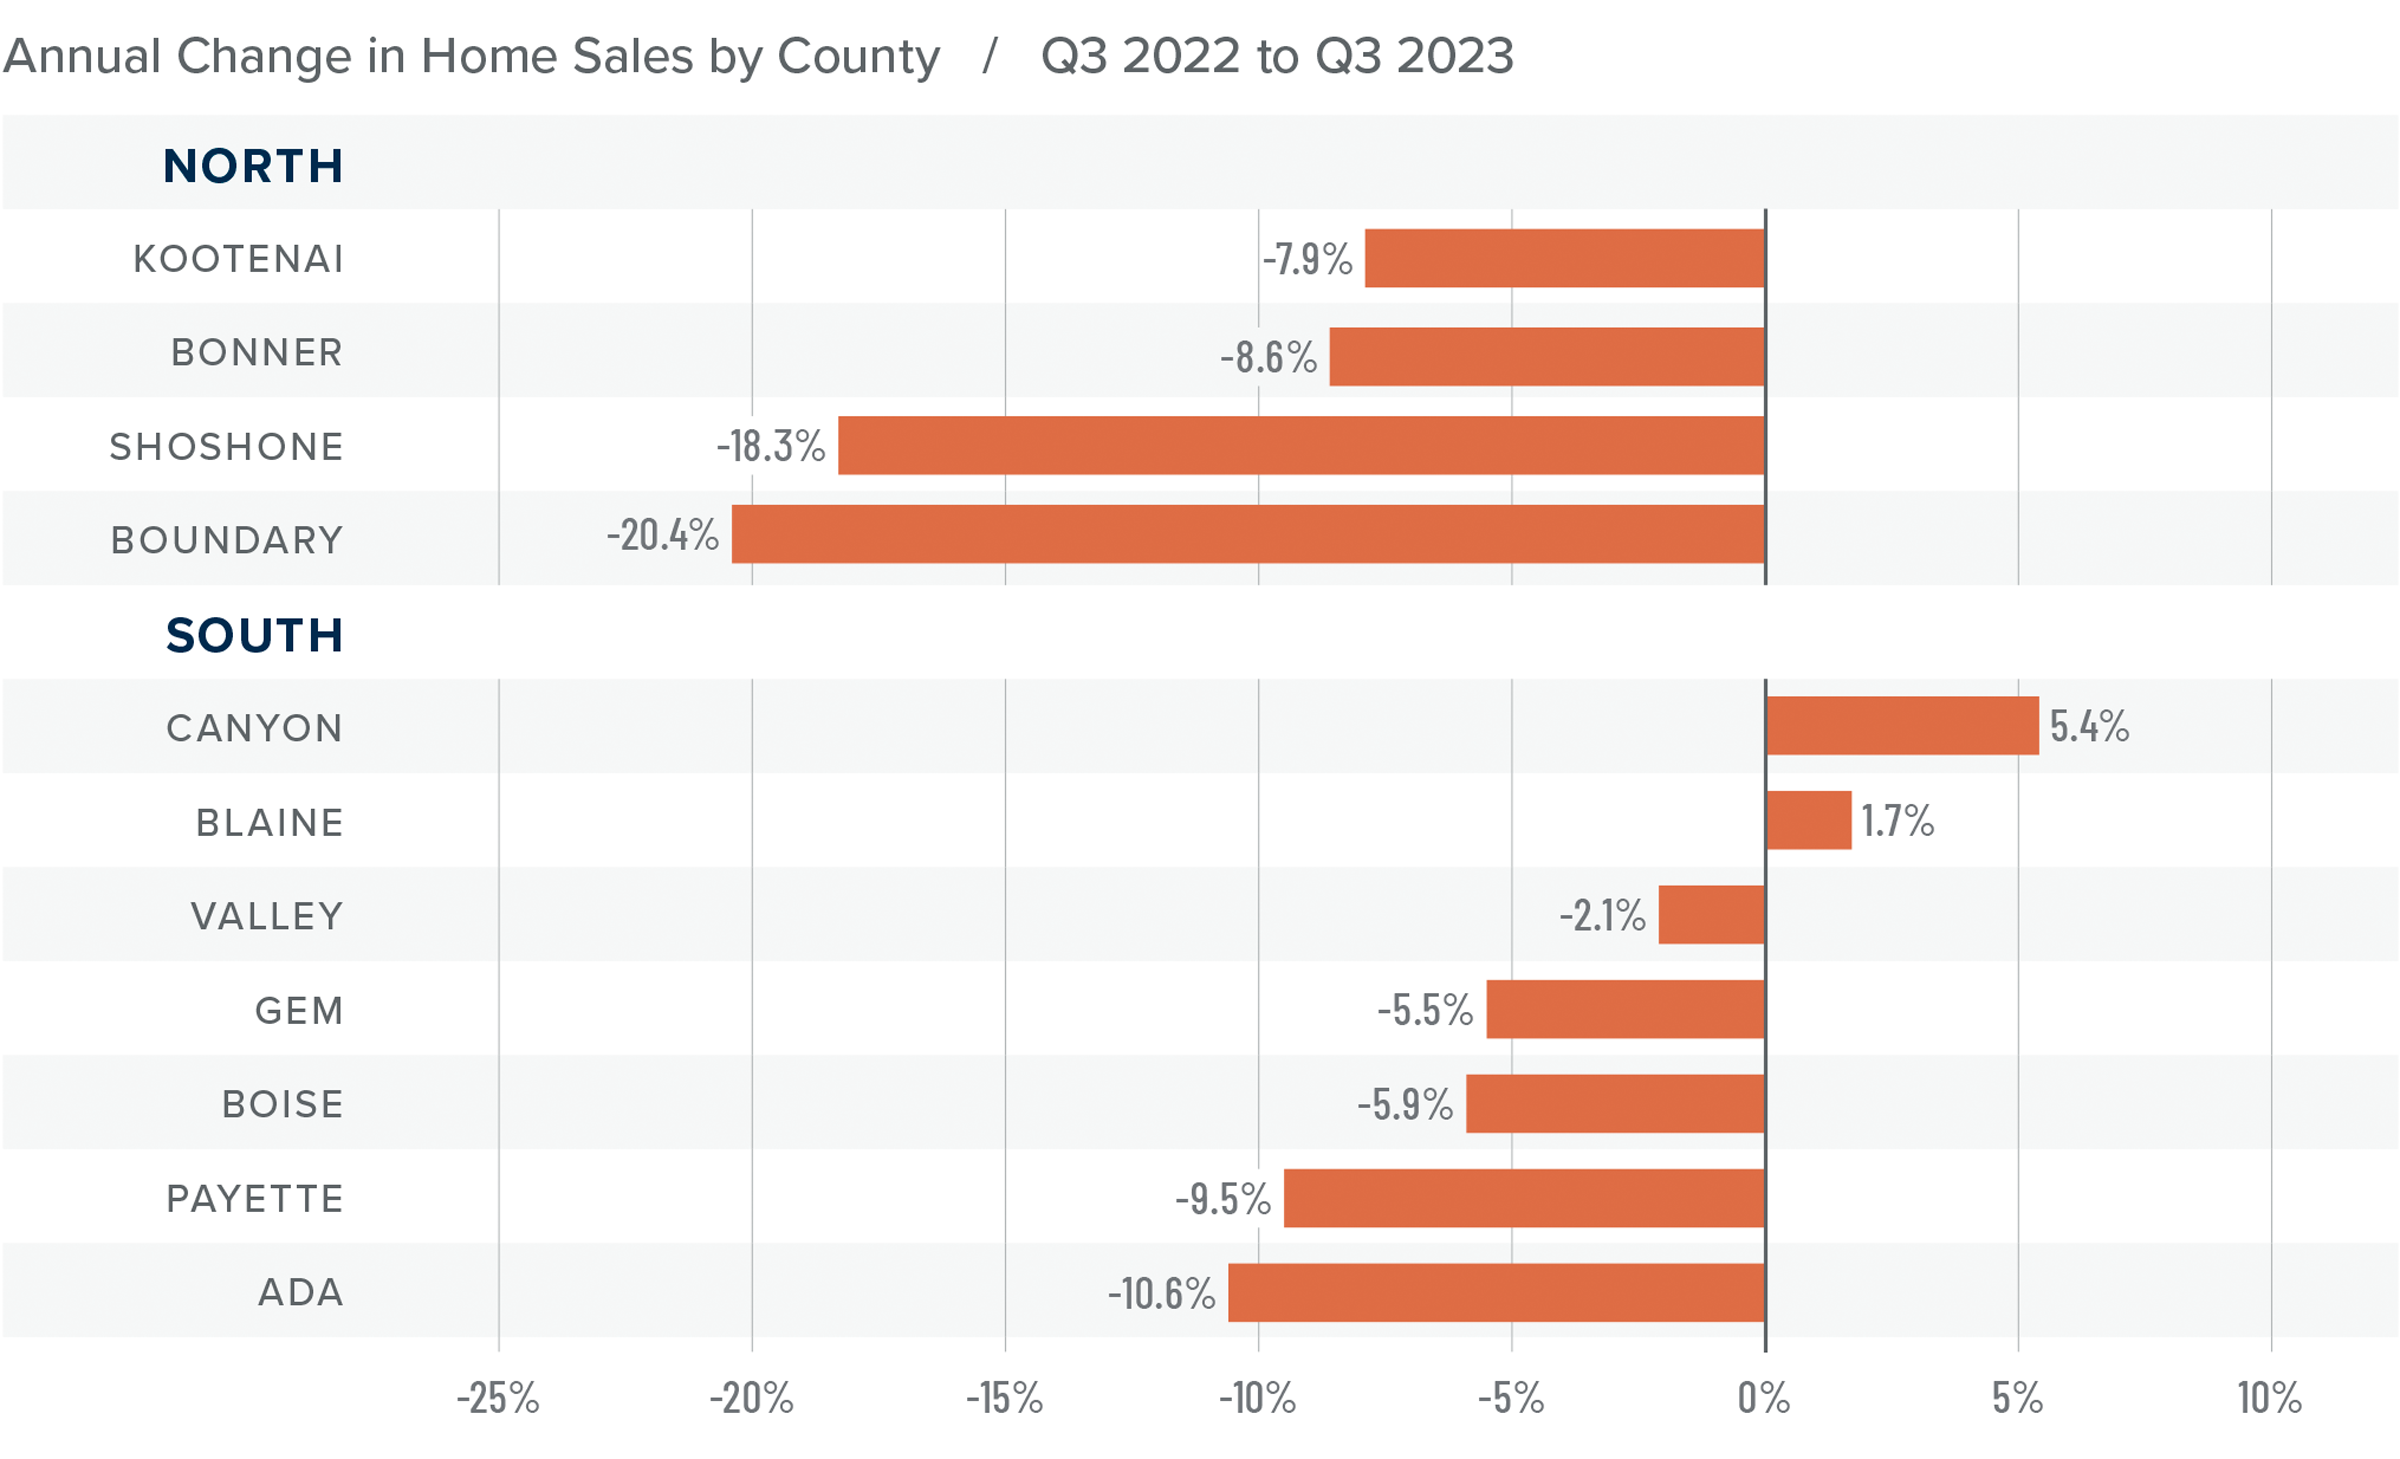
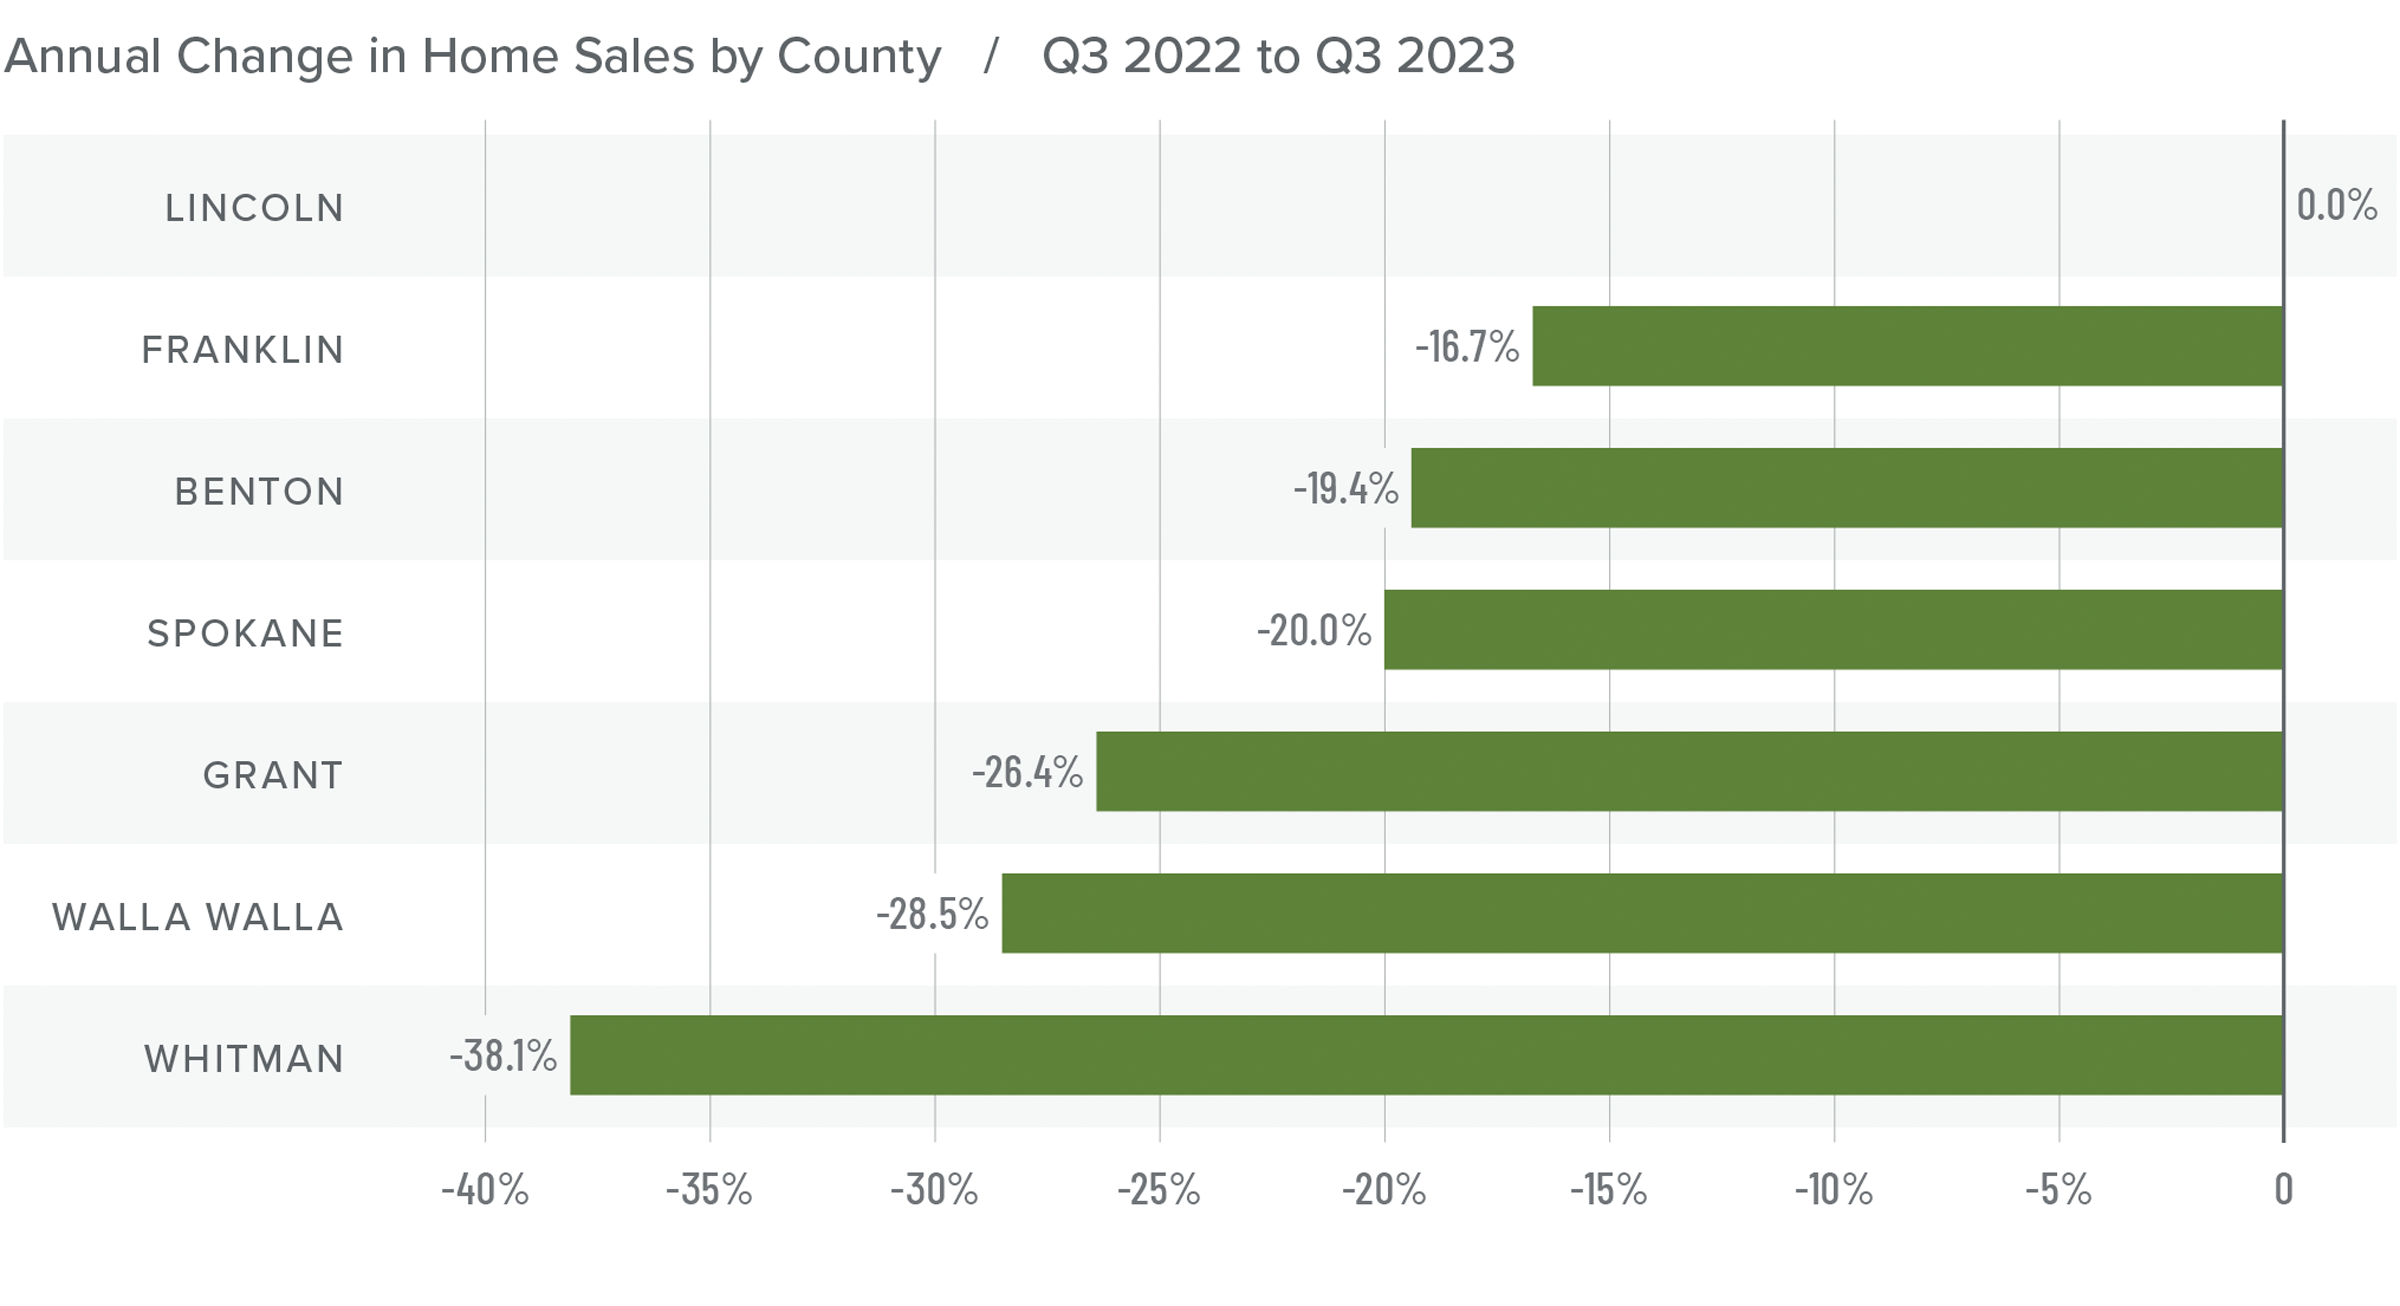
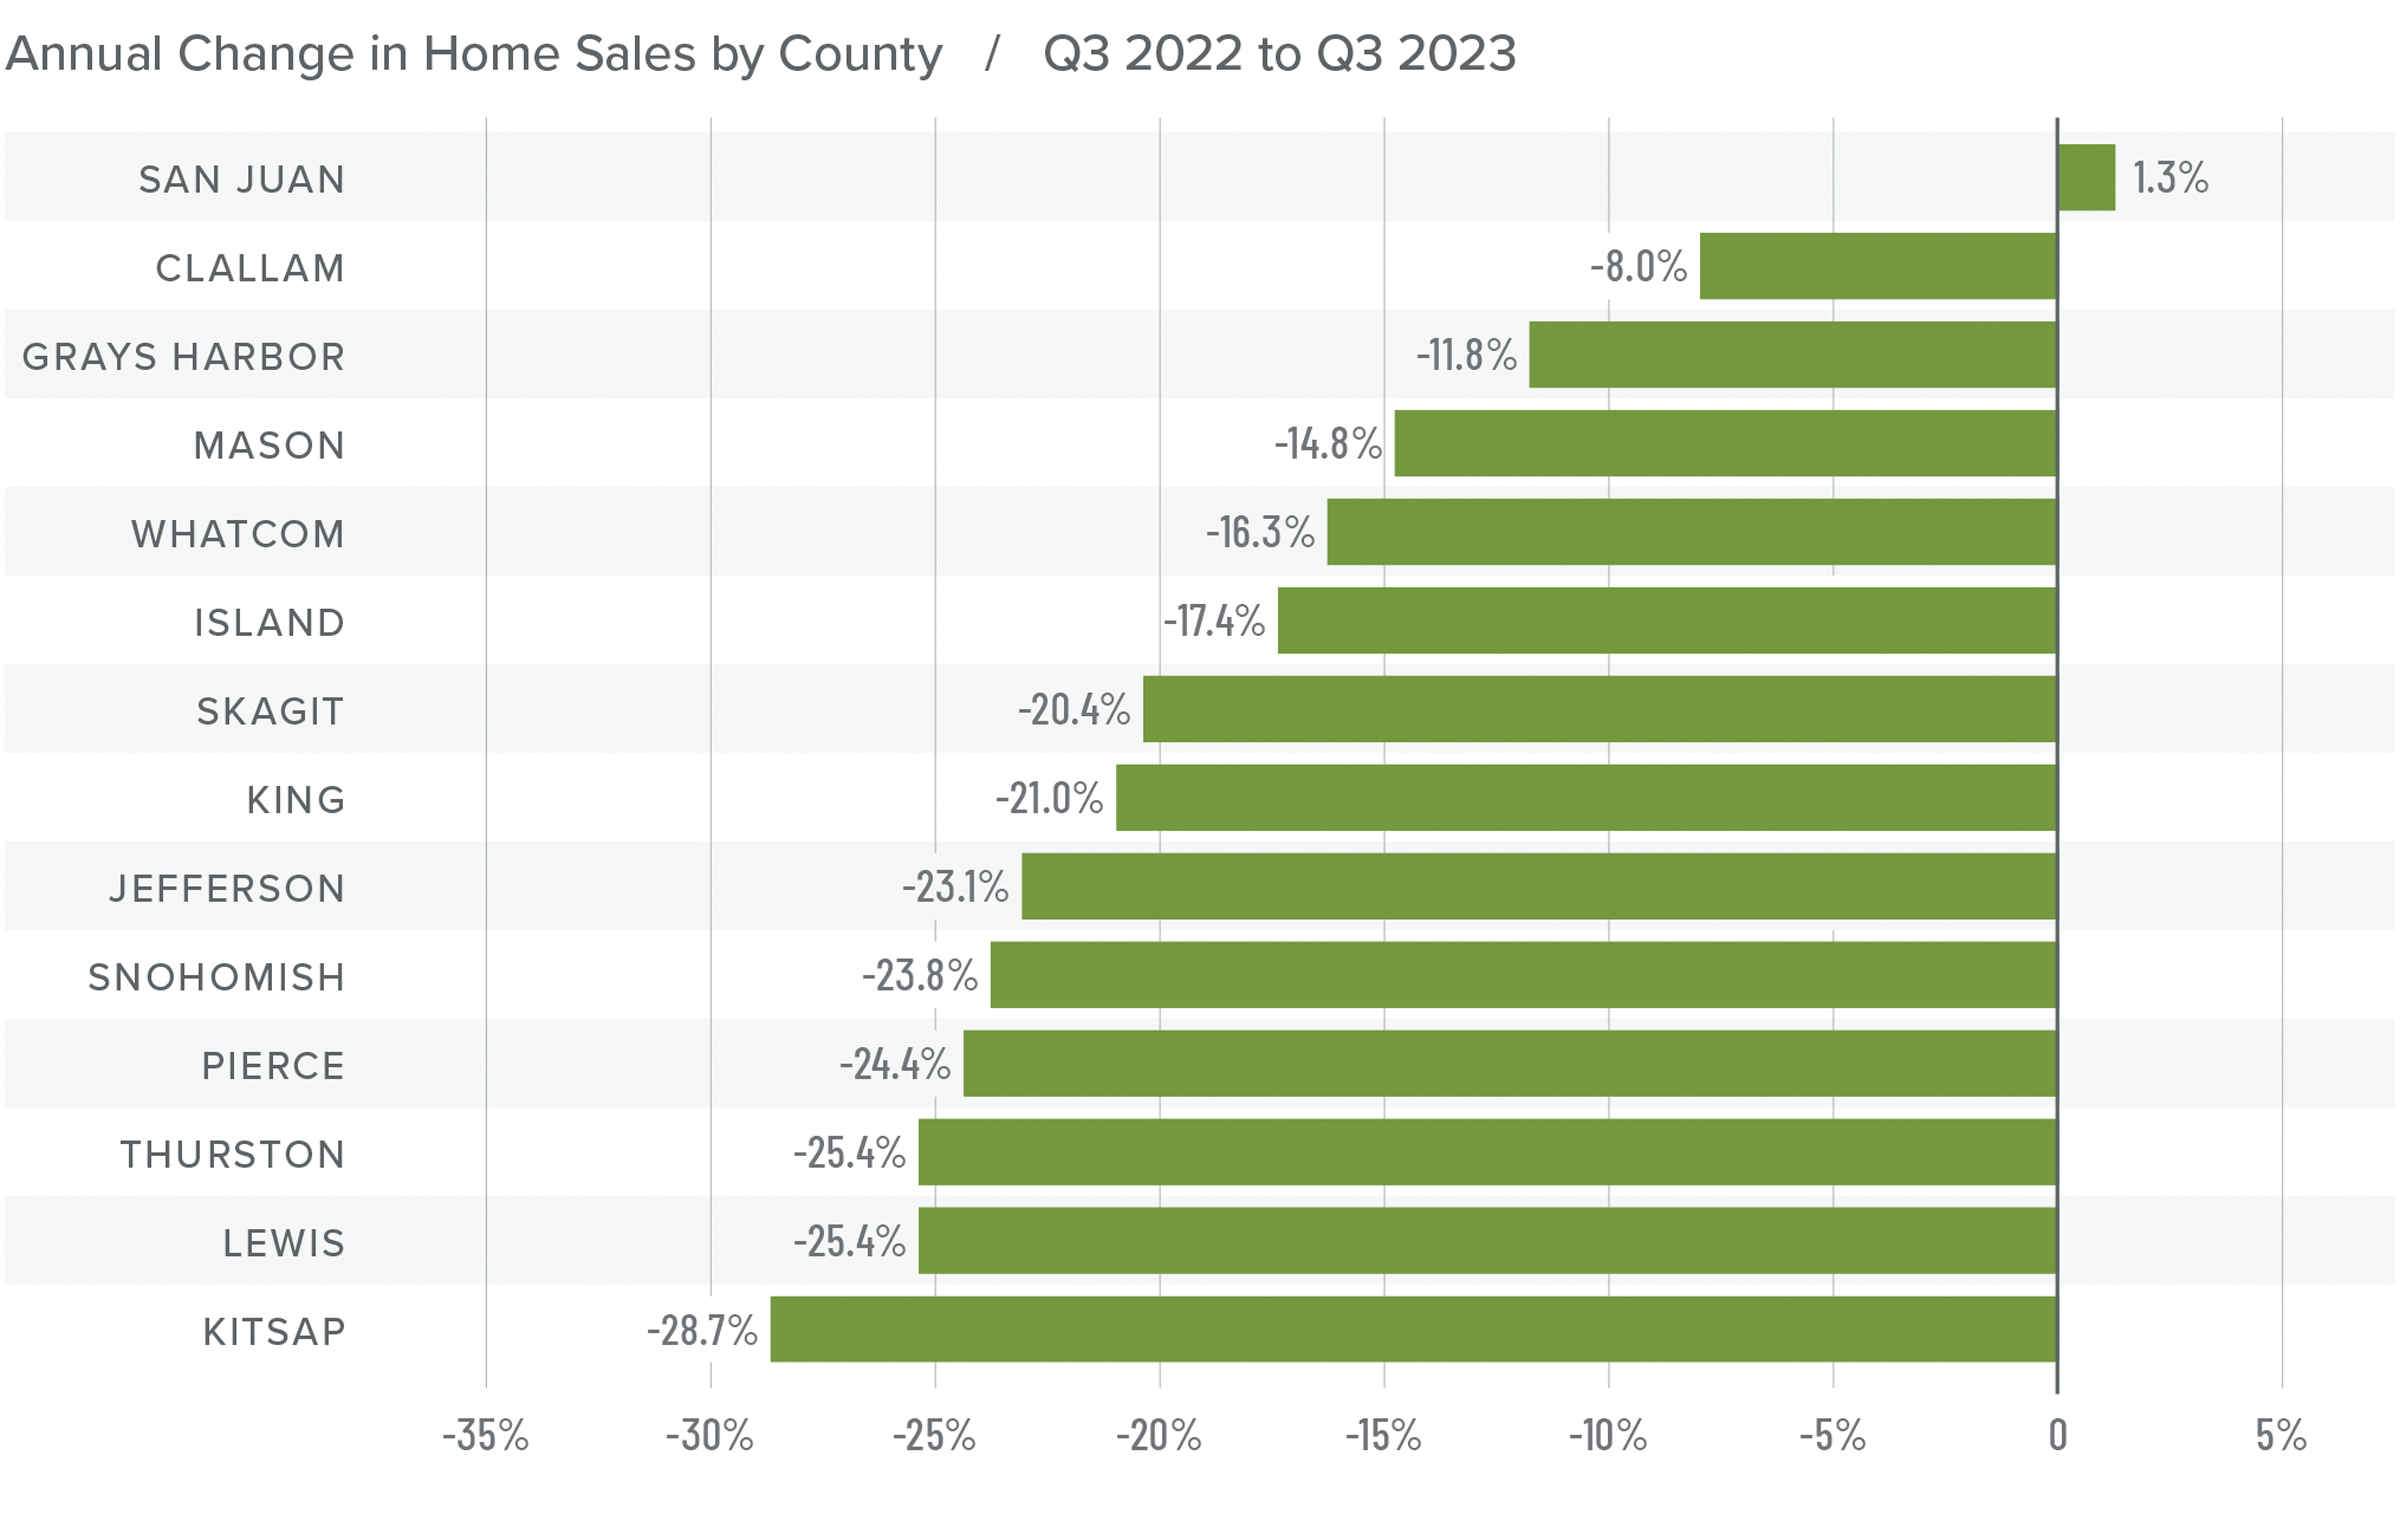
❱ In the third quarter of 2023, 1,959 homes sold in the counties covered by this report. This was a 10.8% decline from the third quarter of 2022 but 7% higher than in the second quarter of 2023.
❱ Listing activity was 9.6% higher than during the same period of 2022 and 30.2% higher than in the second quarter of this year.
❱ Year over year, sales fell in all but three markets. Compared to the second quarter of this year, sales were up in every county other than Broadwater and Ravalli, where sales were down 37% and 7.4%, respectively.
❱ Pending sales fell 24.2% quarter over quarter, suggesting that closings in the final quarter of the year may be down.
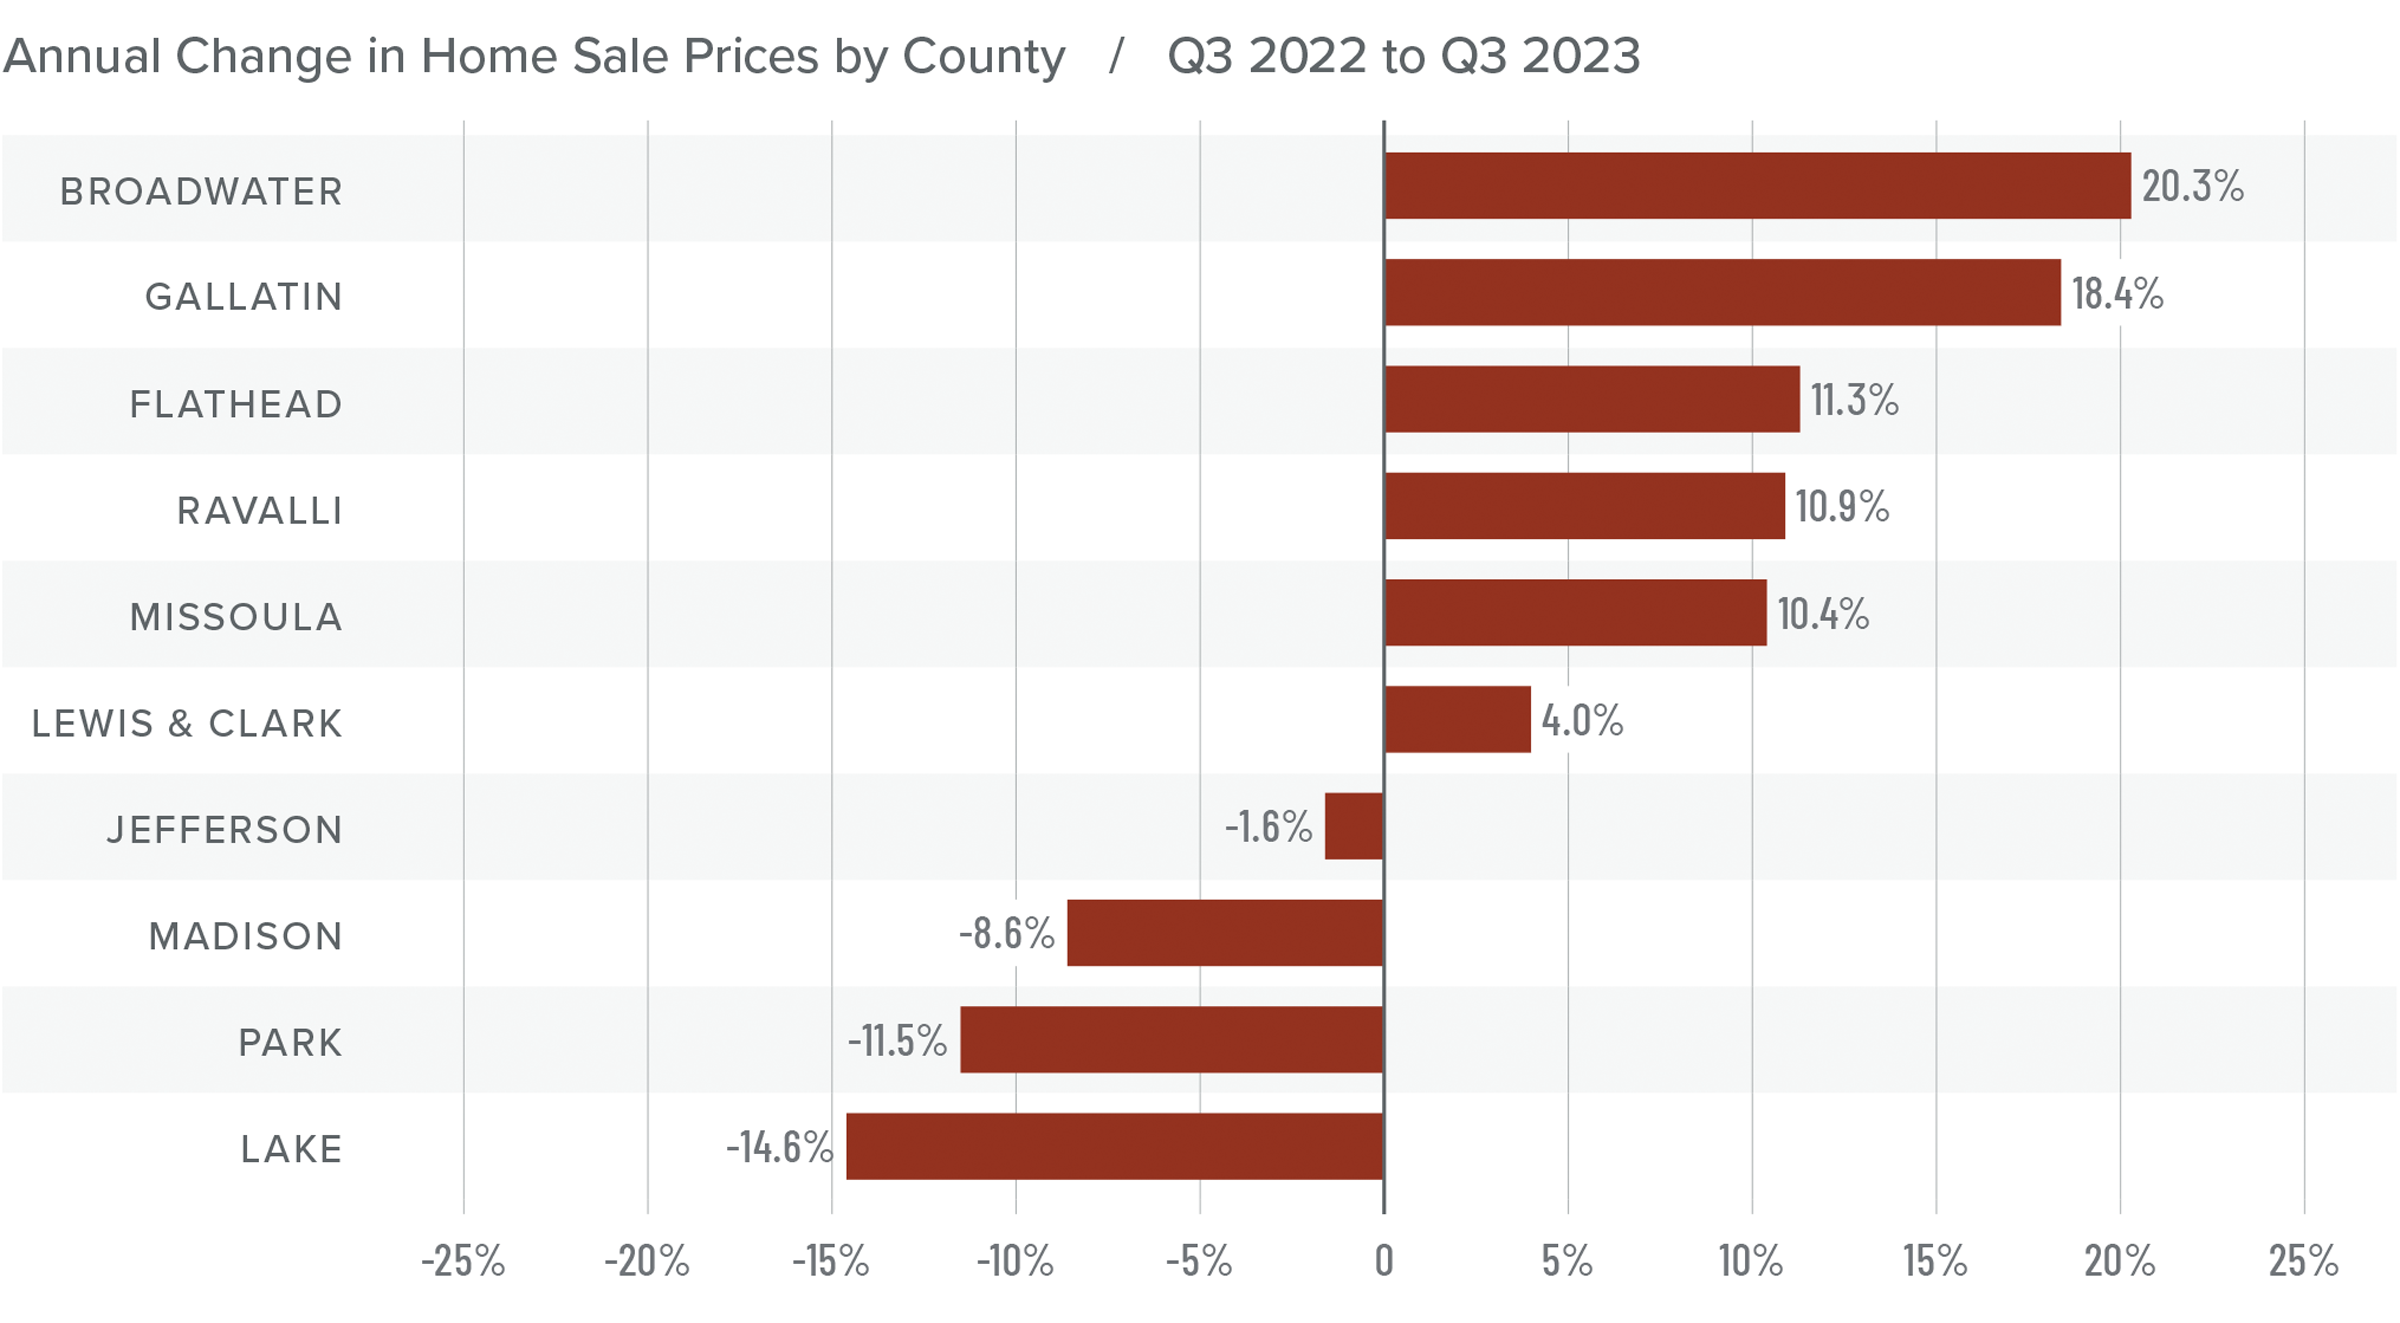
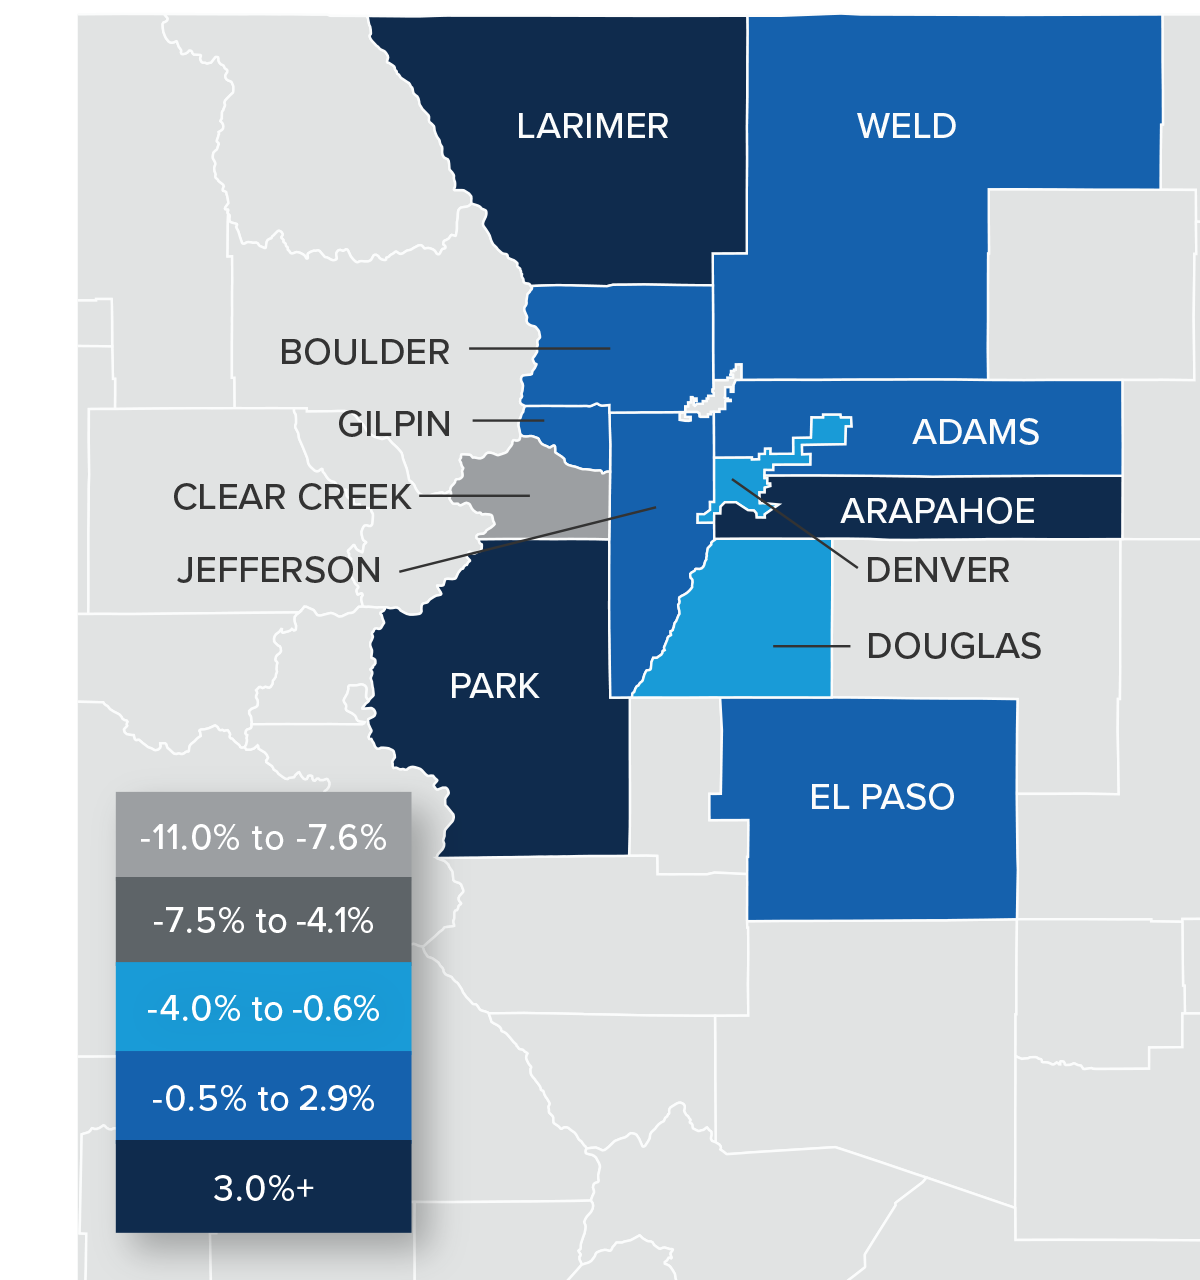
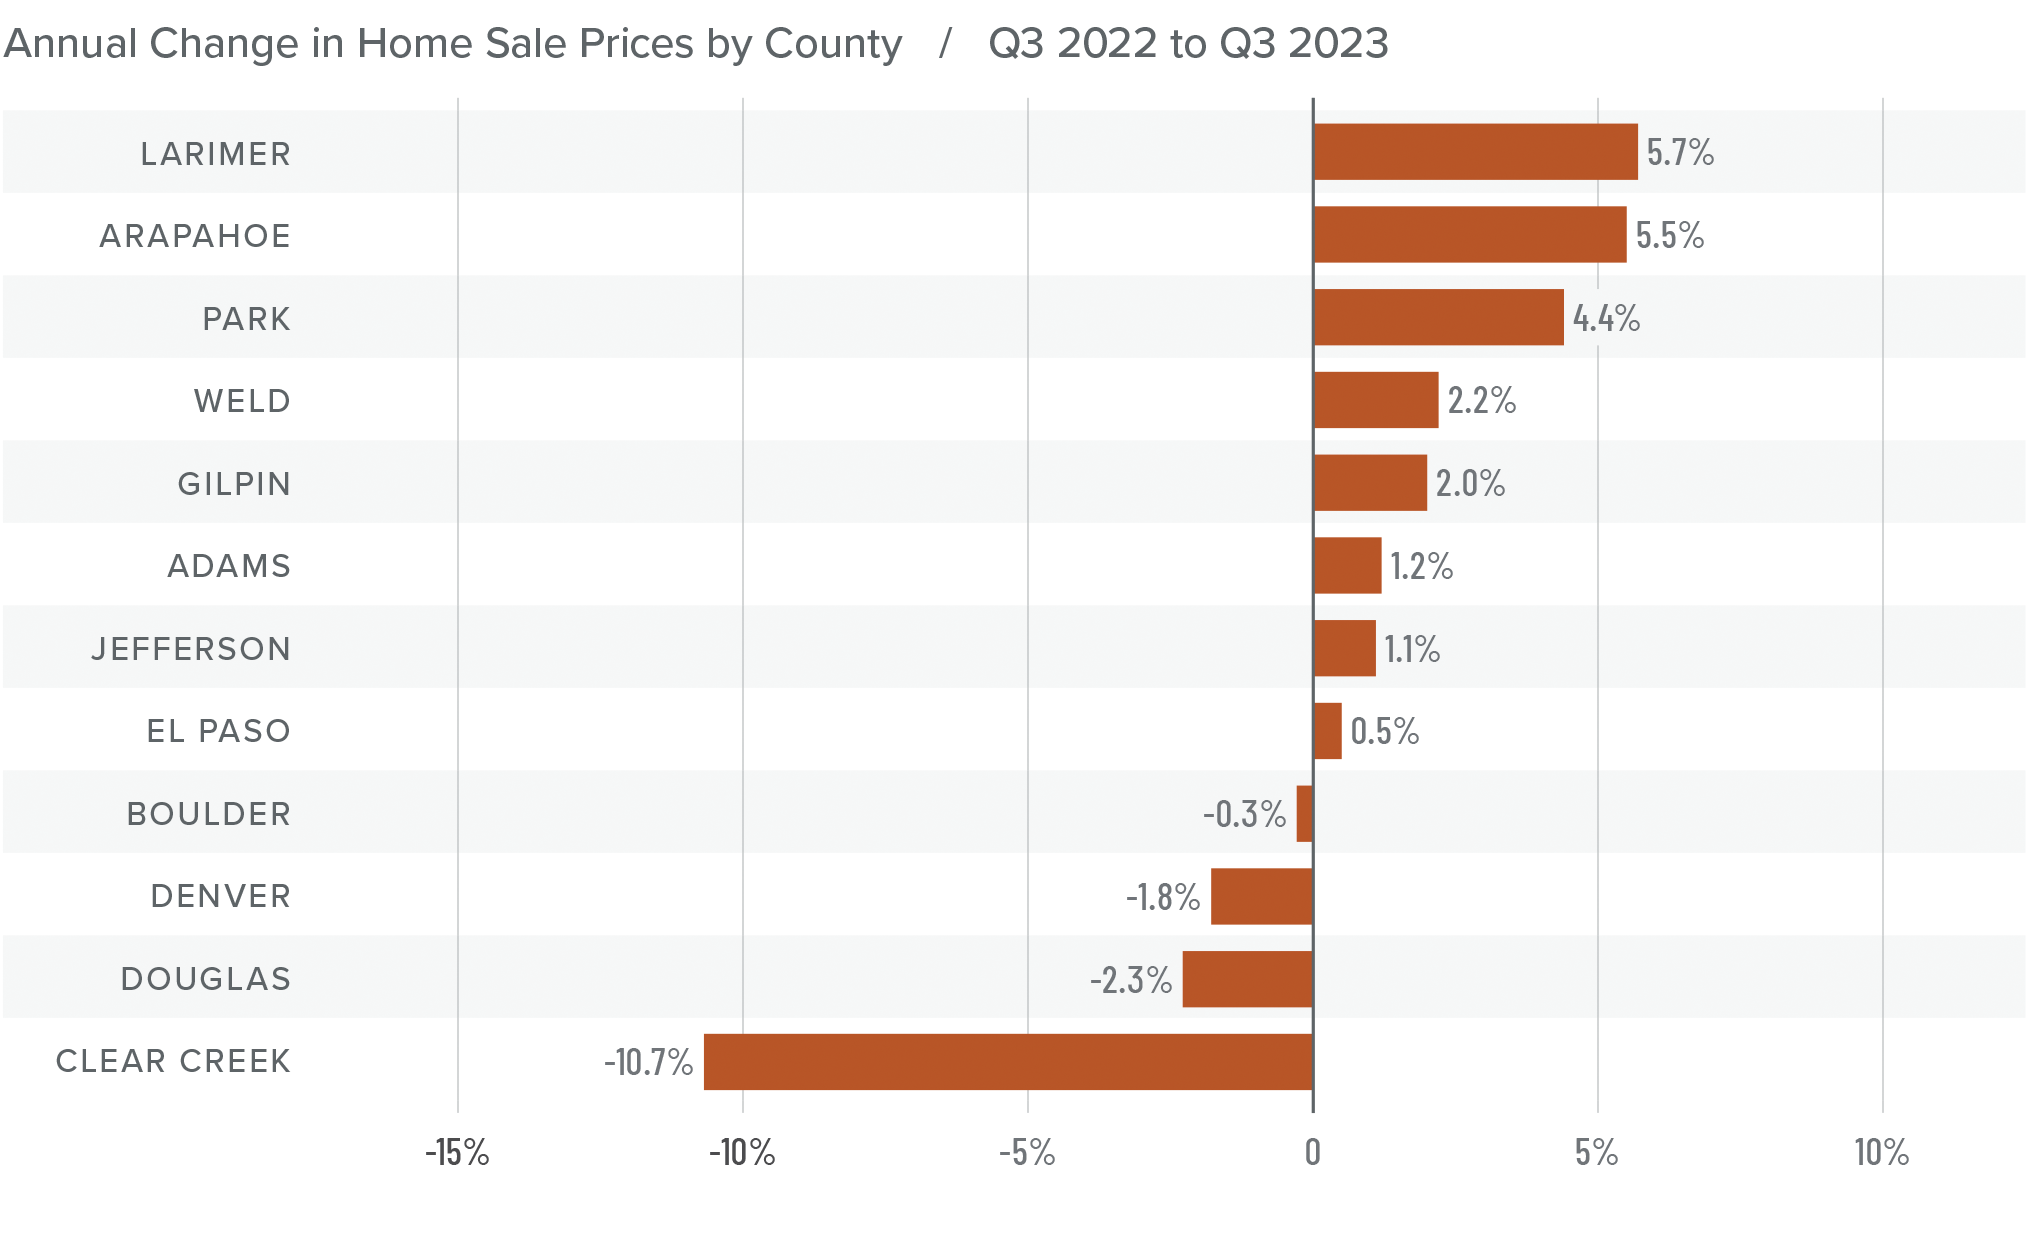
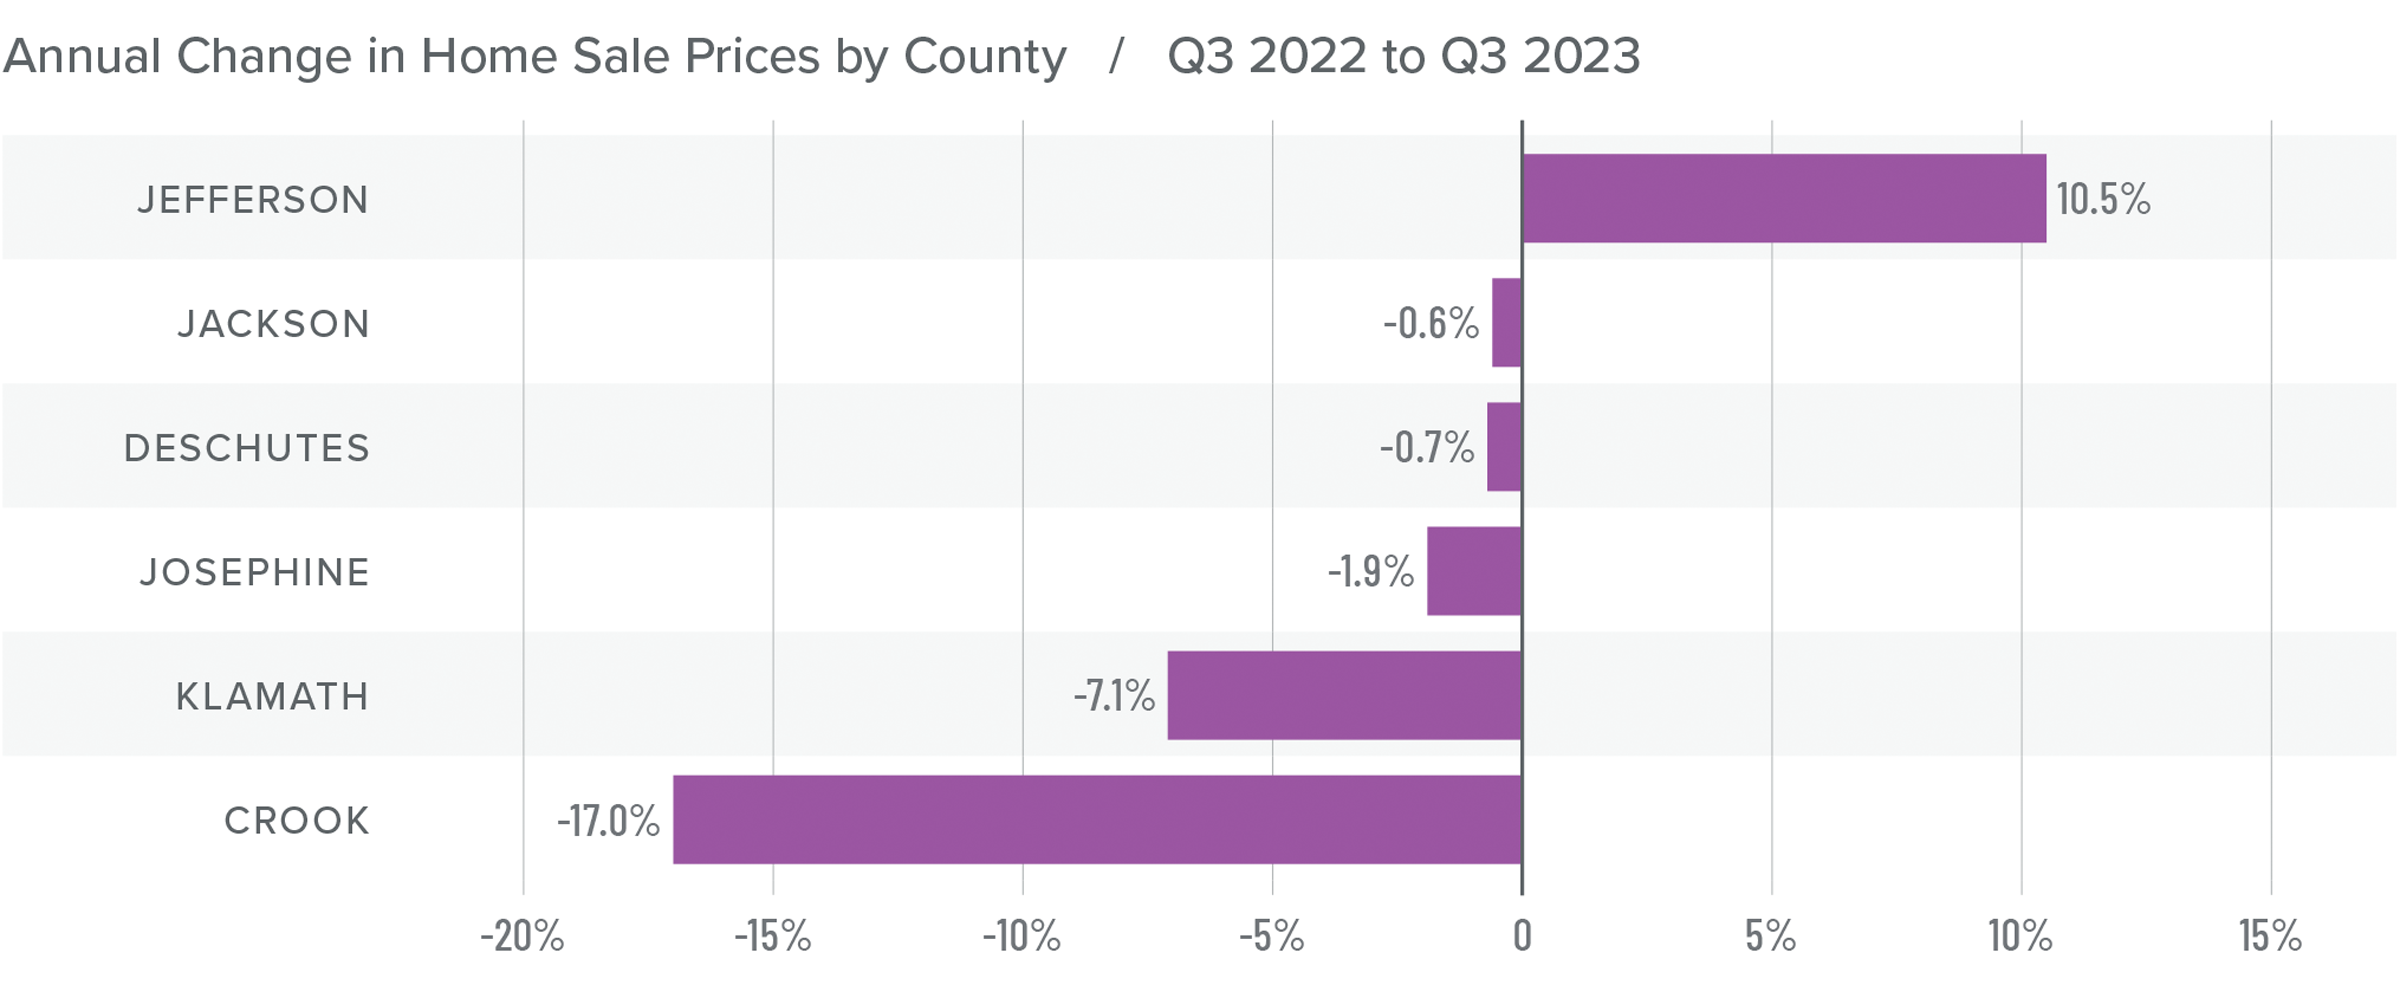
Montana Home Prices
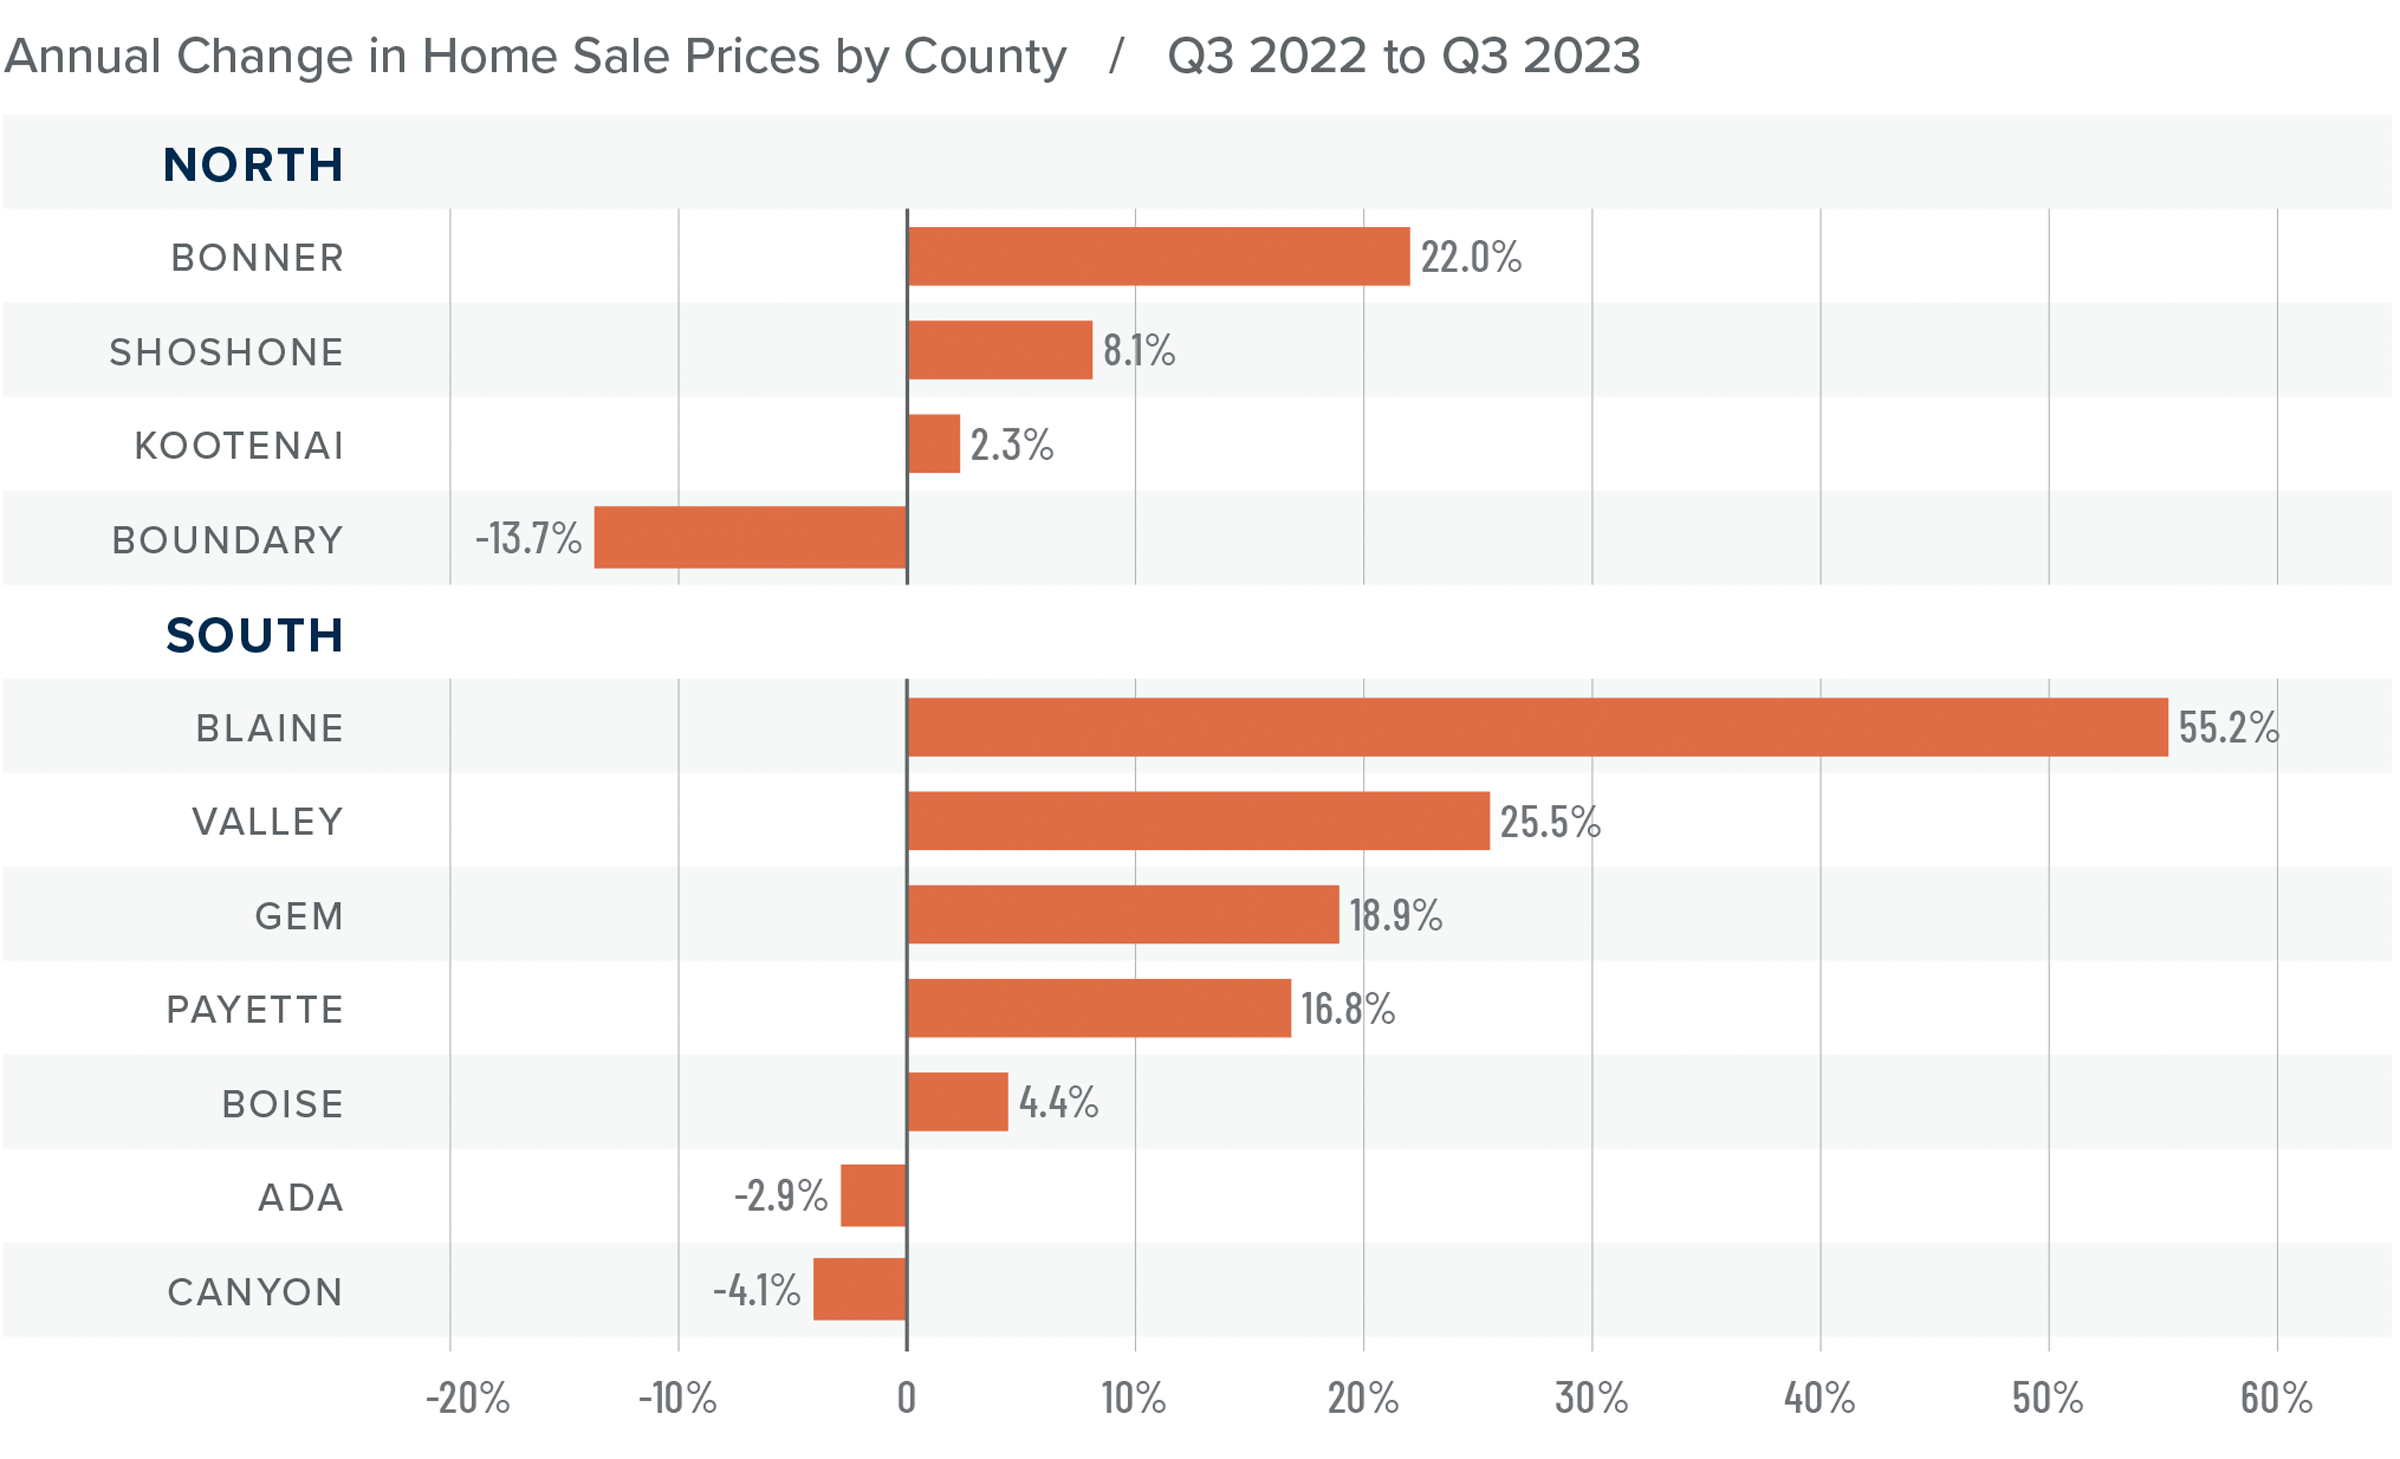
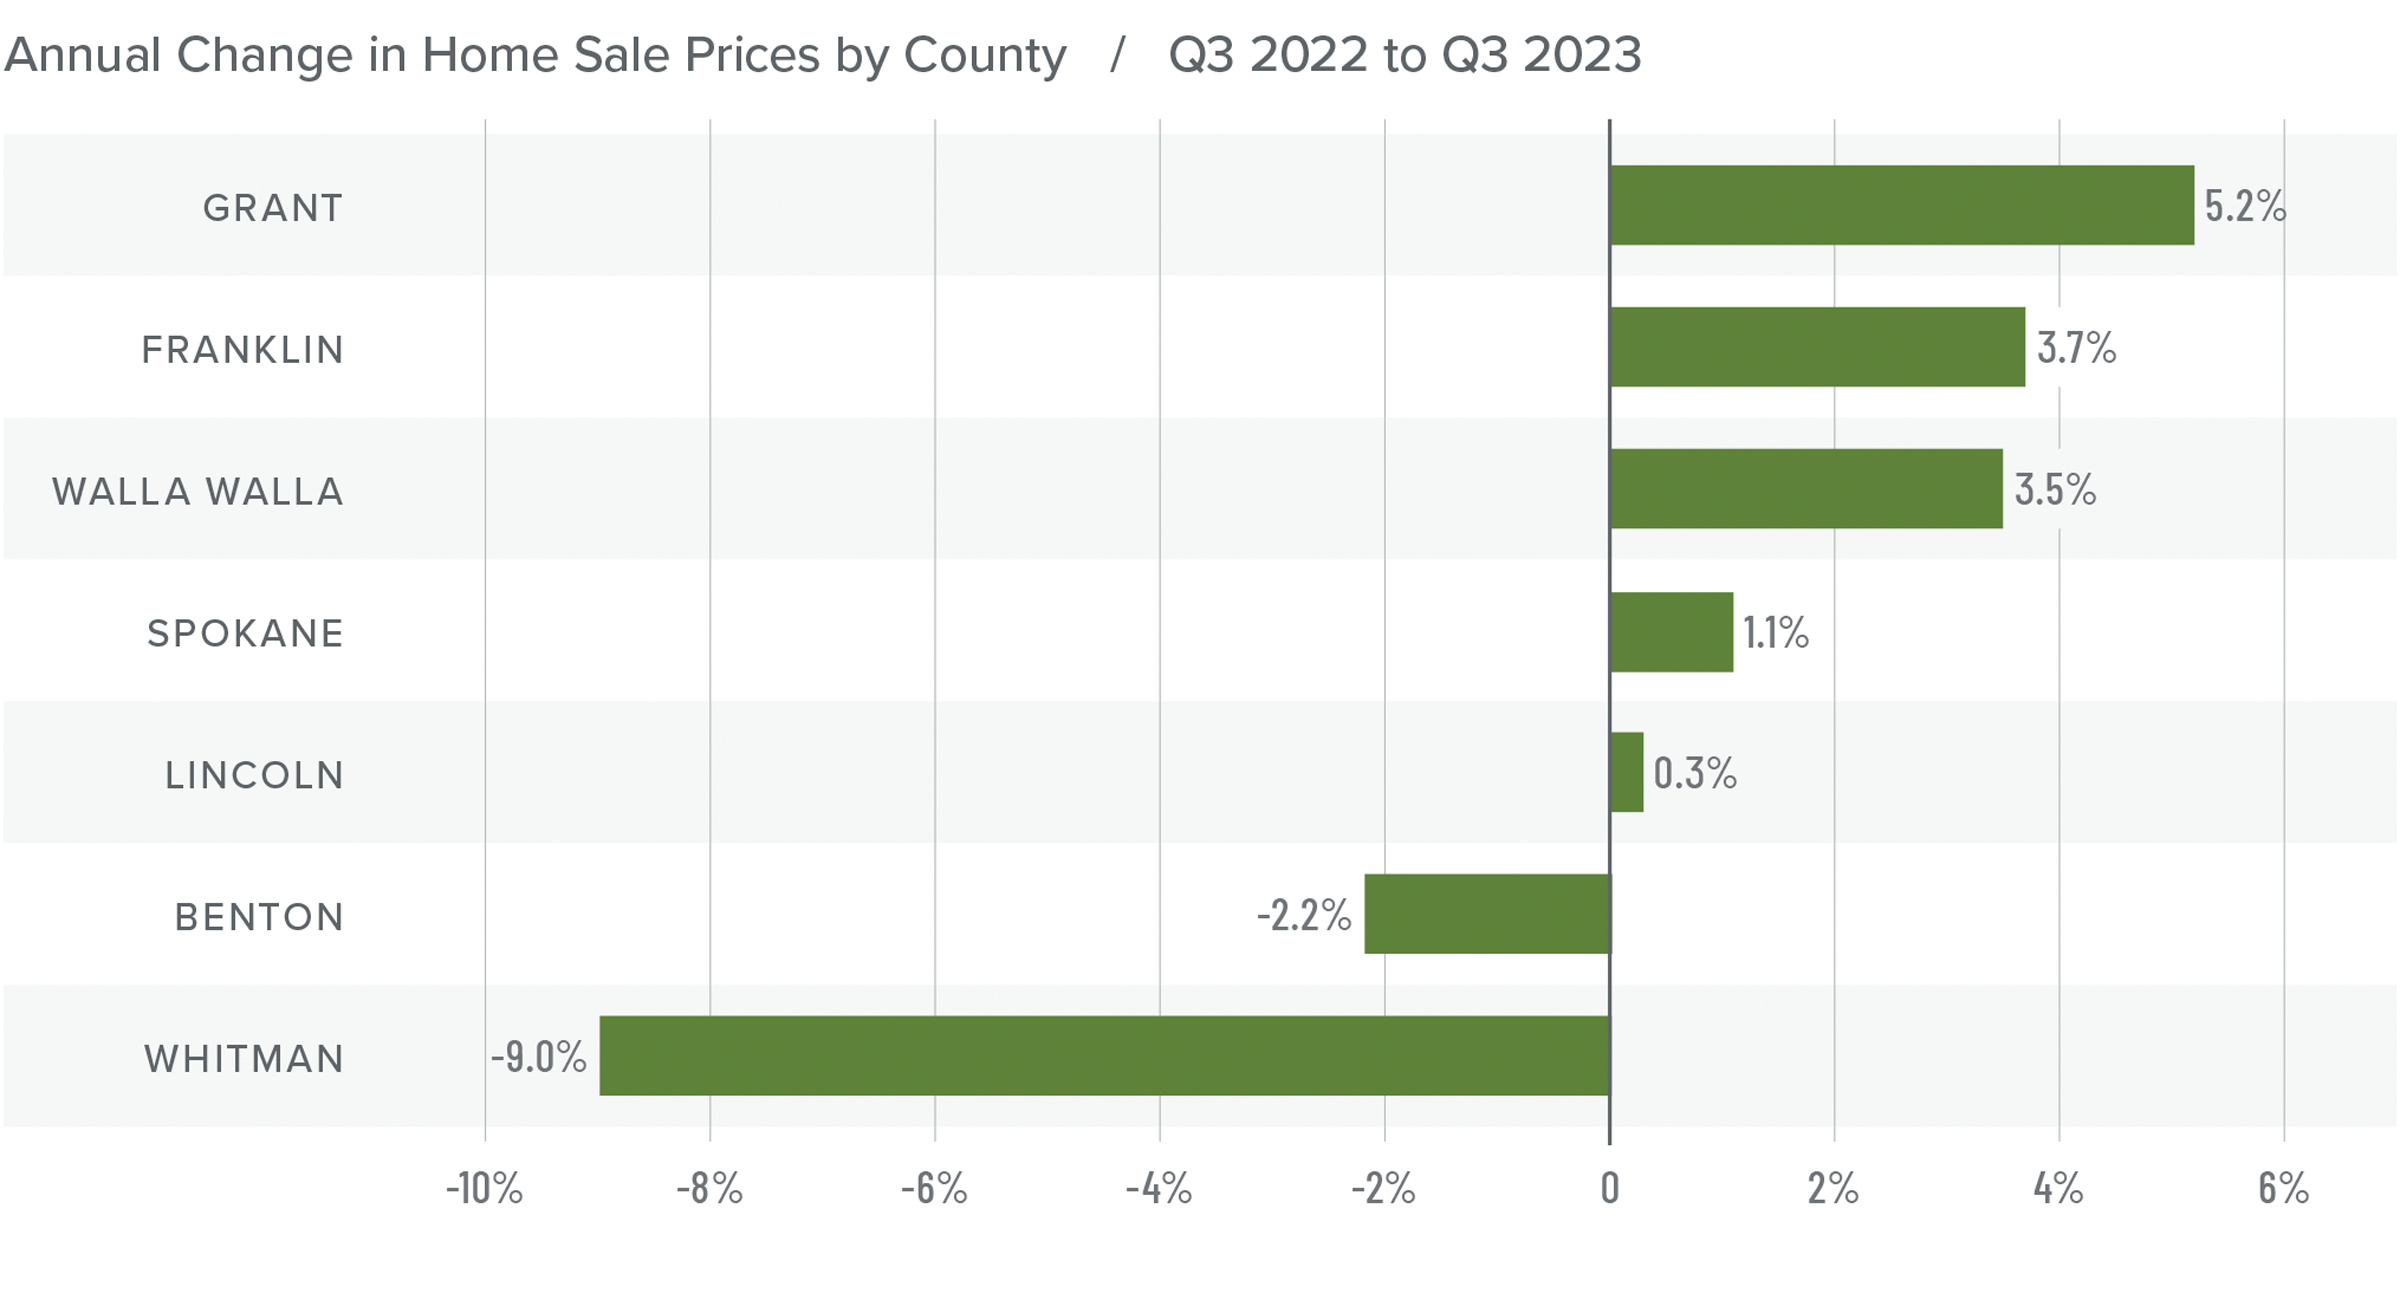
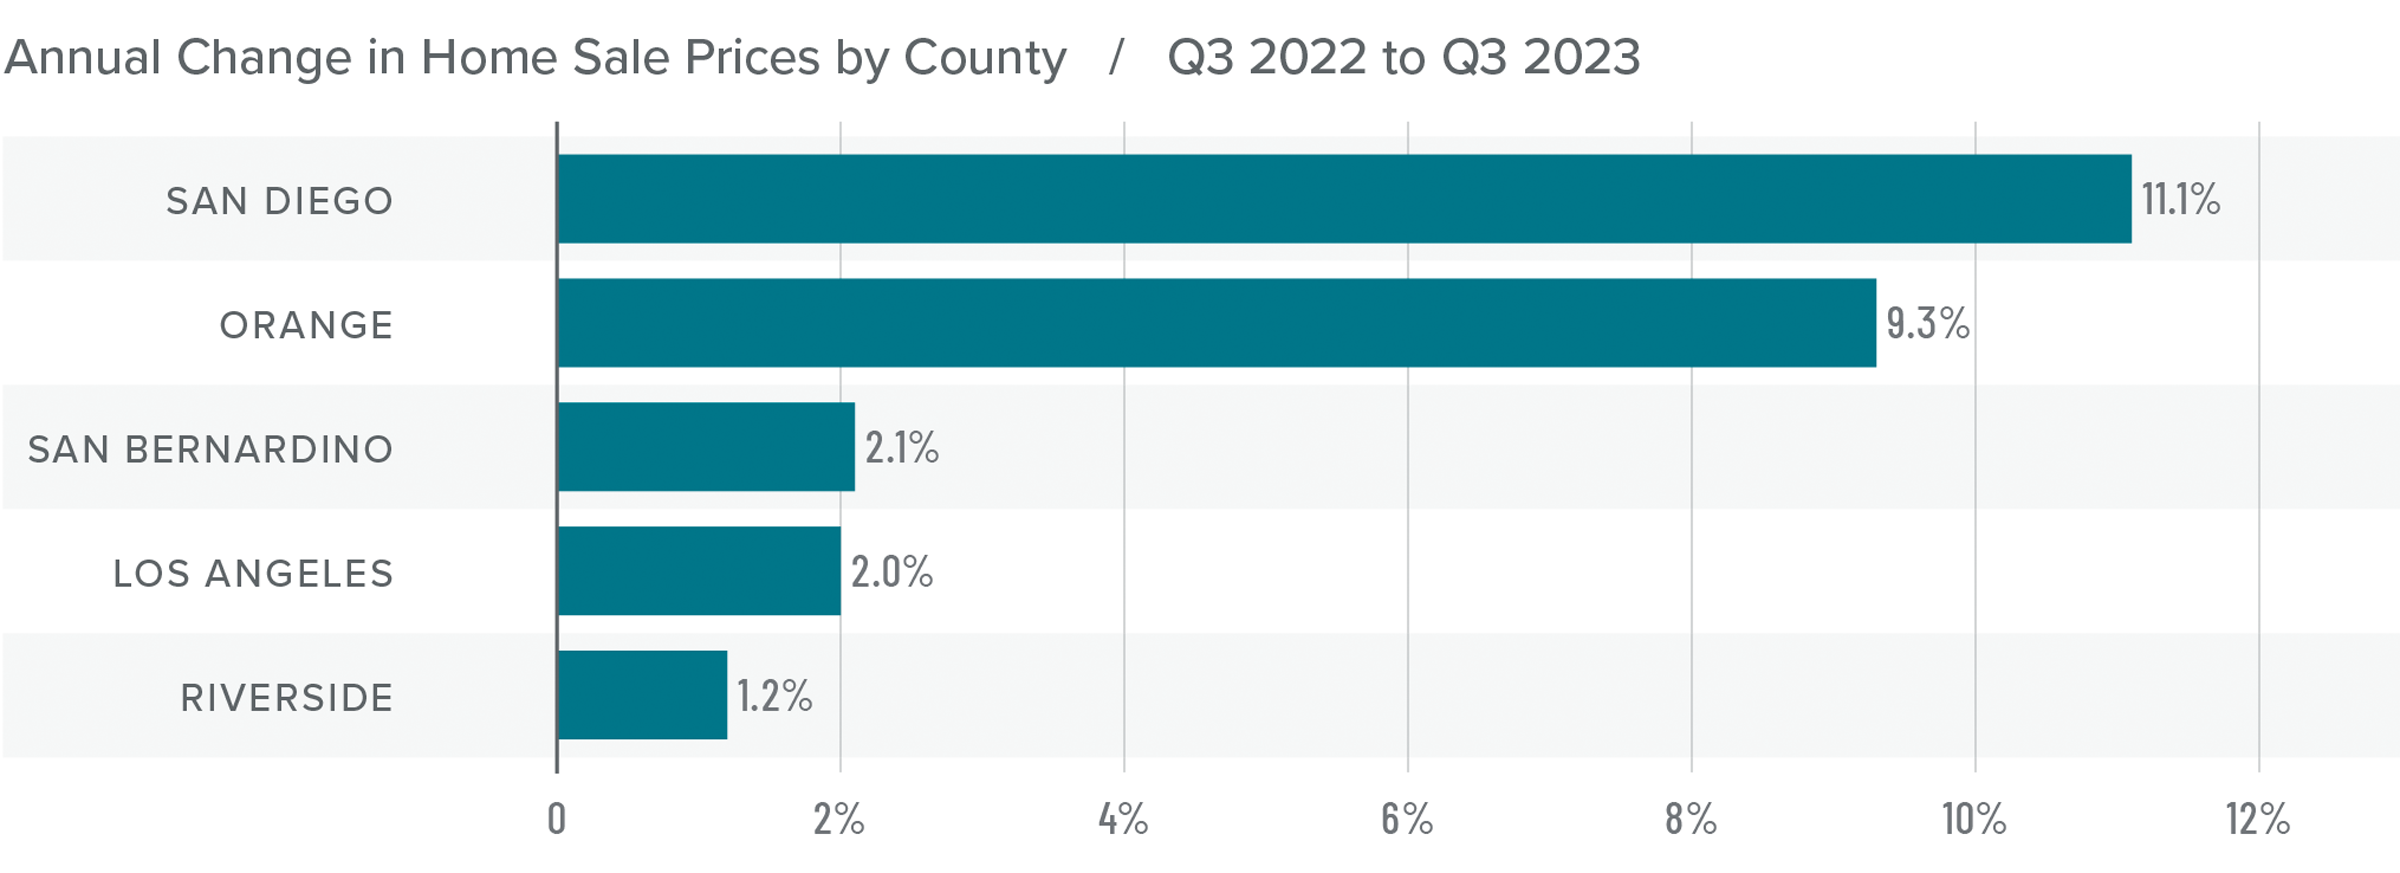
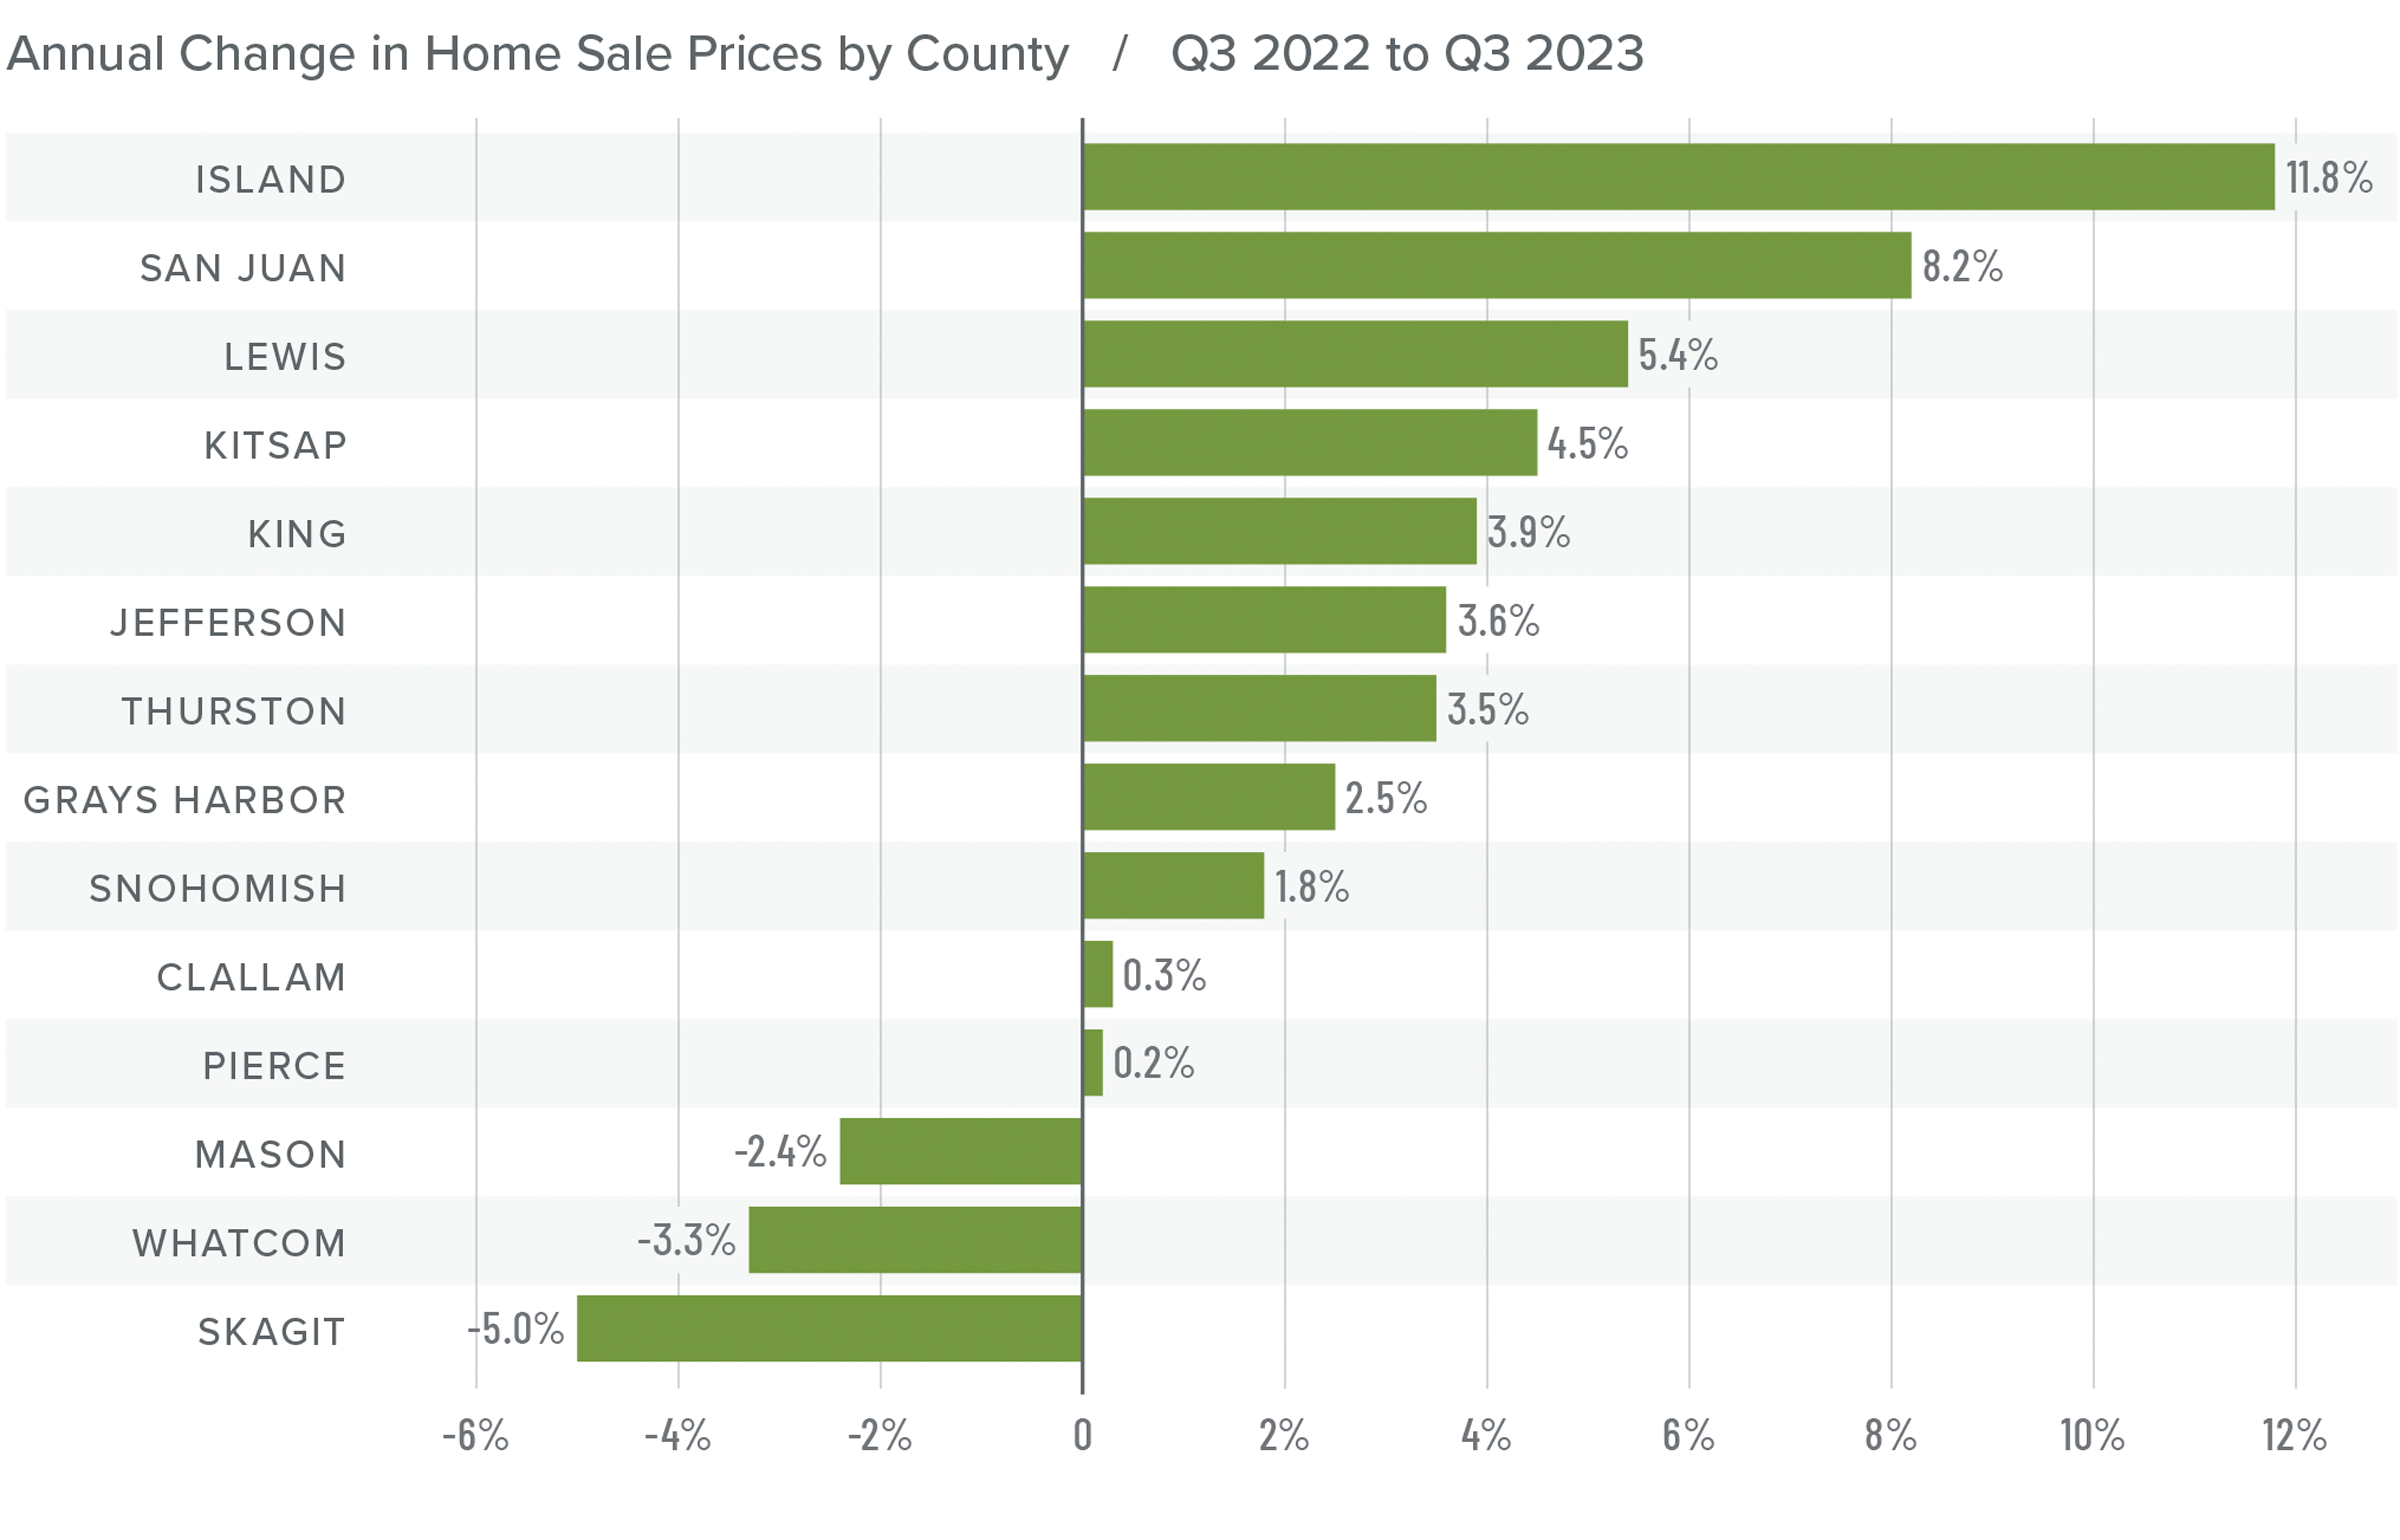
❱ Home prices were up 9.6% year over year. The average sale price was $758,641, which was 12% higher than in the second quarter of 2023.
❱ The growth in home prices is a little surprising given rising financing costs, more choice in the market, and the fact that list prices were higher in most markets than in the second quarter of 2023.
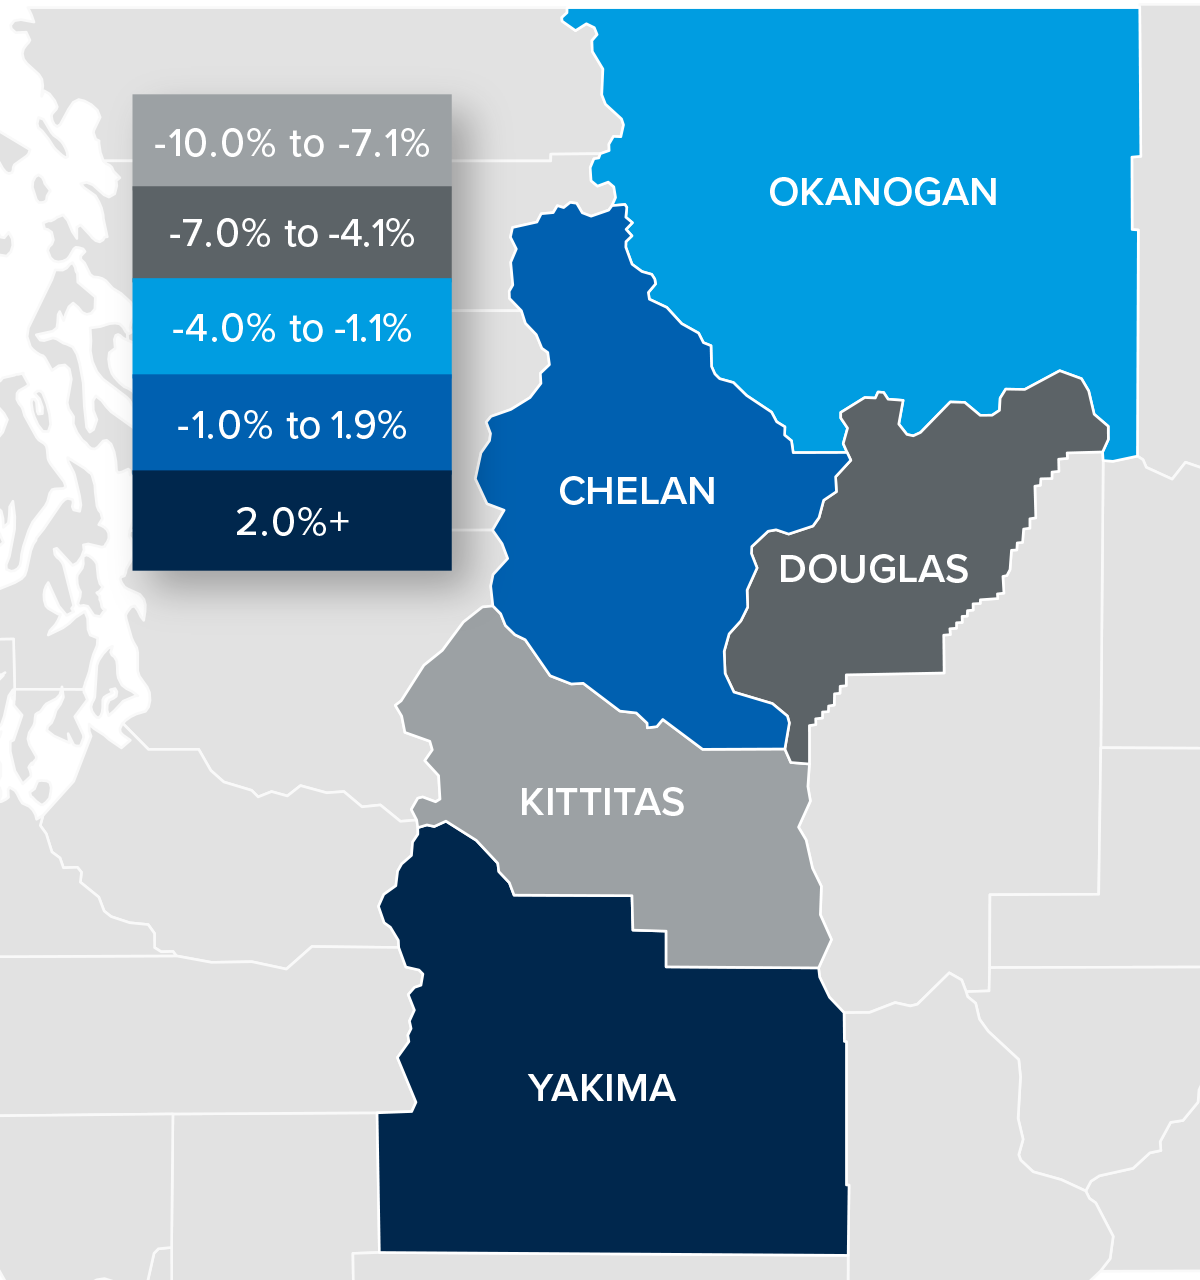
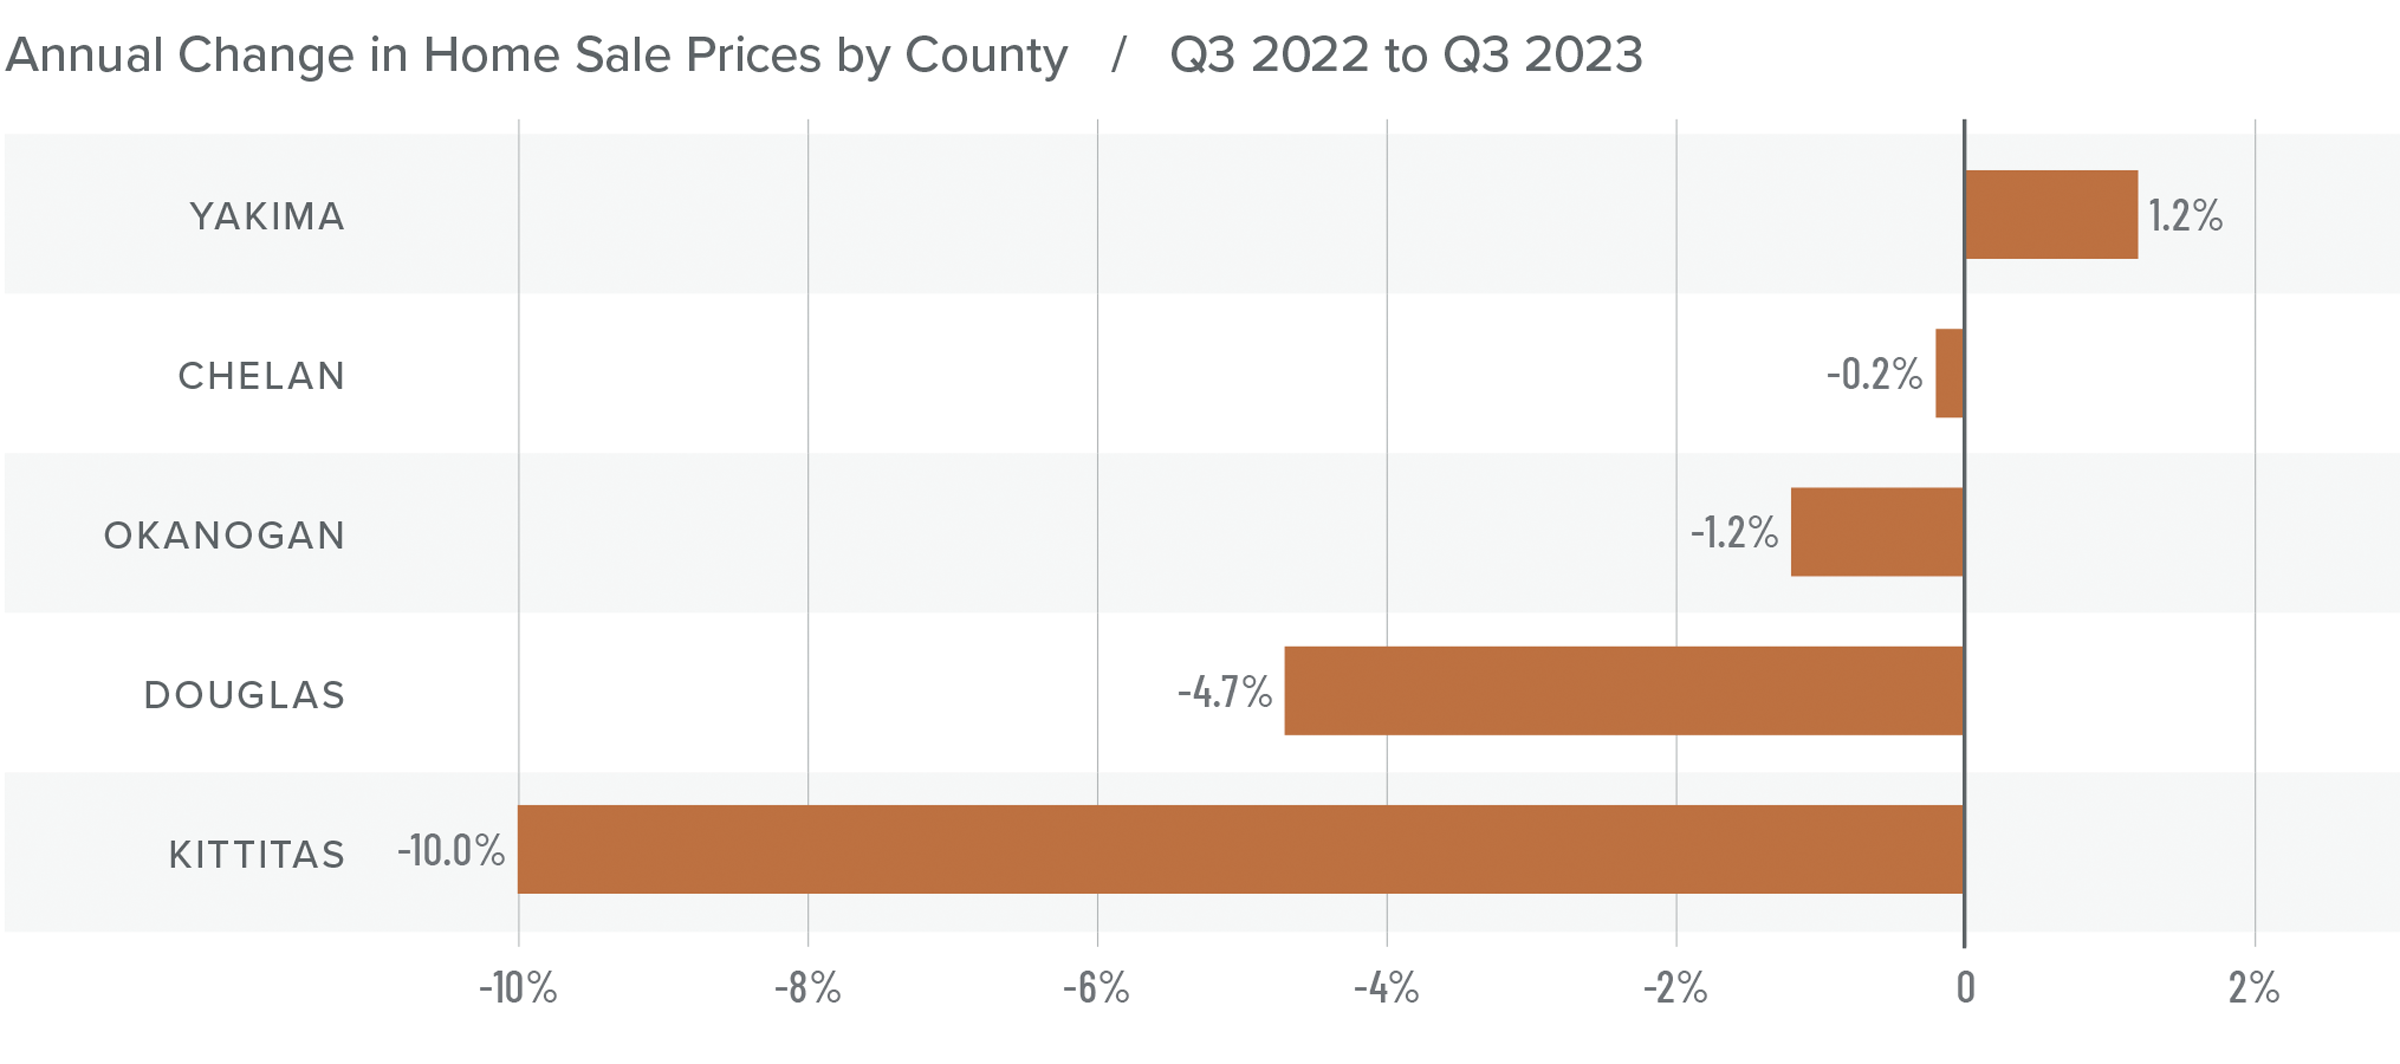
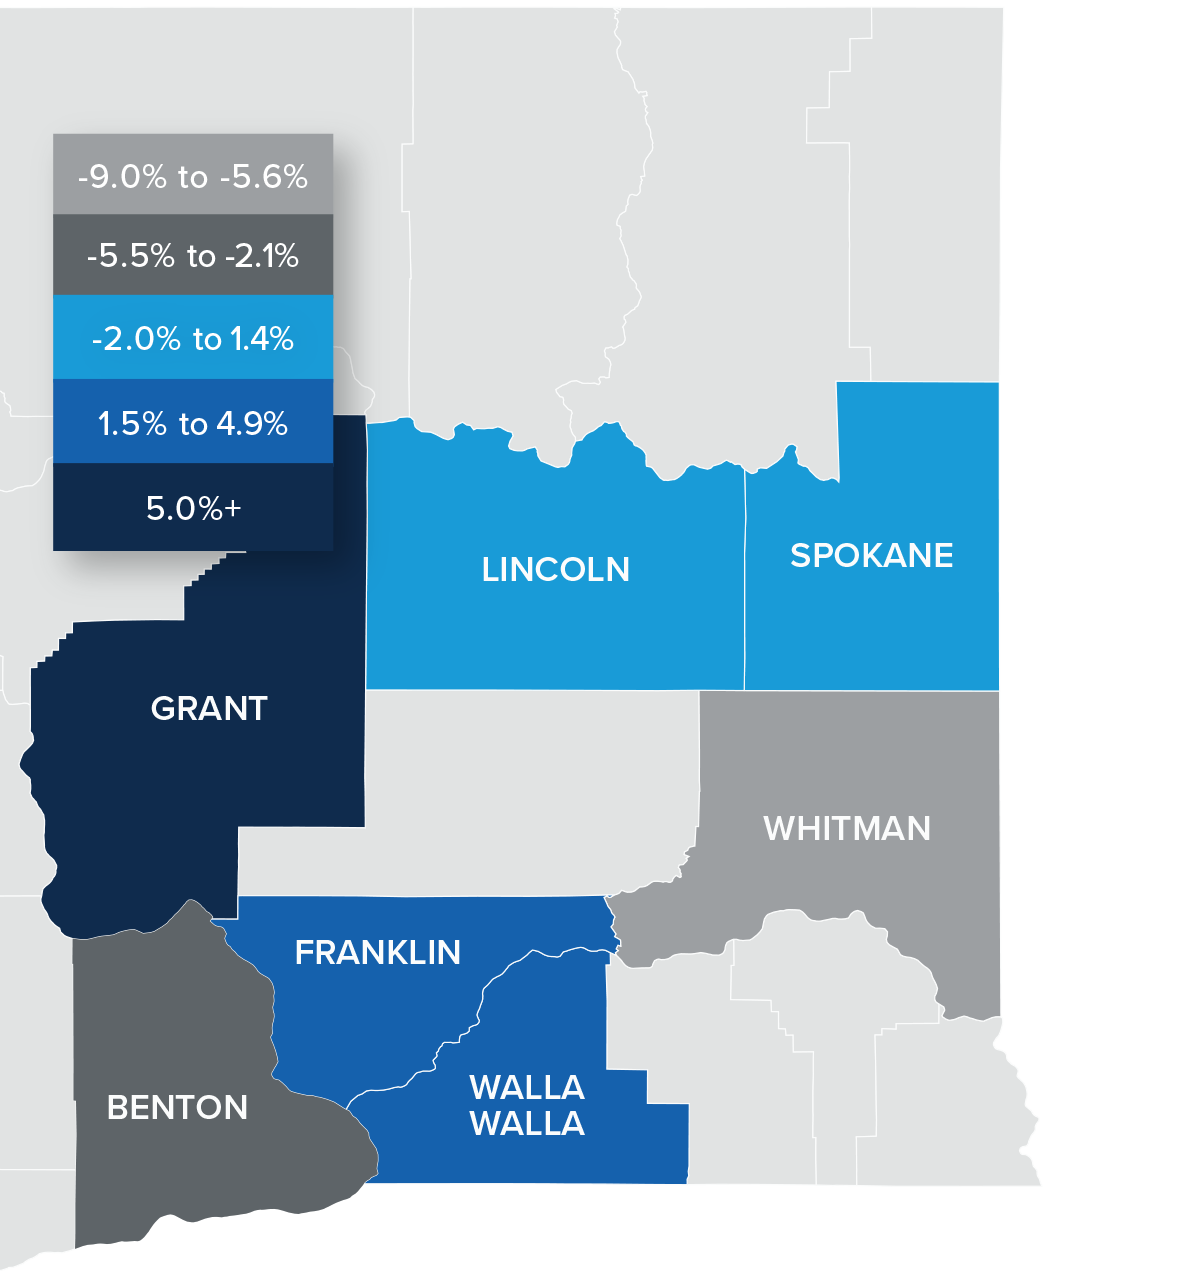
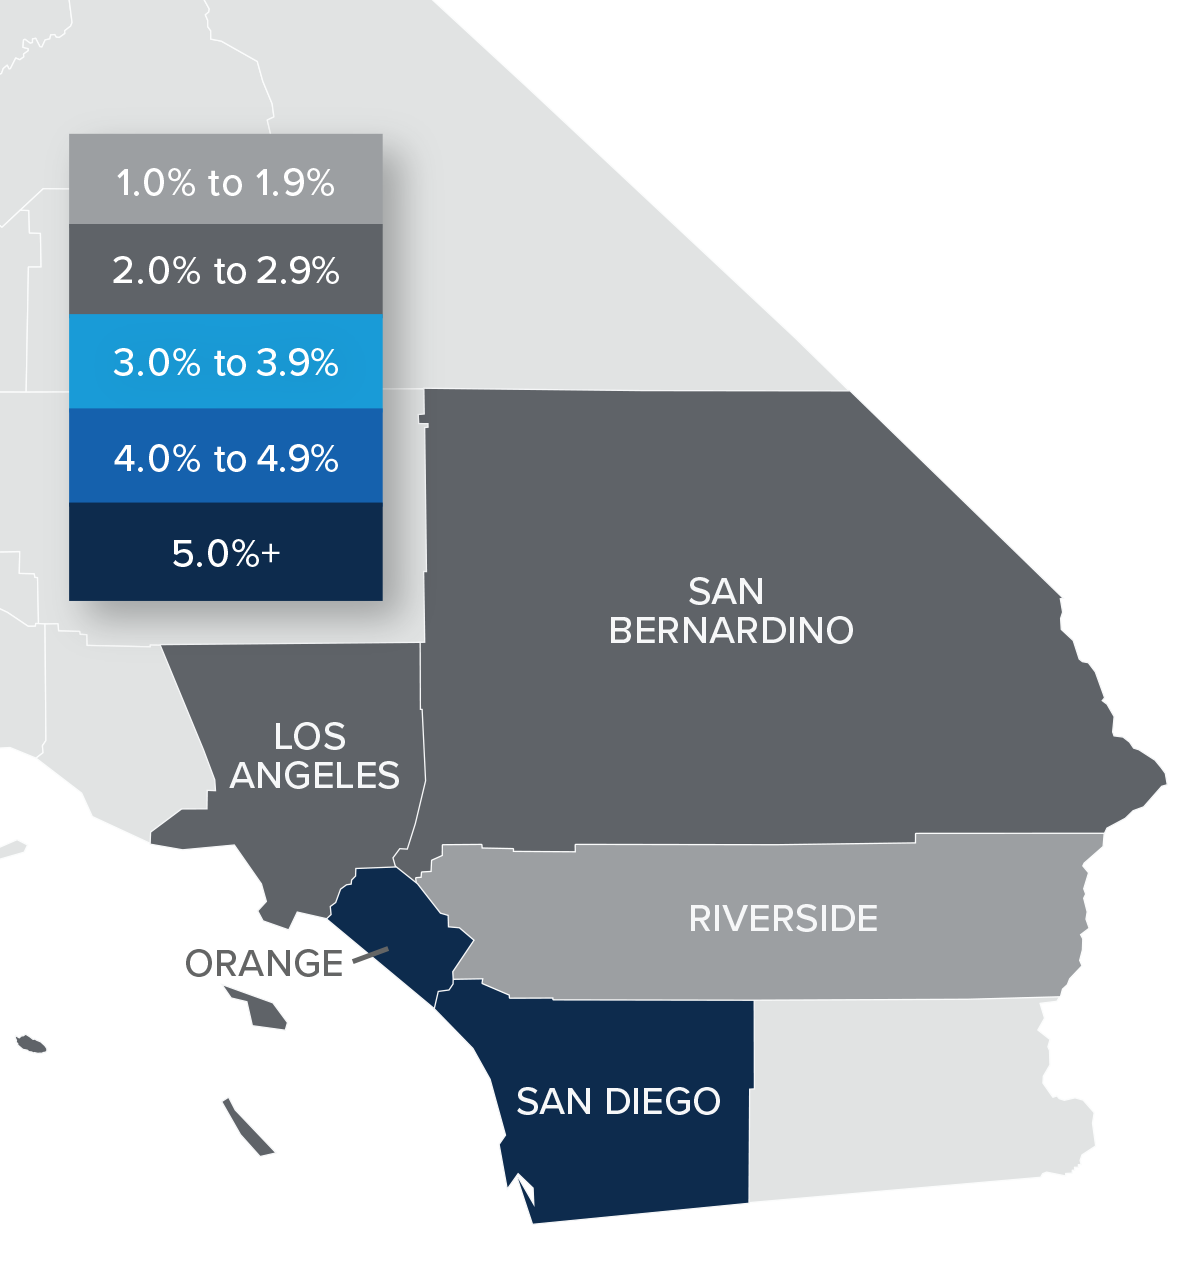
❱ Year over year, prices rose in six counties and fell in four. Compared to the second quarter of this year, prices rose in every county other than Lake and Park.
❱ So far, higher mortgage rates have not been much of a deterrent, at least not yet. I expected price growth to start tapering by now, but it appears I was a little premature. That said, I stand by my belief that high mortgage rates will begin to impact price growth as we move toward the end of the year.

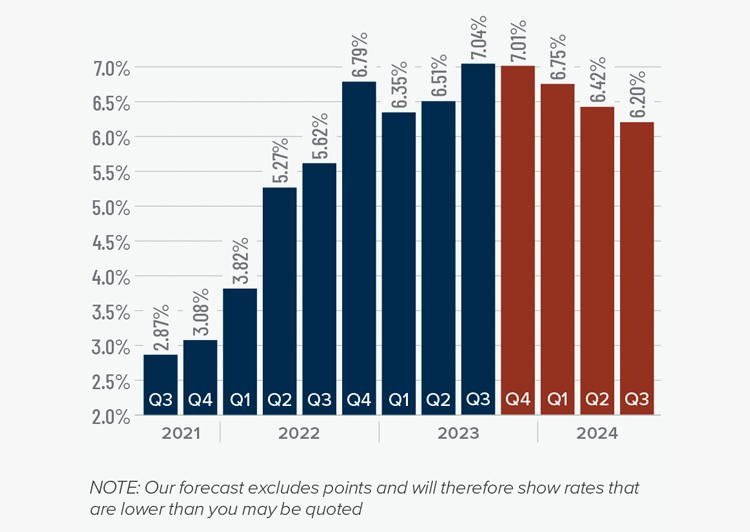
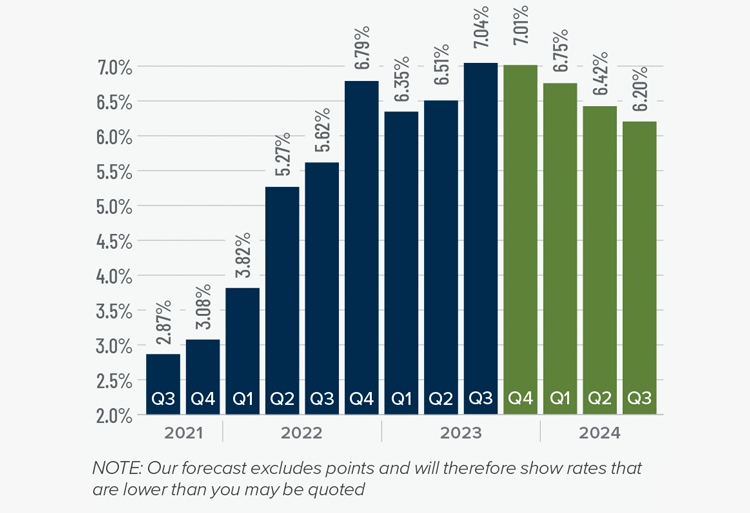
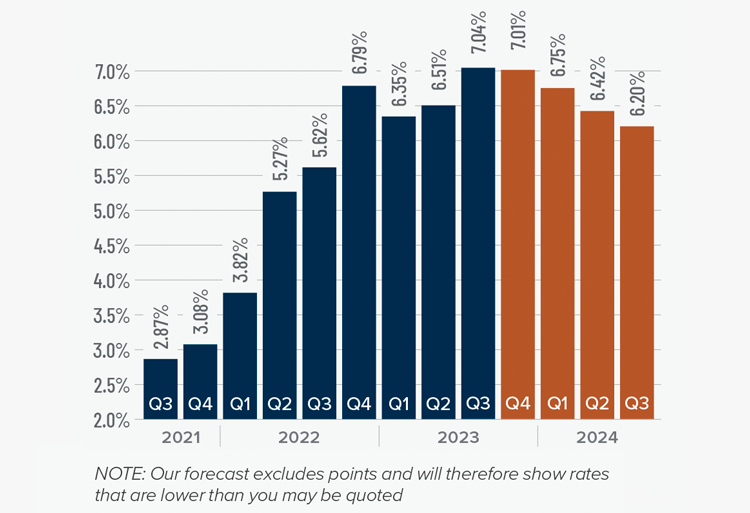
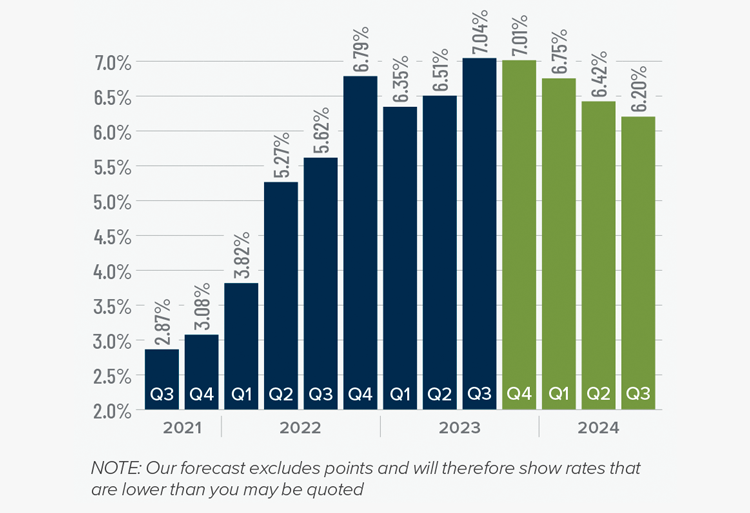
Mortgage Rates
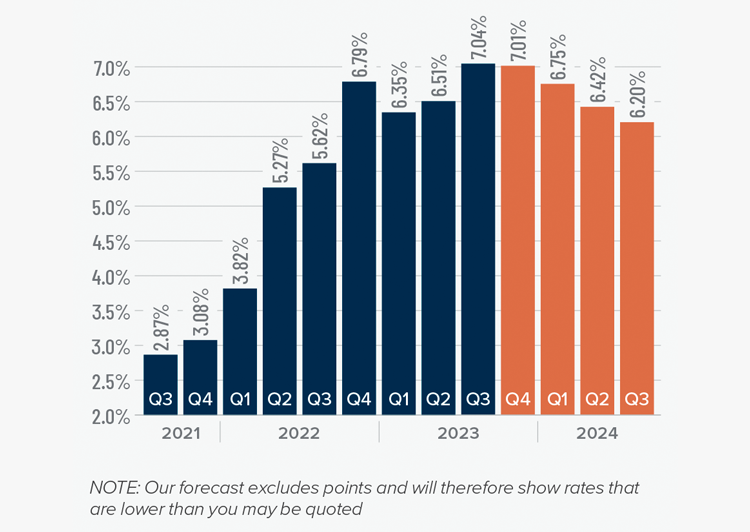
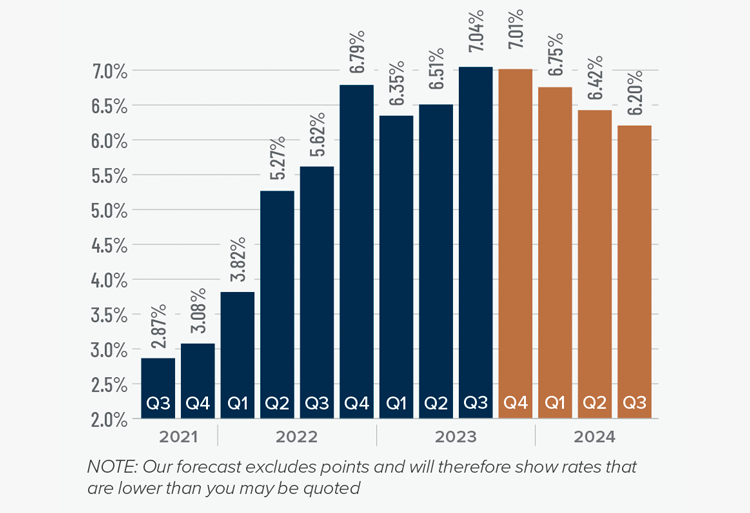
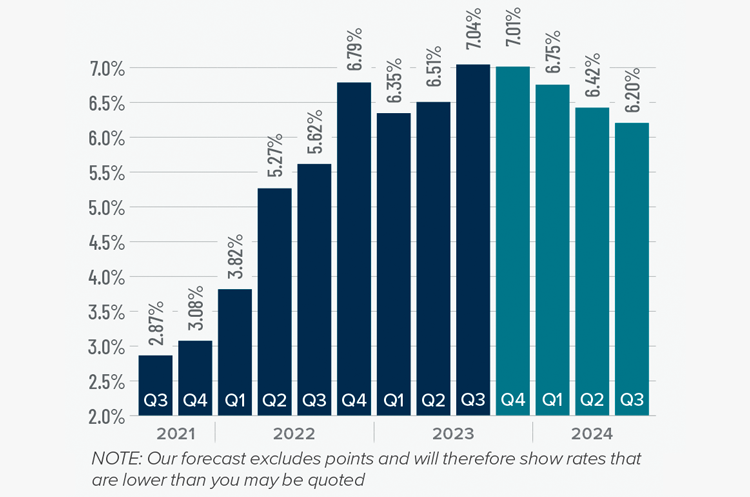
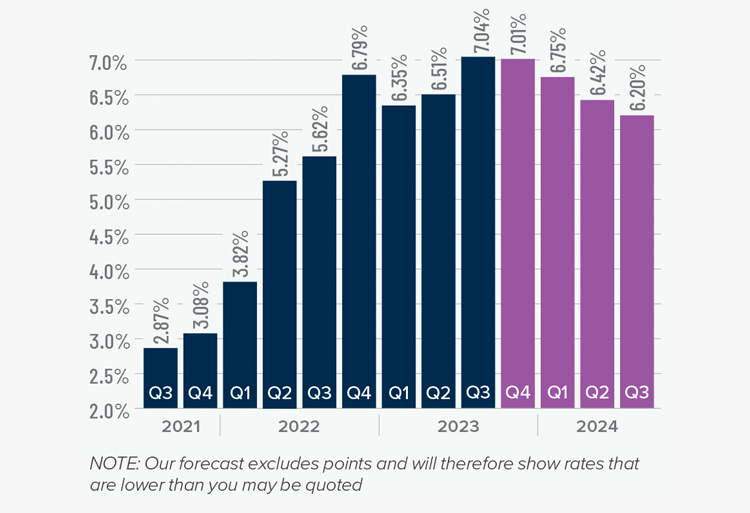
Mortgage rates continued trending higher in the third quarter of 2023 and are now at levels we have not seen since the fall of 2000. Mortgage rates are tied to the interest rate (yield) on 10-year treasuries, and they move in the opposite direction of the economy. Unfortunately for mortgage rates, the economy remains relatively buoyant, and though inflation is down significantly from its high, it is still elevated. These major factors and many minor ones are pushing Treasury yields higher, which is pushing mortgage rates up. Given the current position of the Federal Reserve, which intends to keep rates “higher for longer,” it is unlikely that home buyers will get much reprieve when it comes to borrowing costs any time soon.
With such a persistently positive economy, I have had to revise my forecast yet again. I now believe rates will hold at current levels before starting to trend down in the spring of next year.
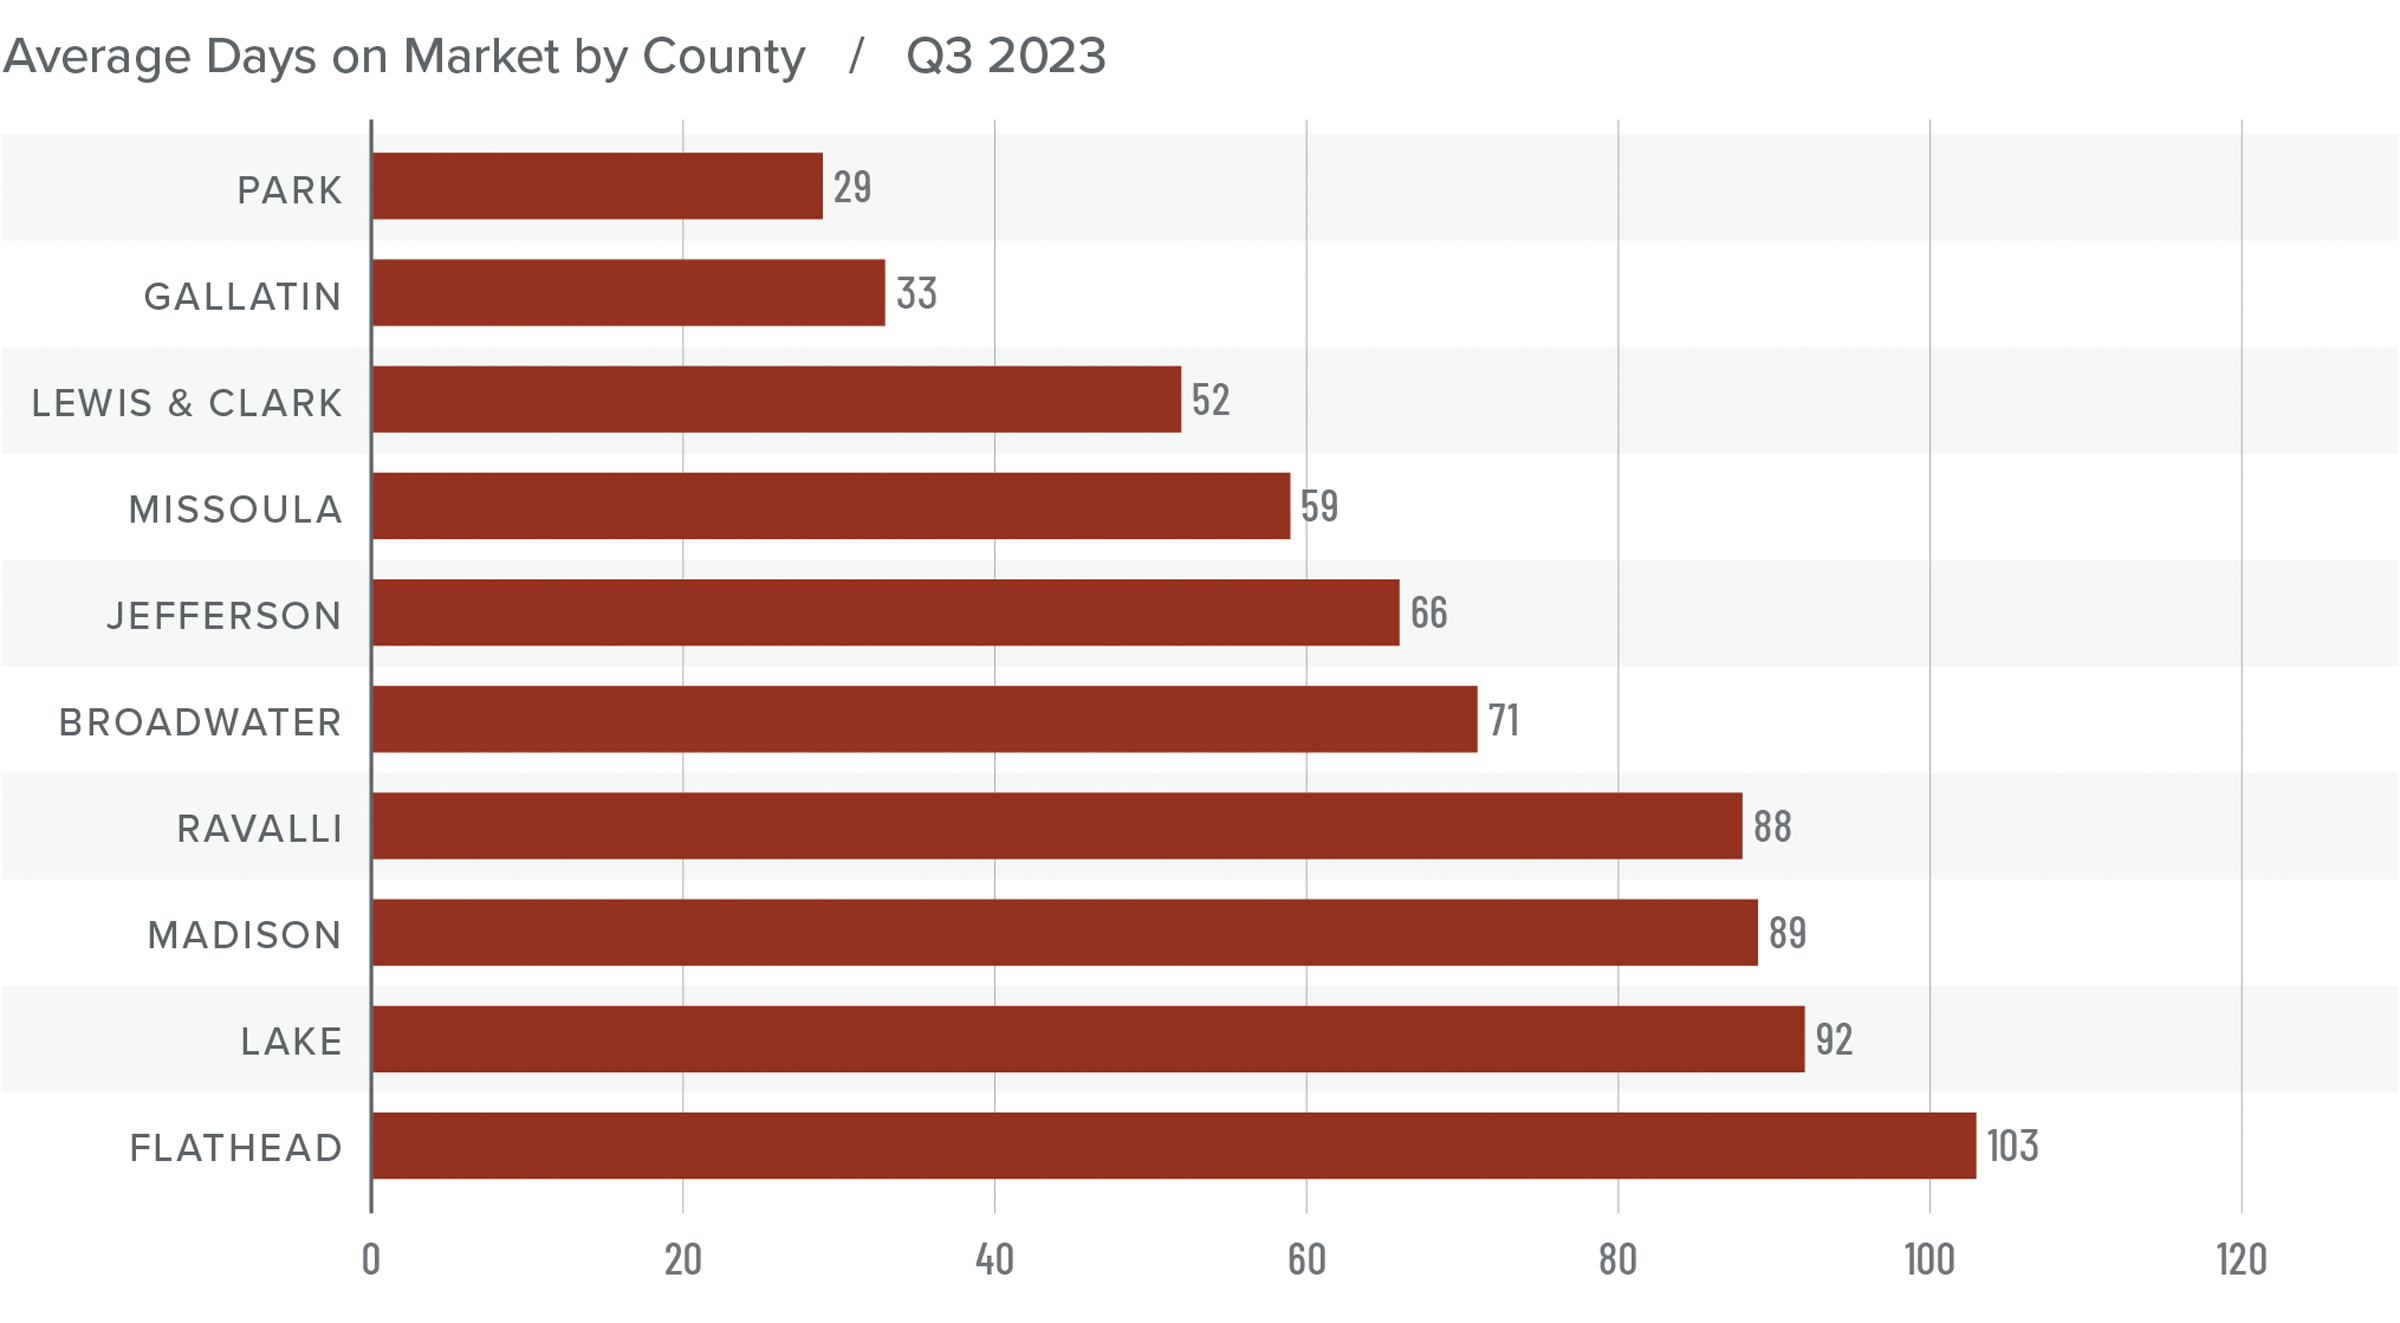
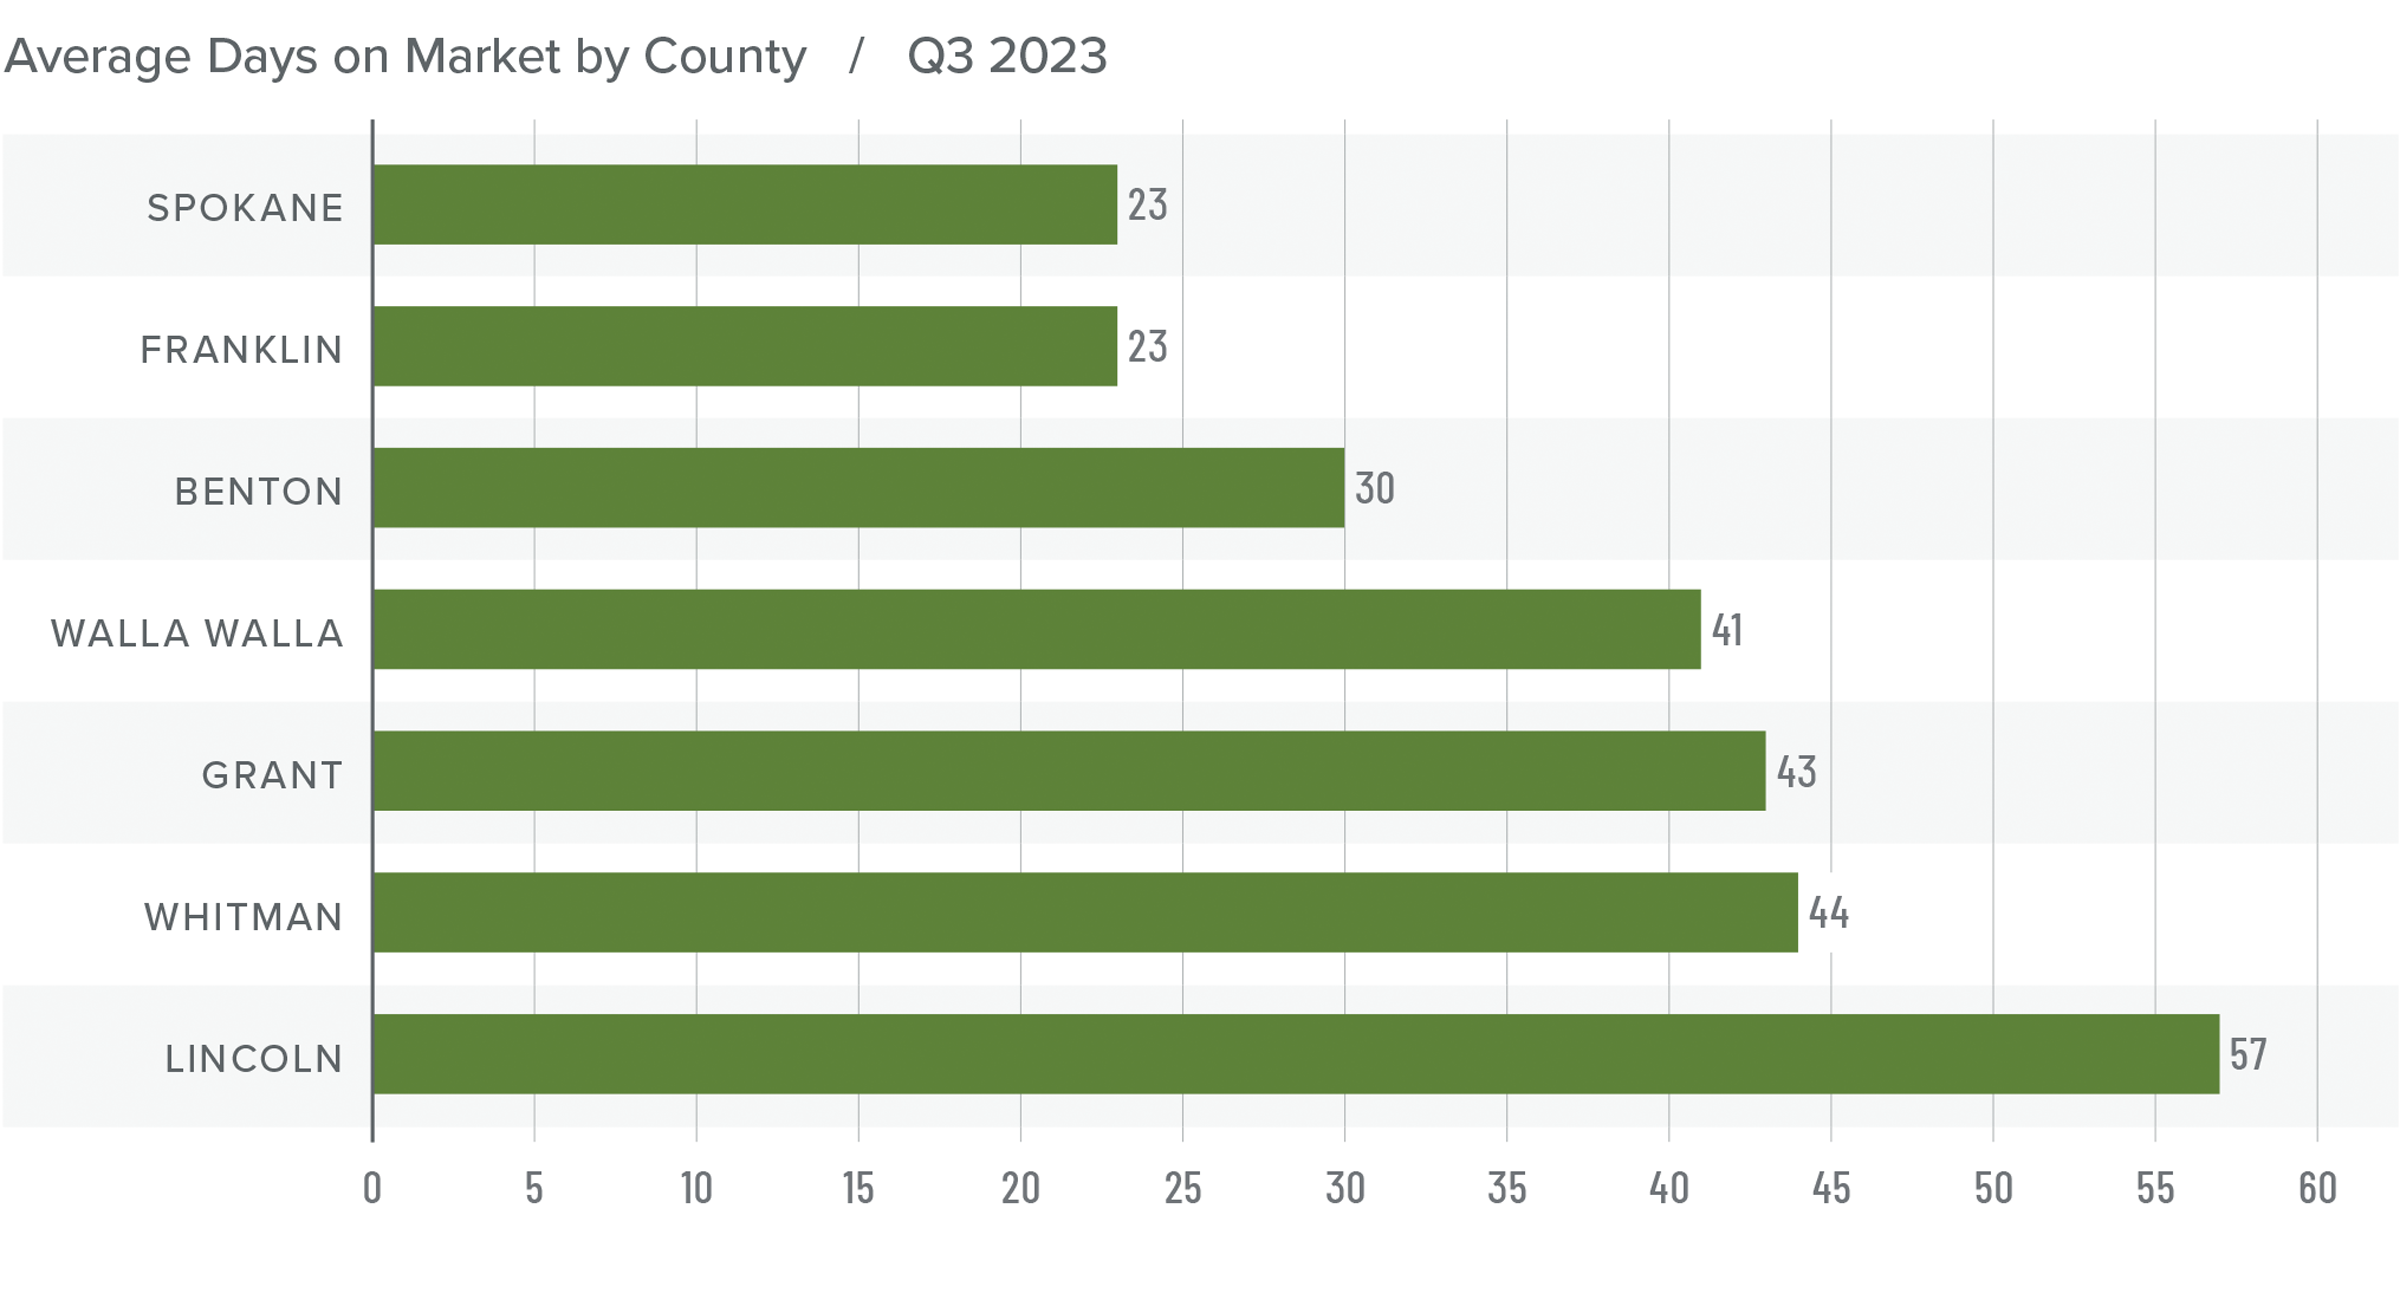
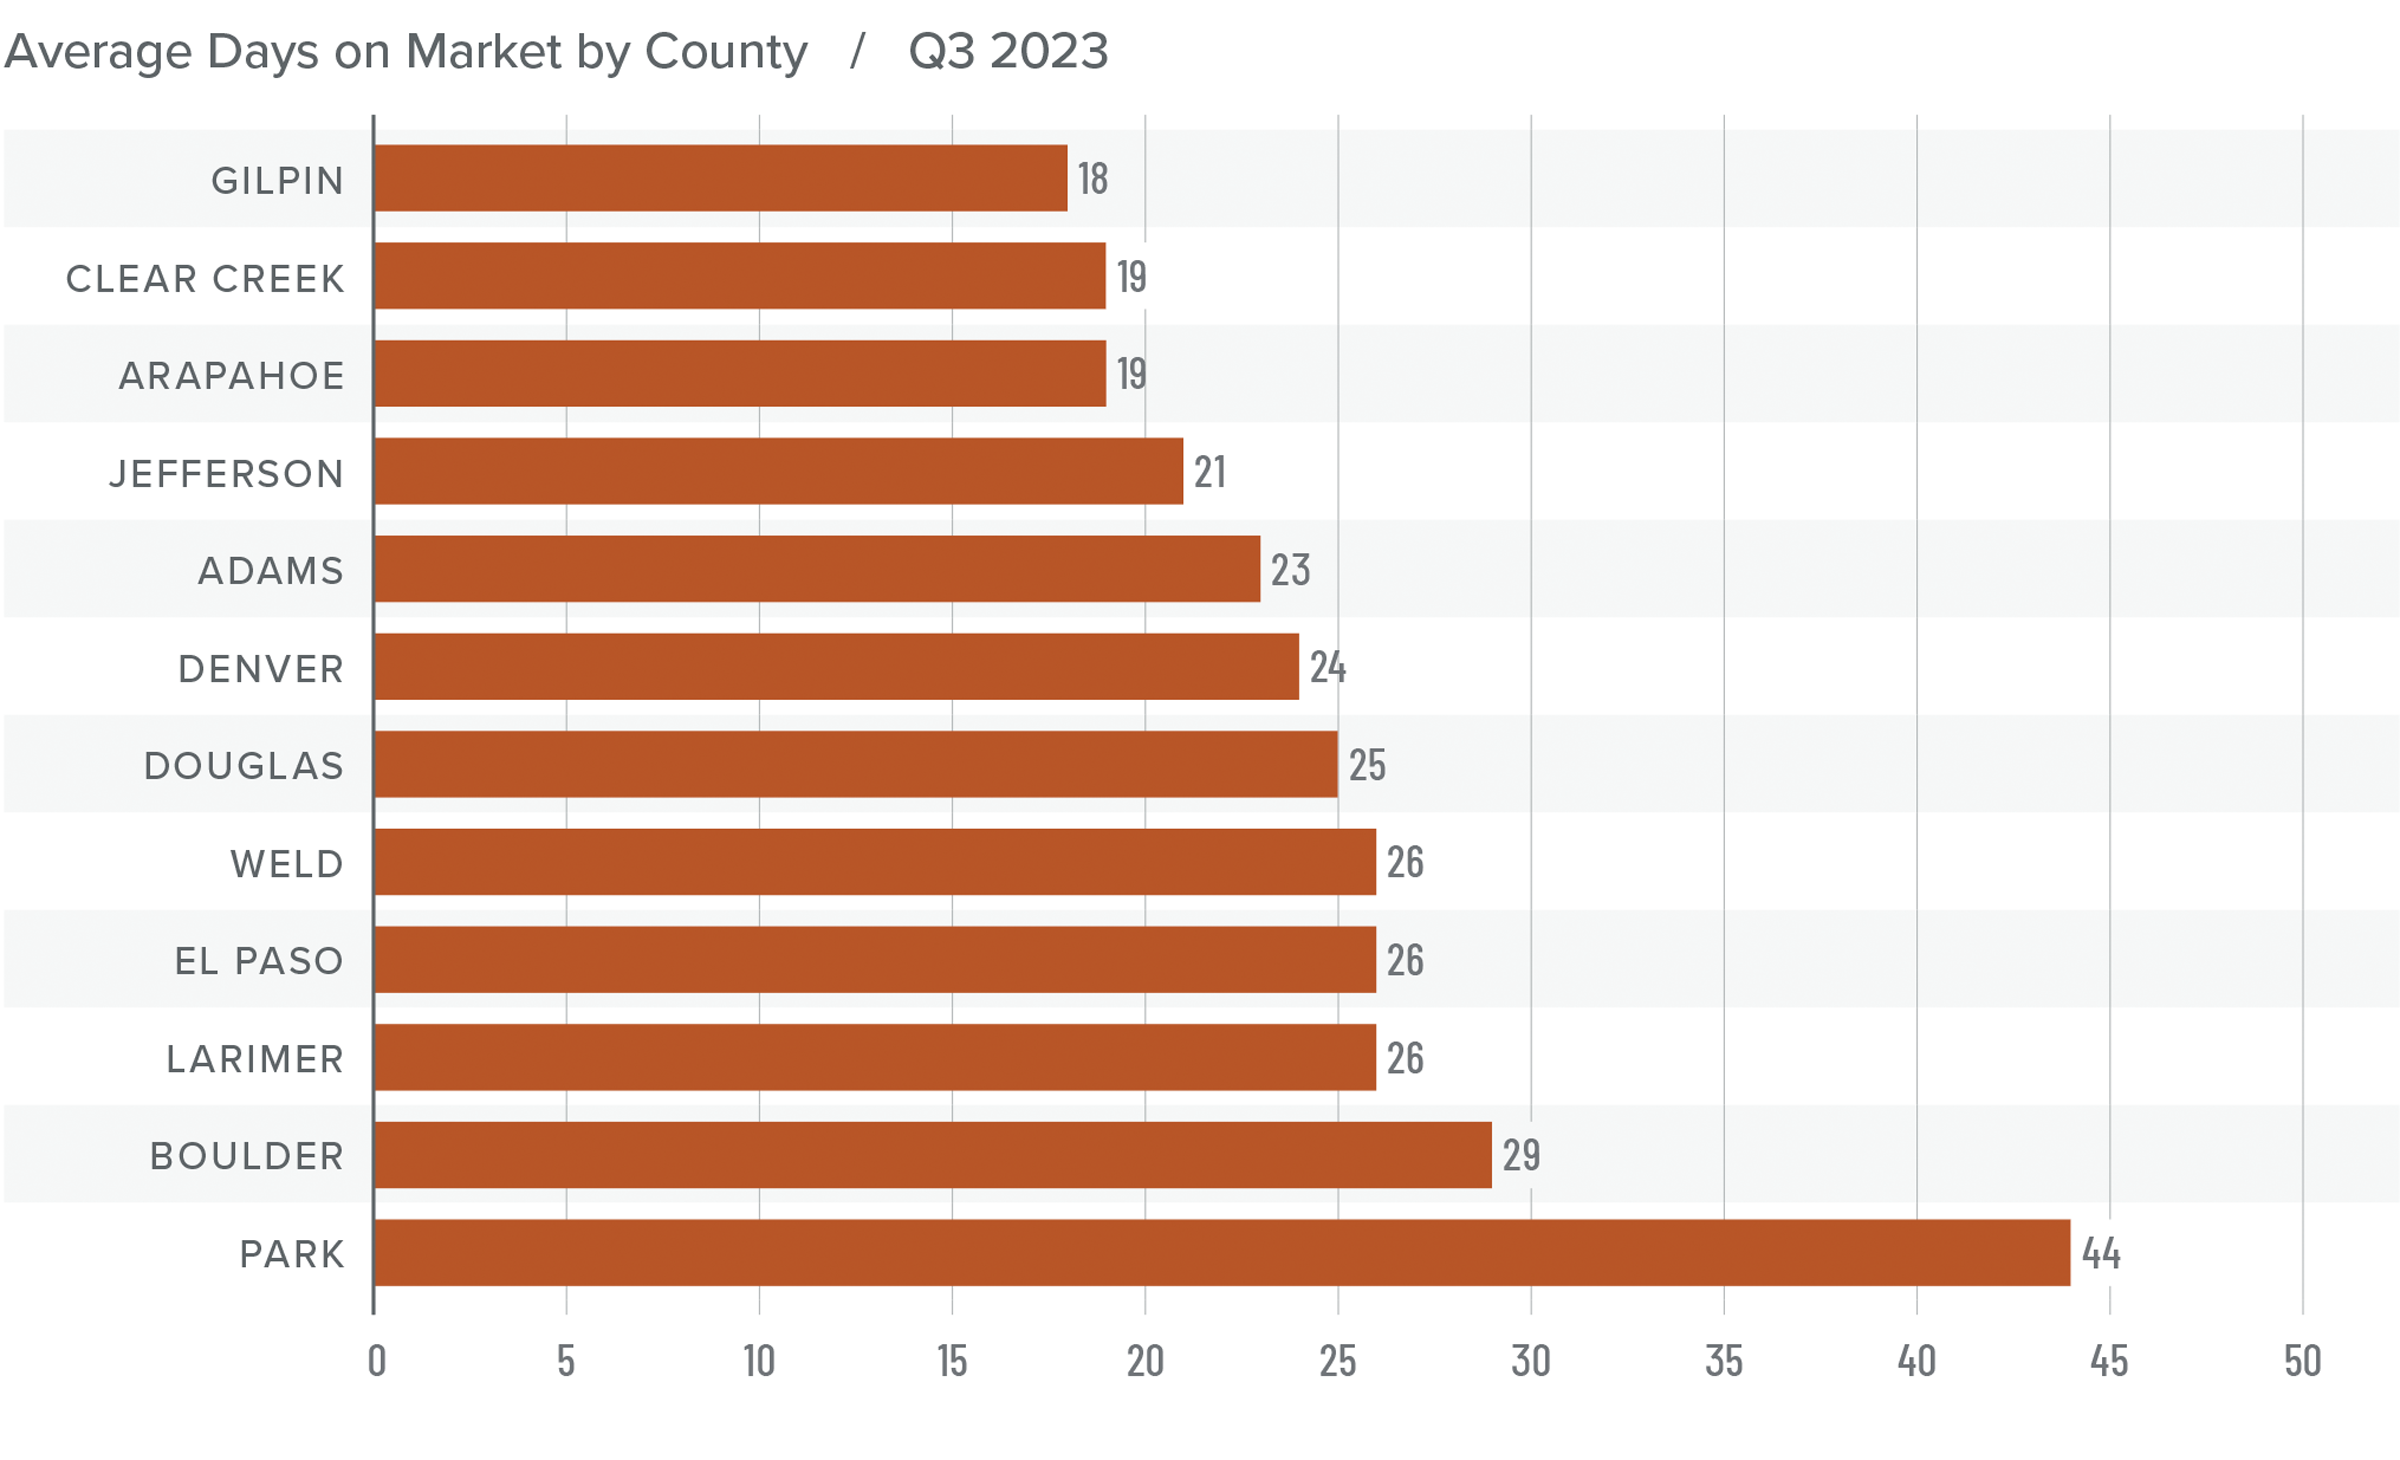
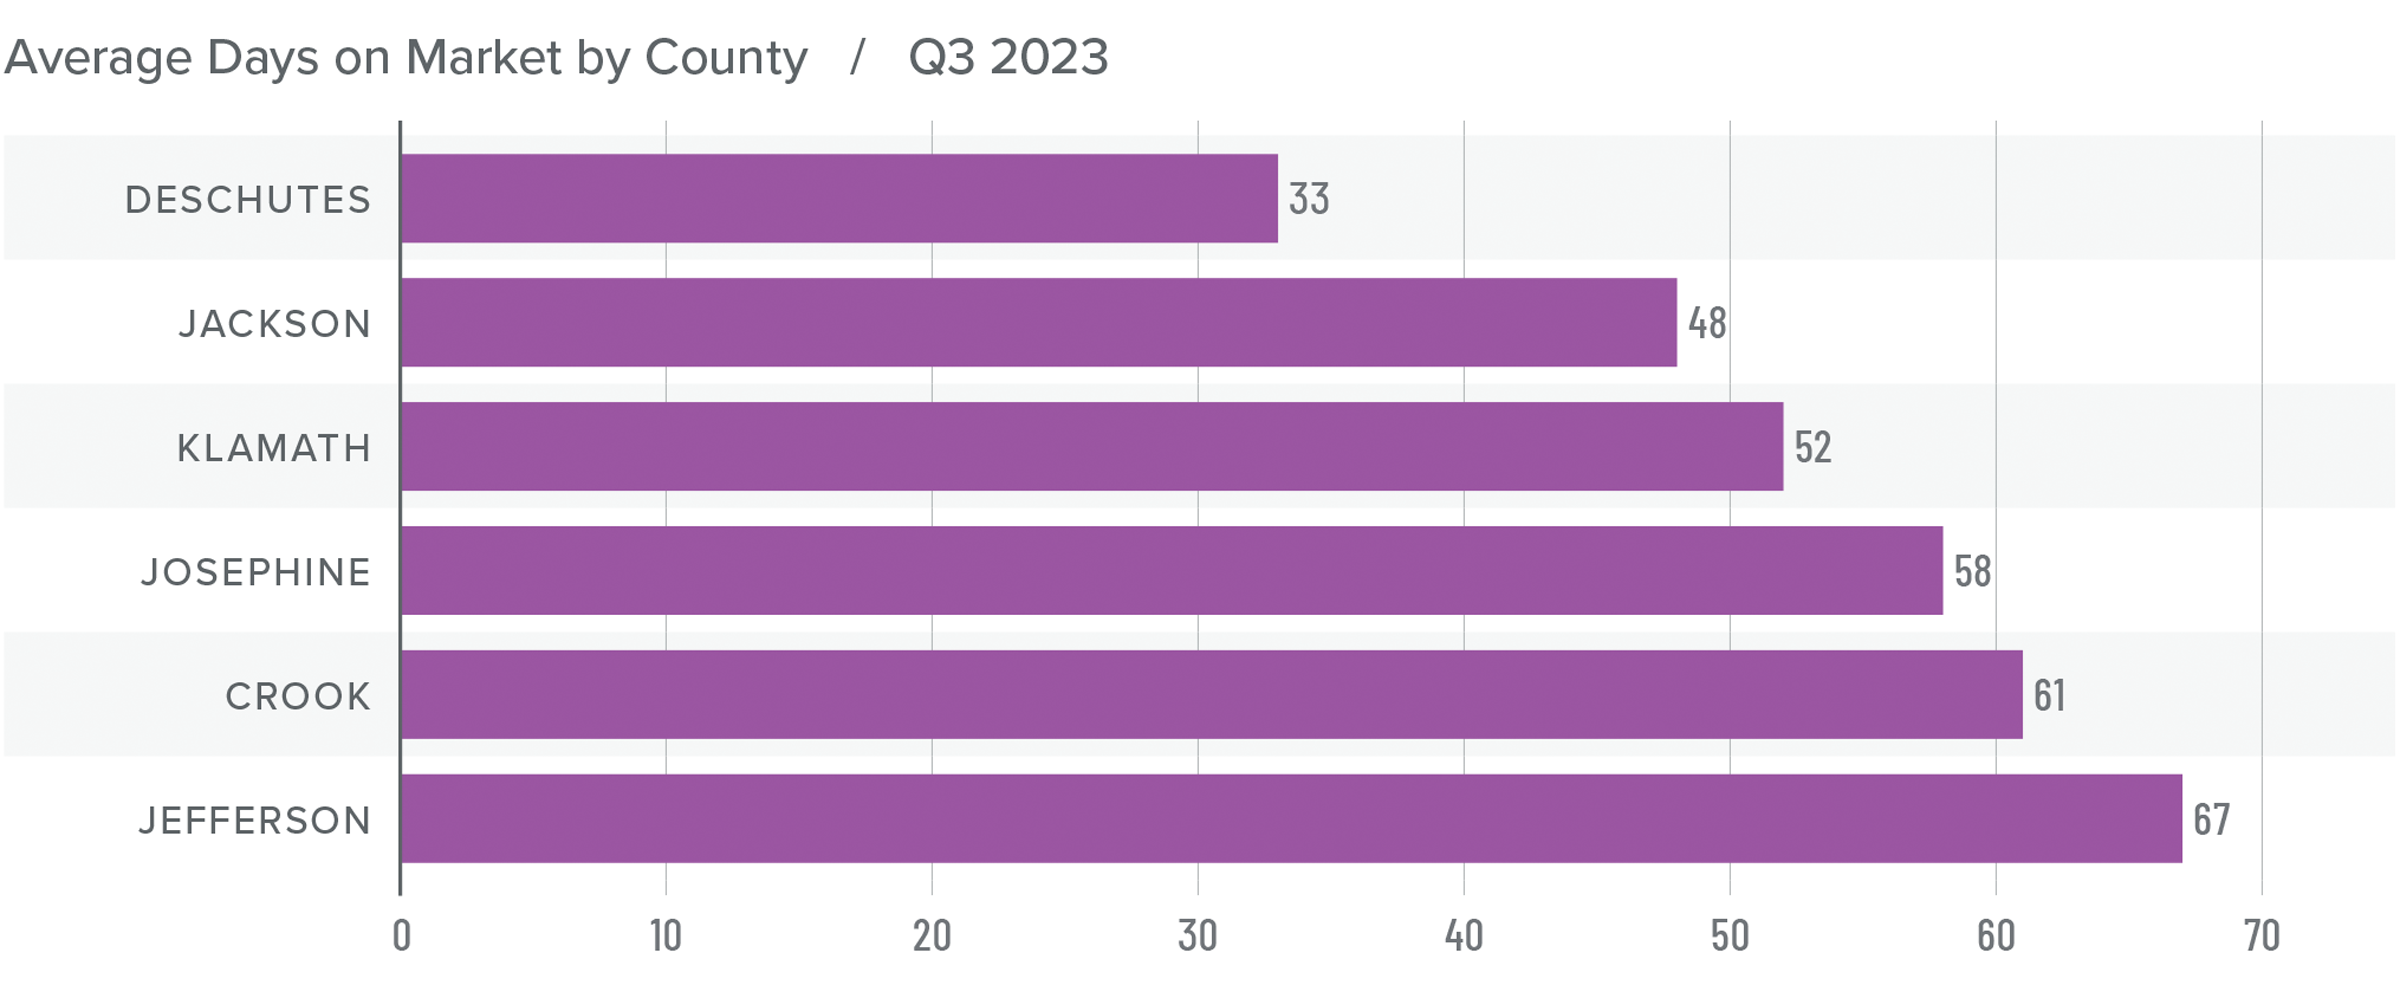
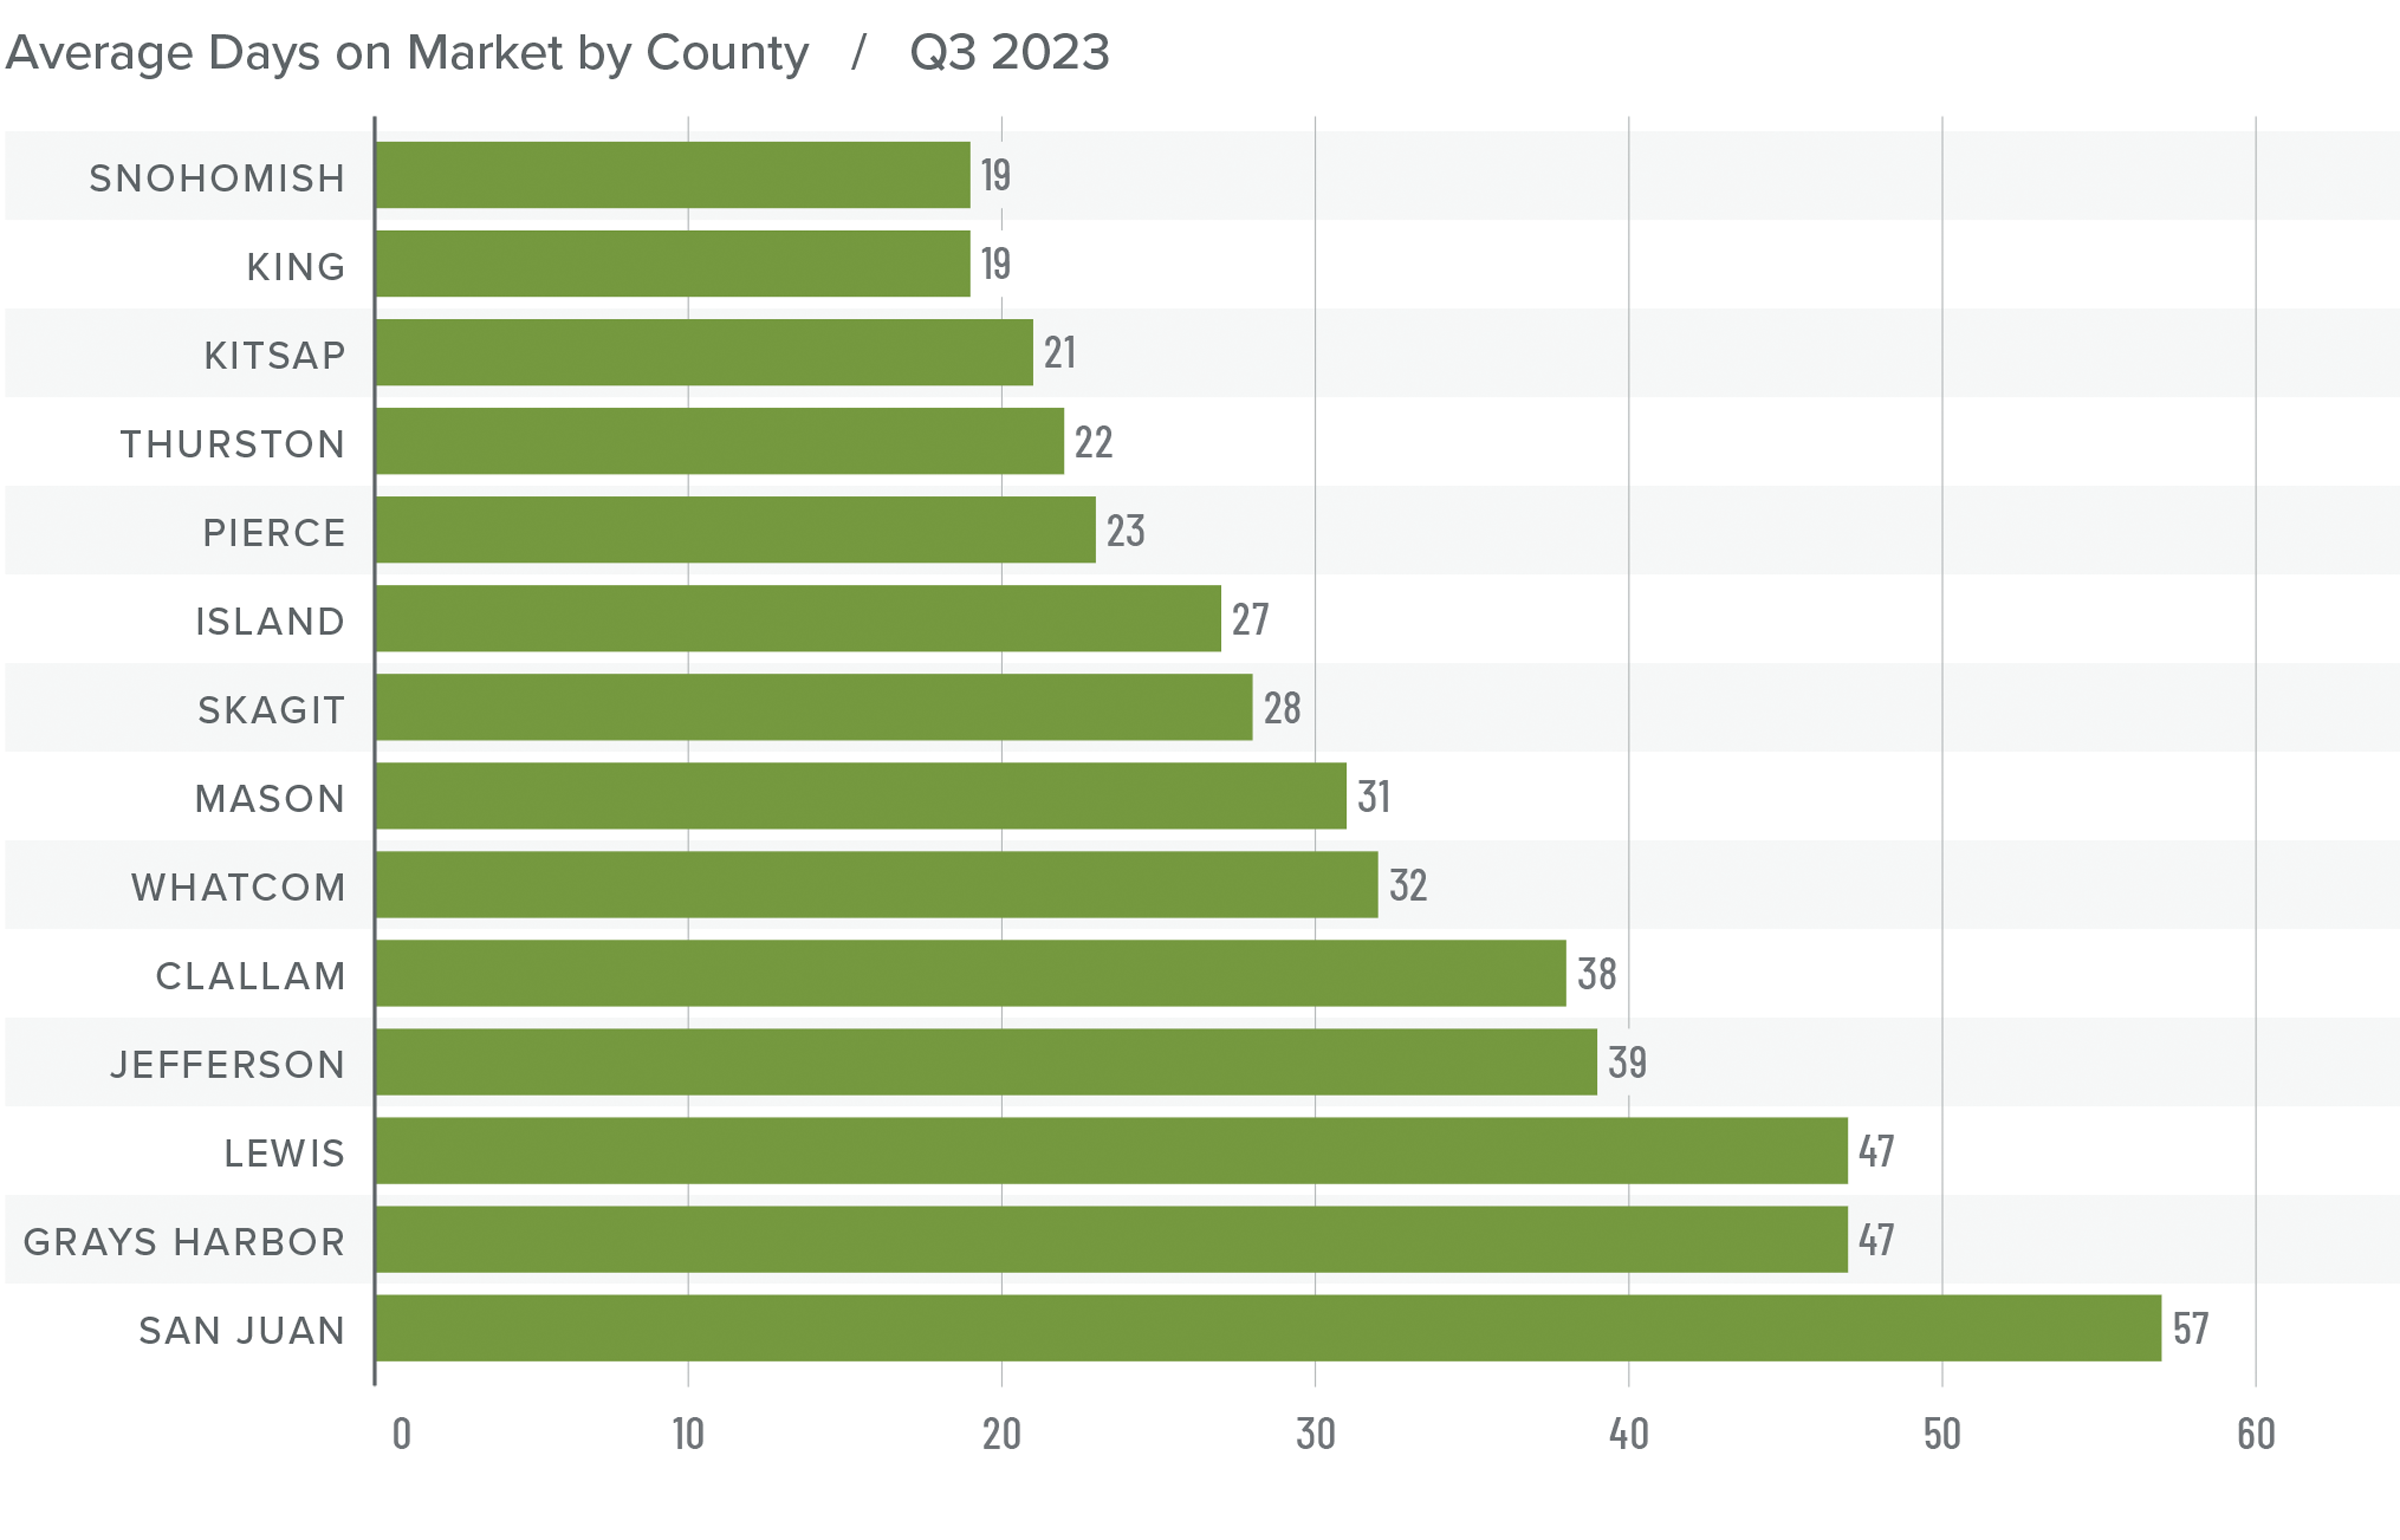
Montana Days on Market
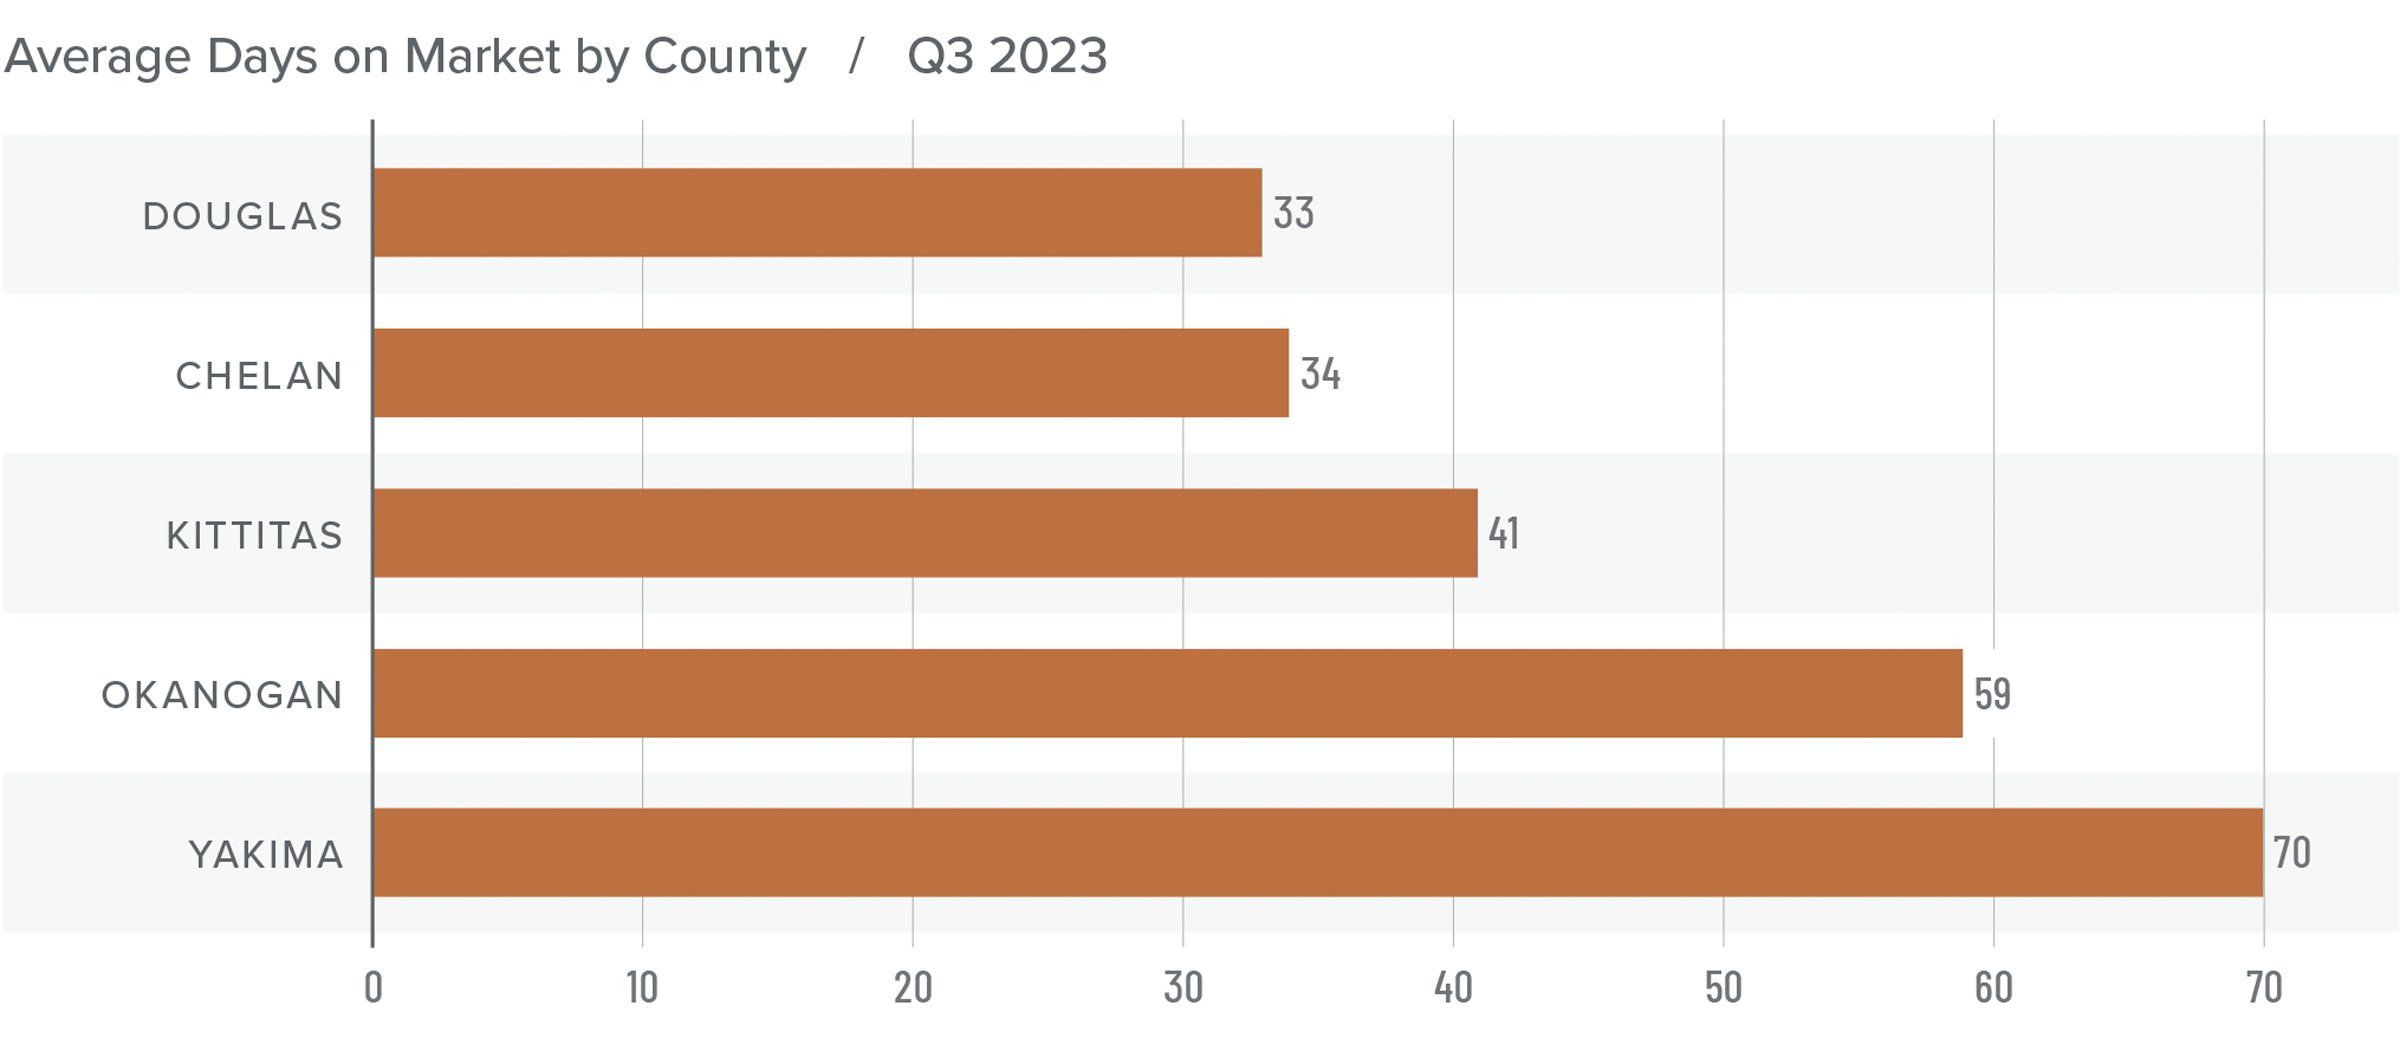
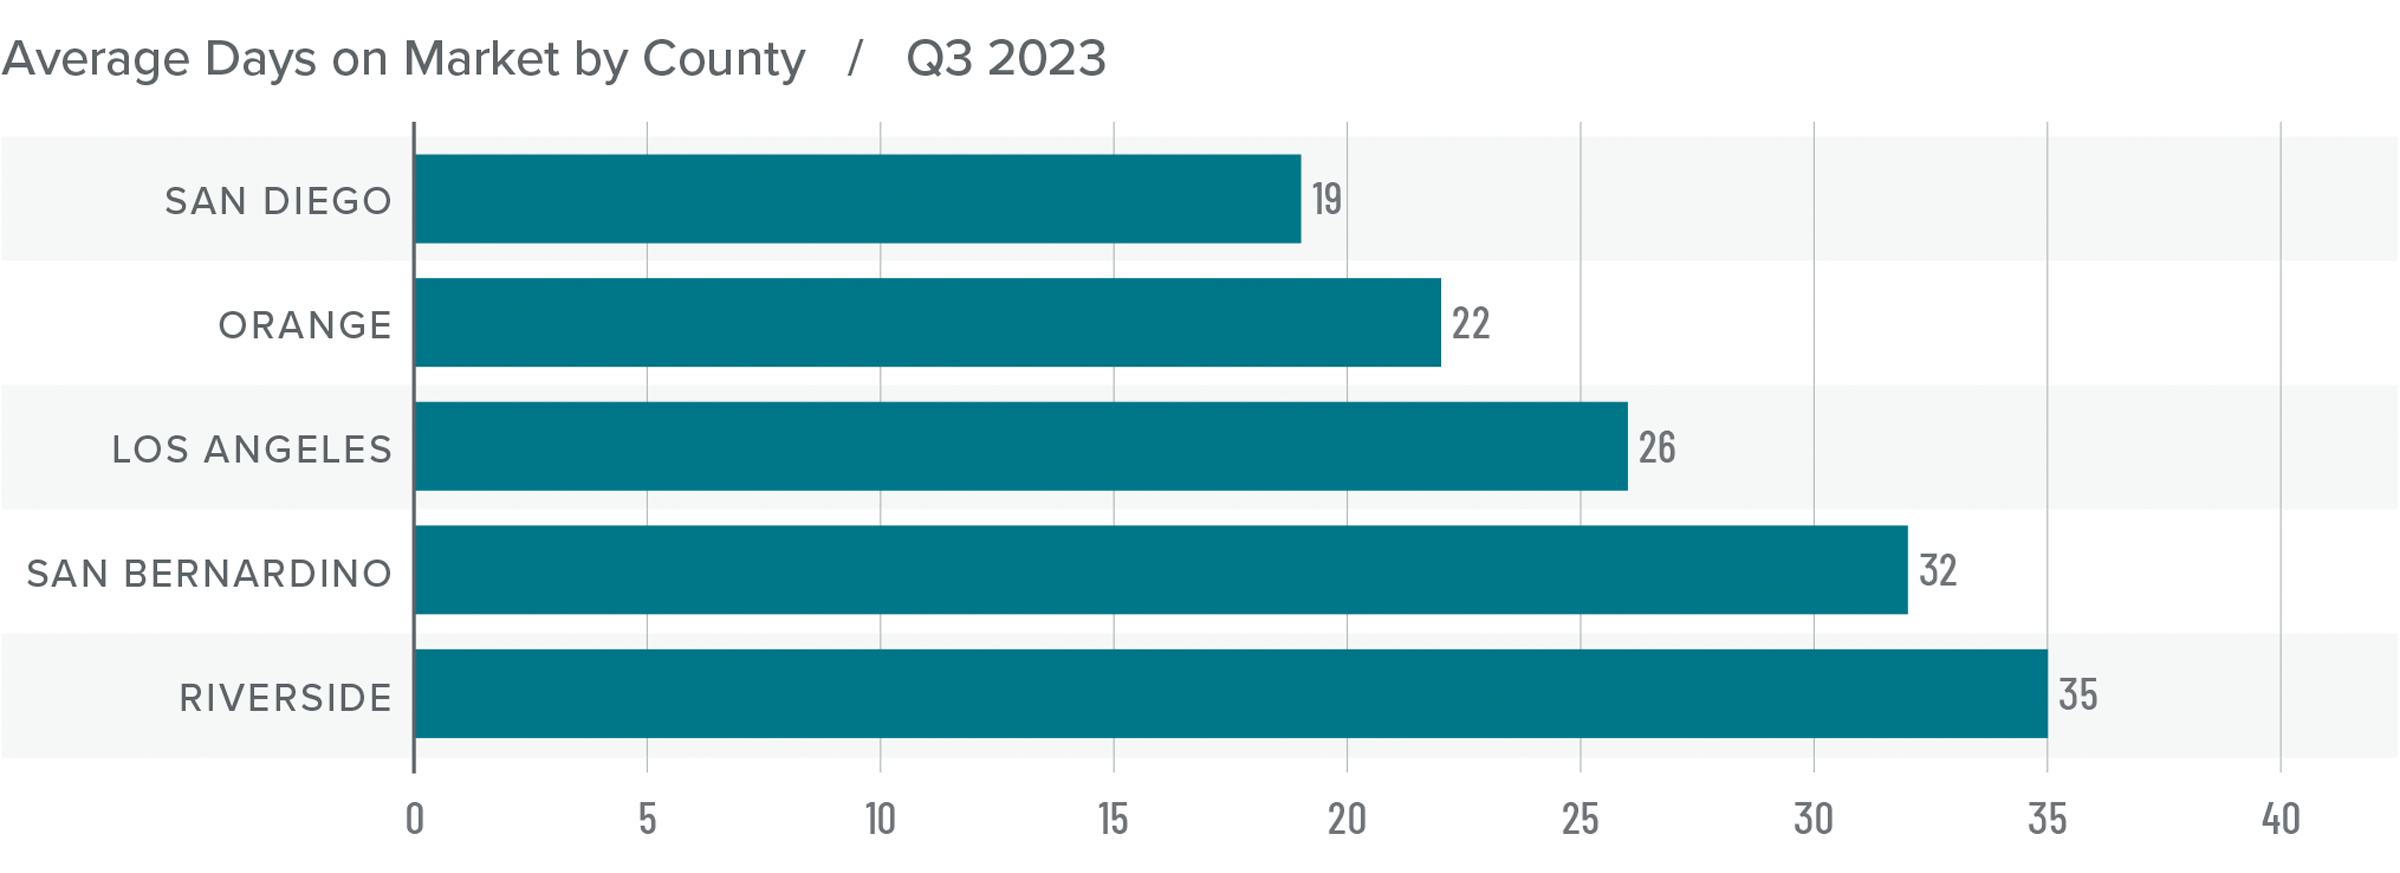
❱ The average time it took to sell a home rose six days compared to the same period in 2022. Time on market fell 11 days compared to the second quarter of 2023.
❱ Homes sold fastest in Park County while homes in Flathead County took the longest time to sell. Compared to the third quarter of 2022, market time fell in Missoula, Lewis and Clark, Broadwater, Jefferson, and Park counties but rose in the rest of the region.
❱ During the third quarter, it took an average of 68 days to sell a home in the markets covered by this report.
❱ Compared to the second quarter of this year, average market time rose in only three counties (Lake, Lewis and Clark, and Madison), was flat in Ravalli, and fell everywhere else.
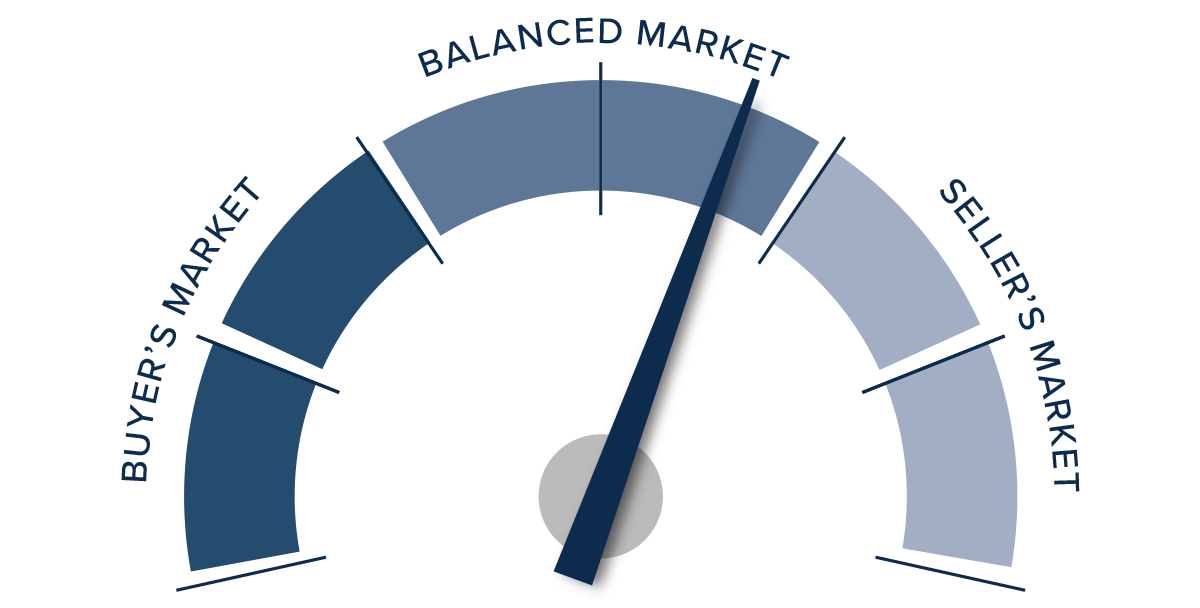
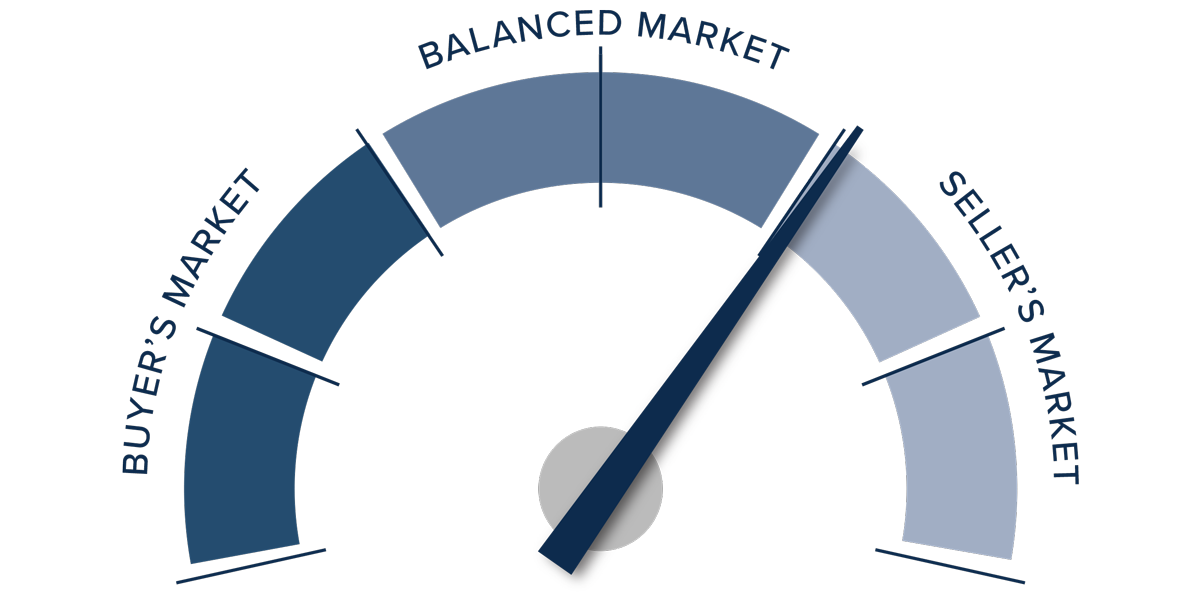
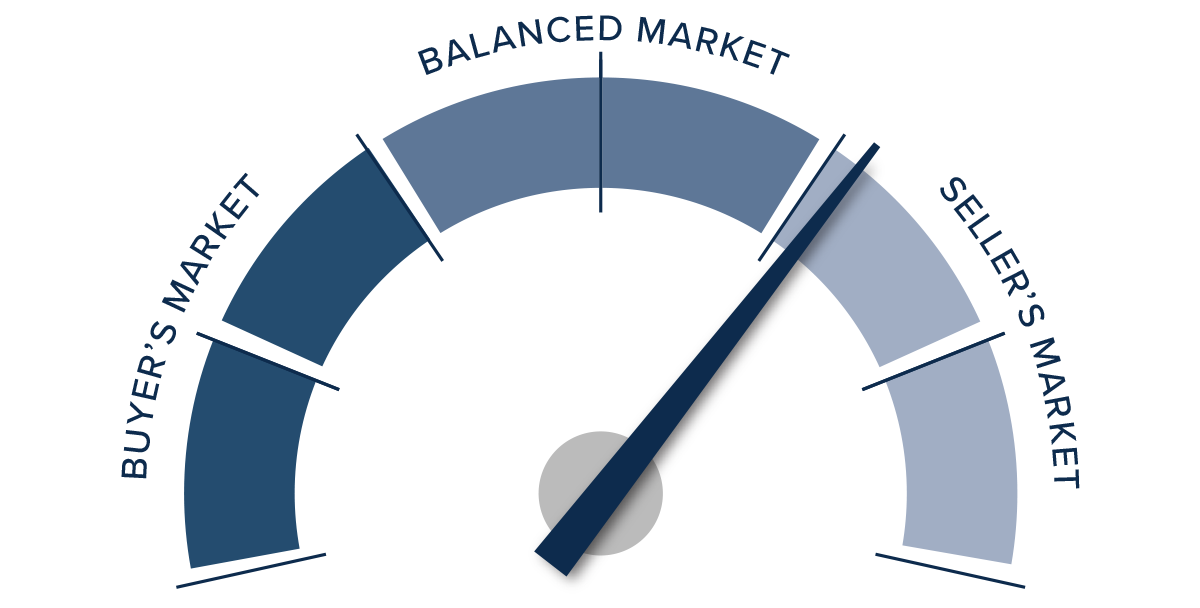
Conclusions
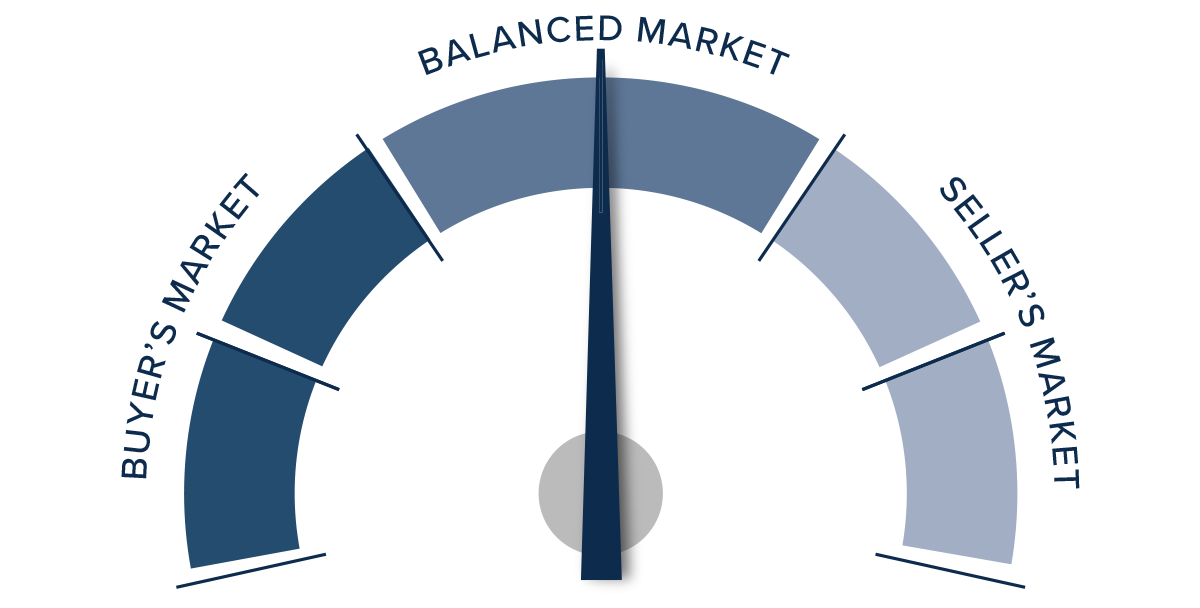
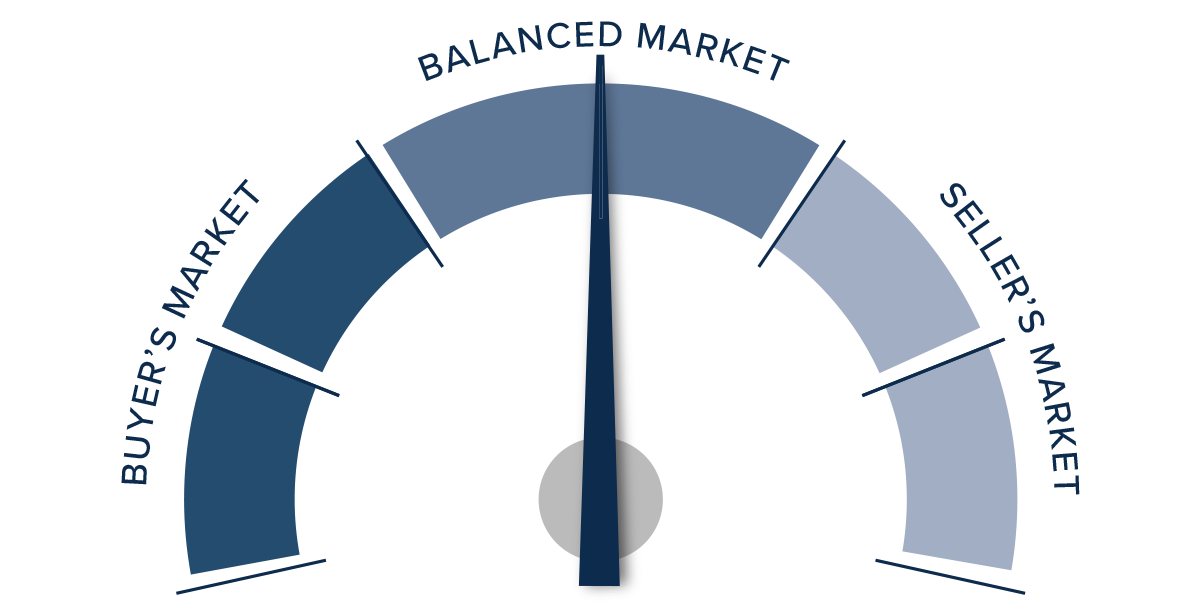
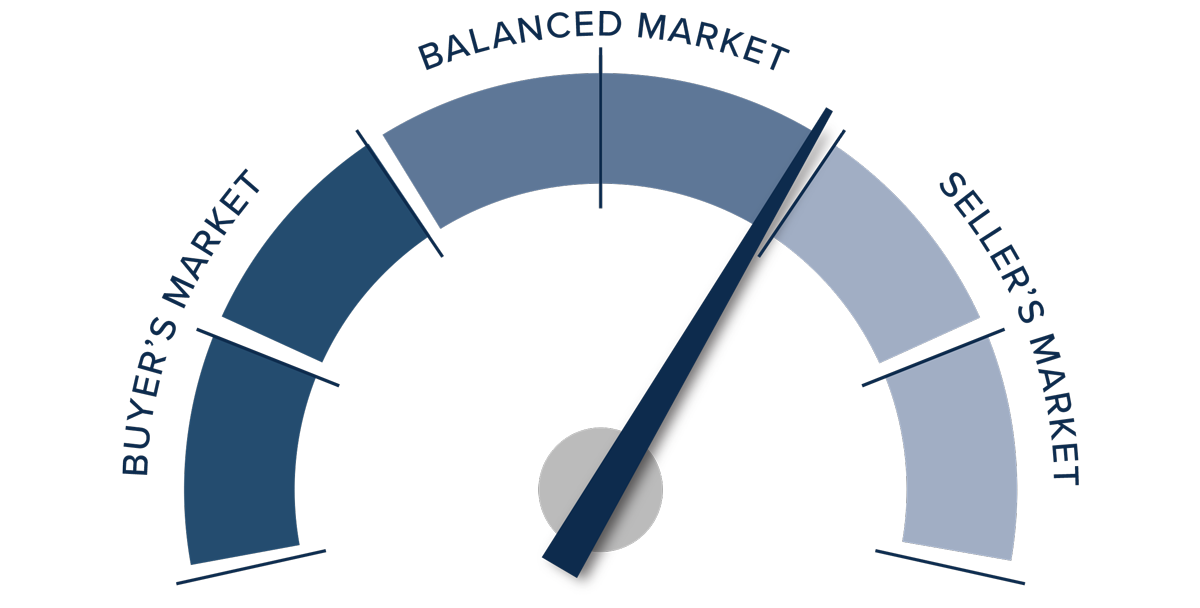
This speedometer reflects the state of the region’s real estate market using housing inventory, price gains, home sales, interest rates, and larger economic factors.
As mentioned earlier, it doesn’t appear that rising mortgage rates have had the same negative effect in Montana that has been felt across most of the country. In the third quarter, home sales and sale/ list prices rose while market time fell, which are all factors that favor sellers. However, rising inventory and falling pending sales would suggest that the market may be ready to shift toward buyers.
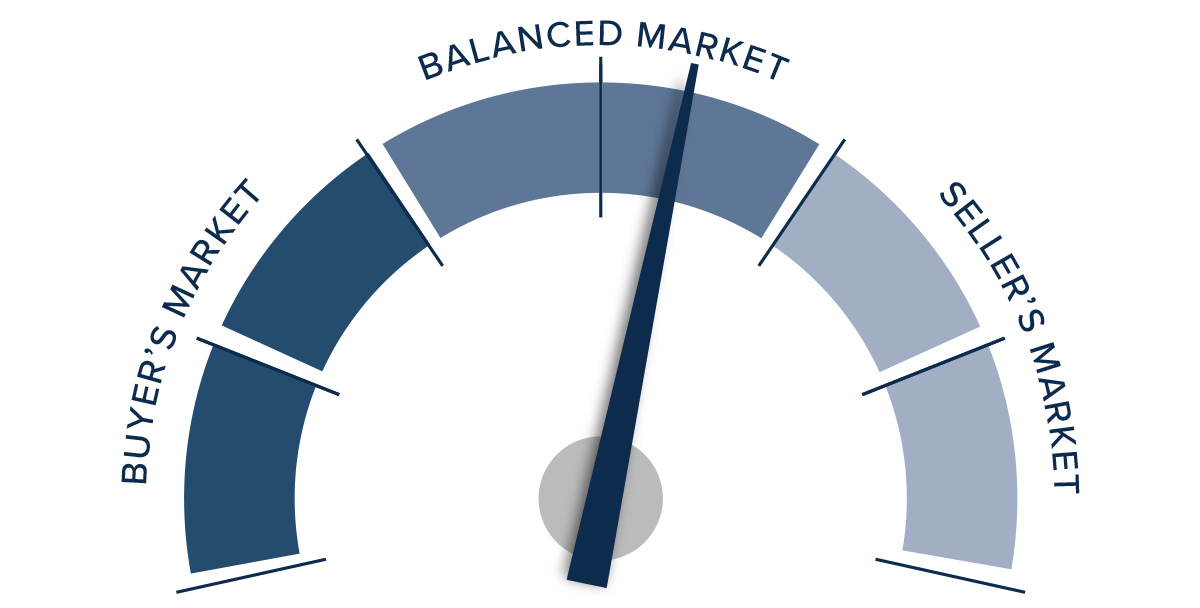
Although the market is expected to slow, it’s too early to suggest that it will favor buyers any time soon. Given all these factors, the needle stays in the balanced quadrant but moved slightly in favor of home sellers.


")


